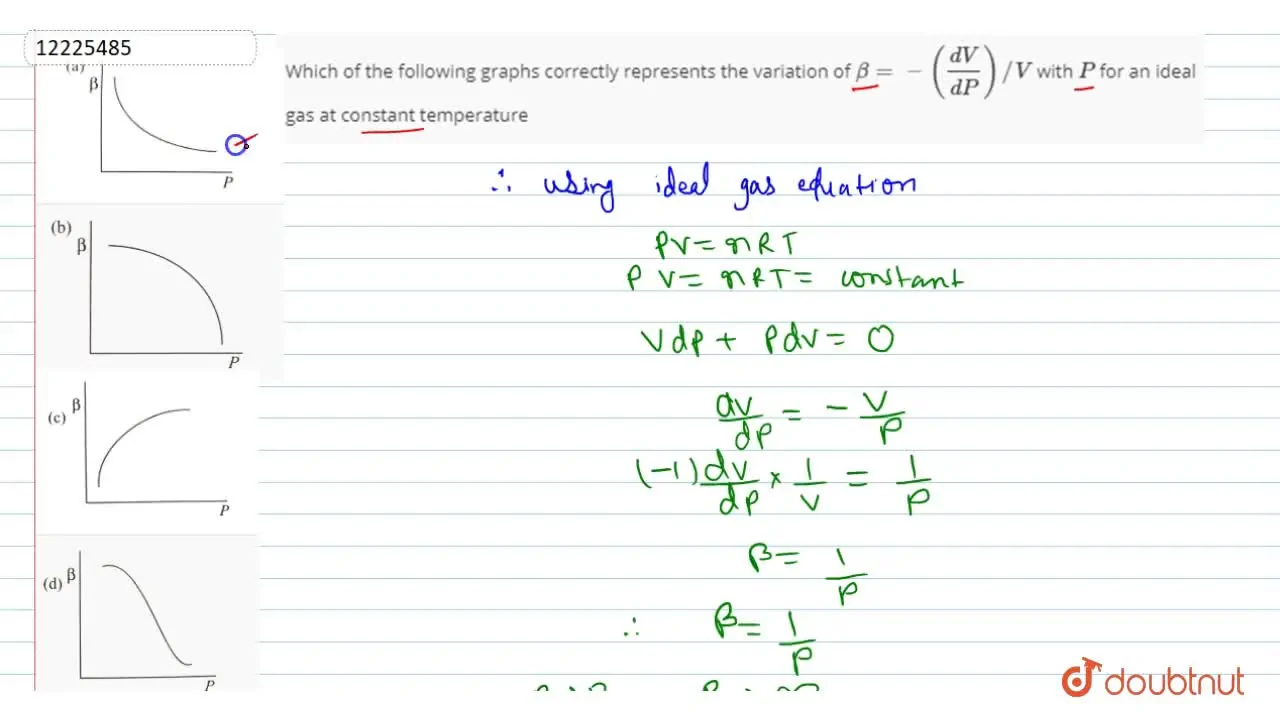
Which of the following graphs correctly represents the variation of β=−(dVdP)/V with P for an ideal gas at constant temperature
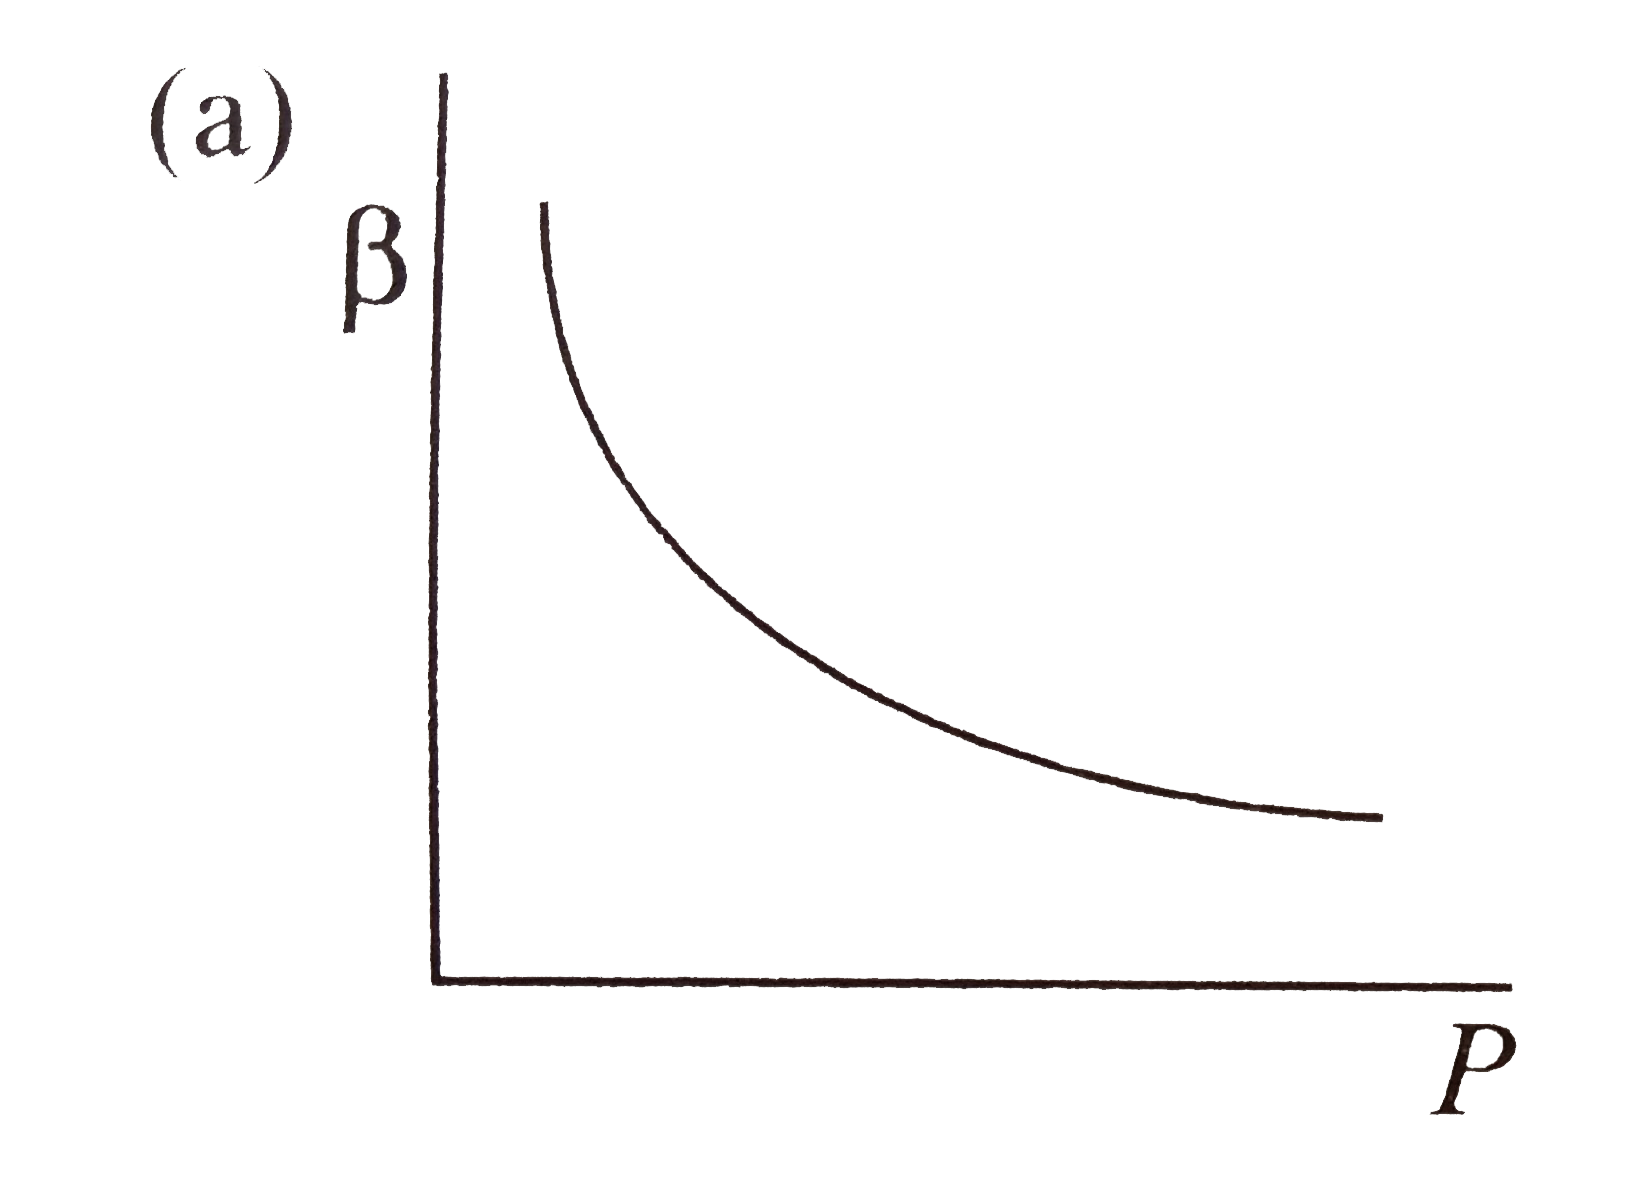
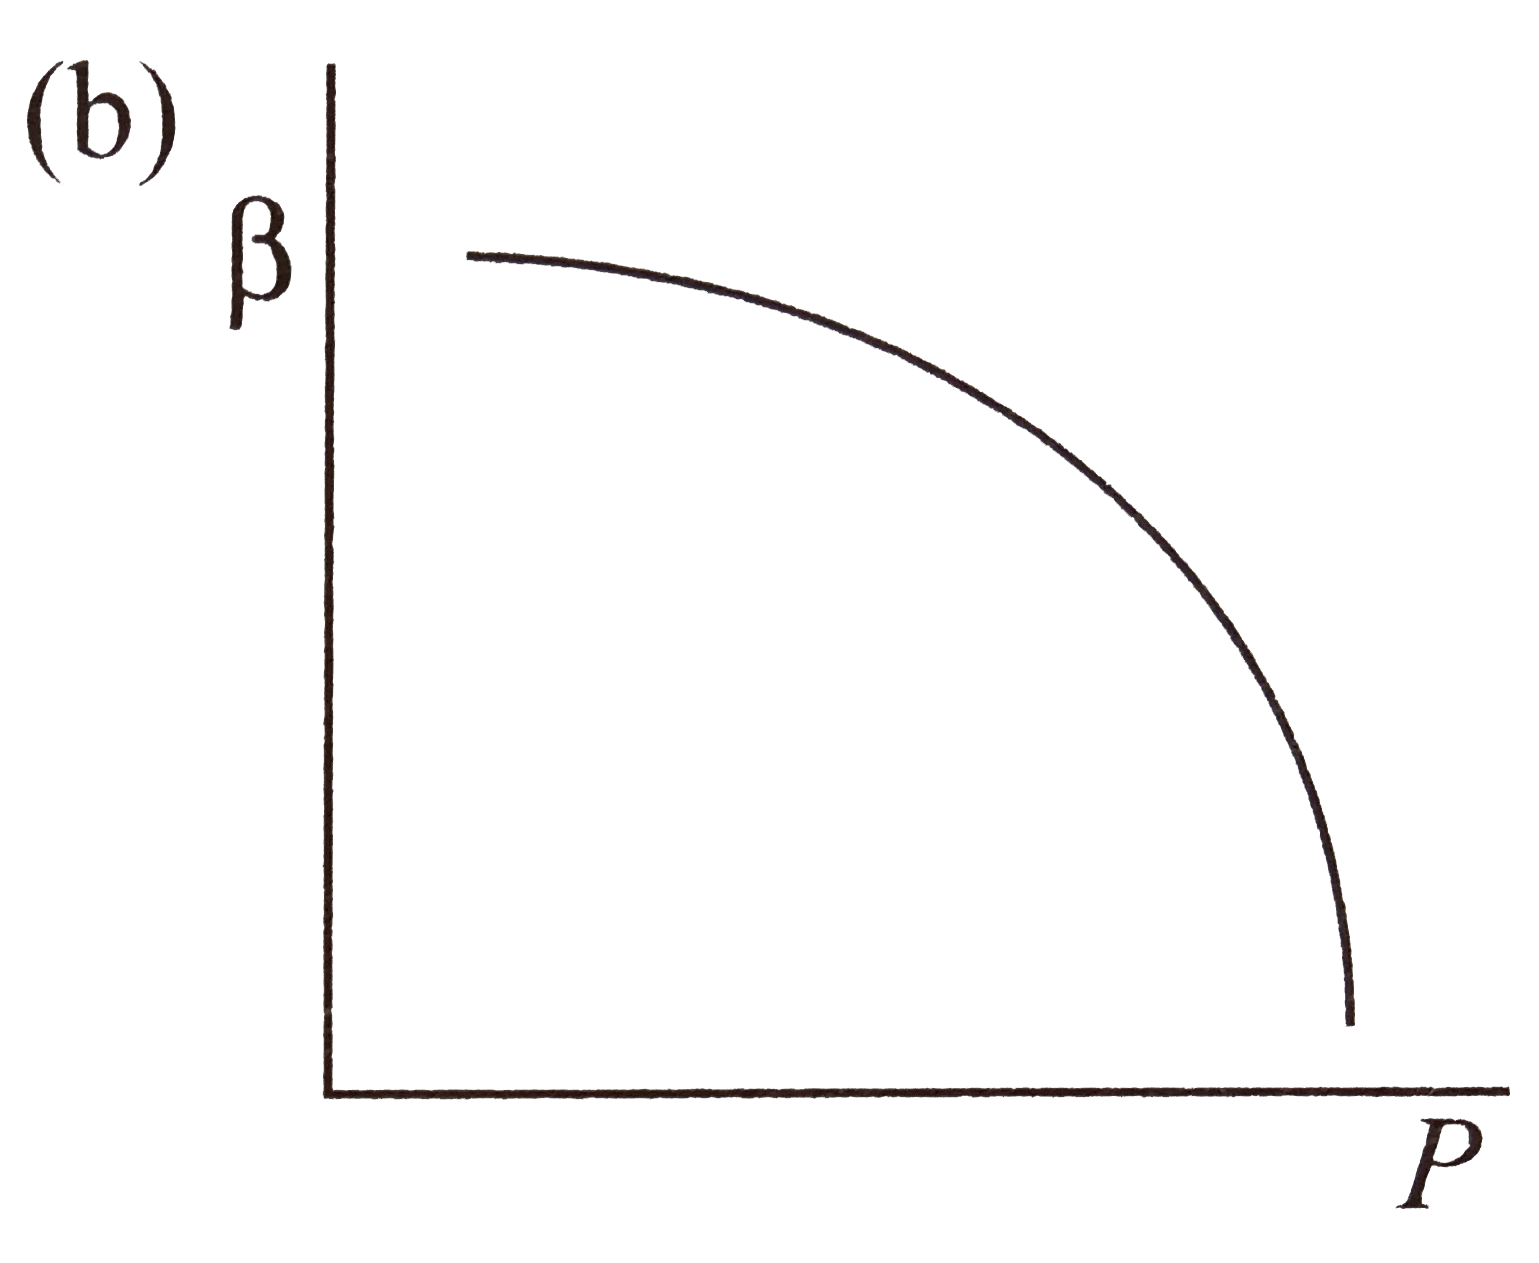
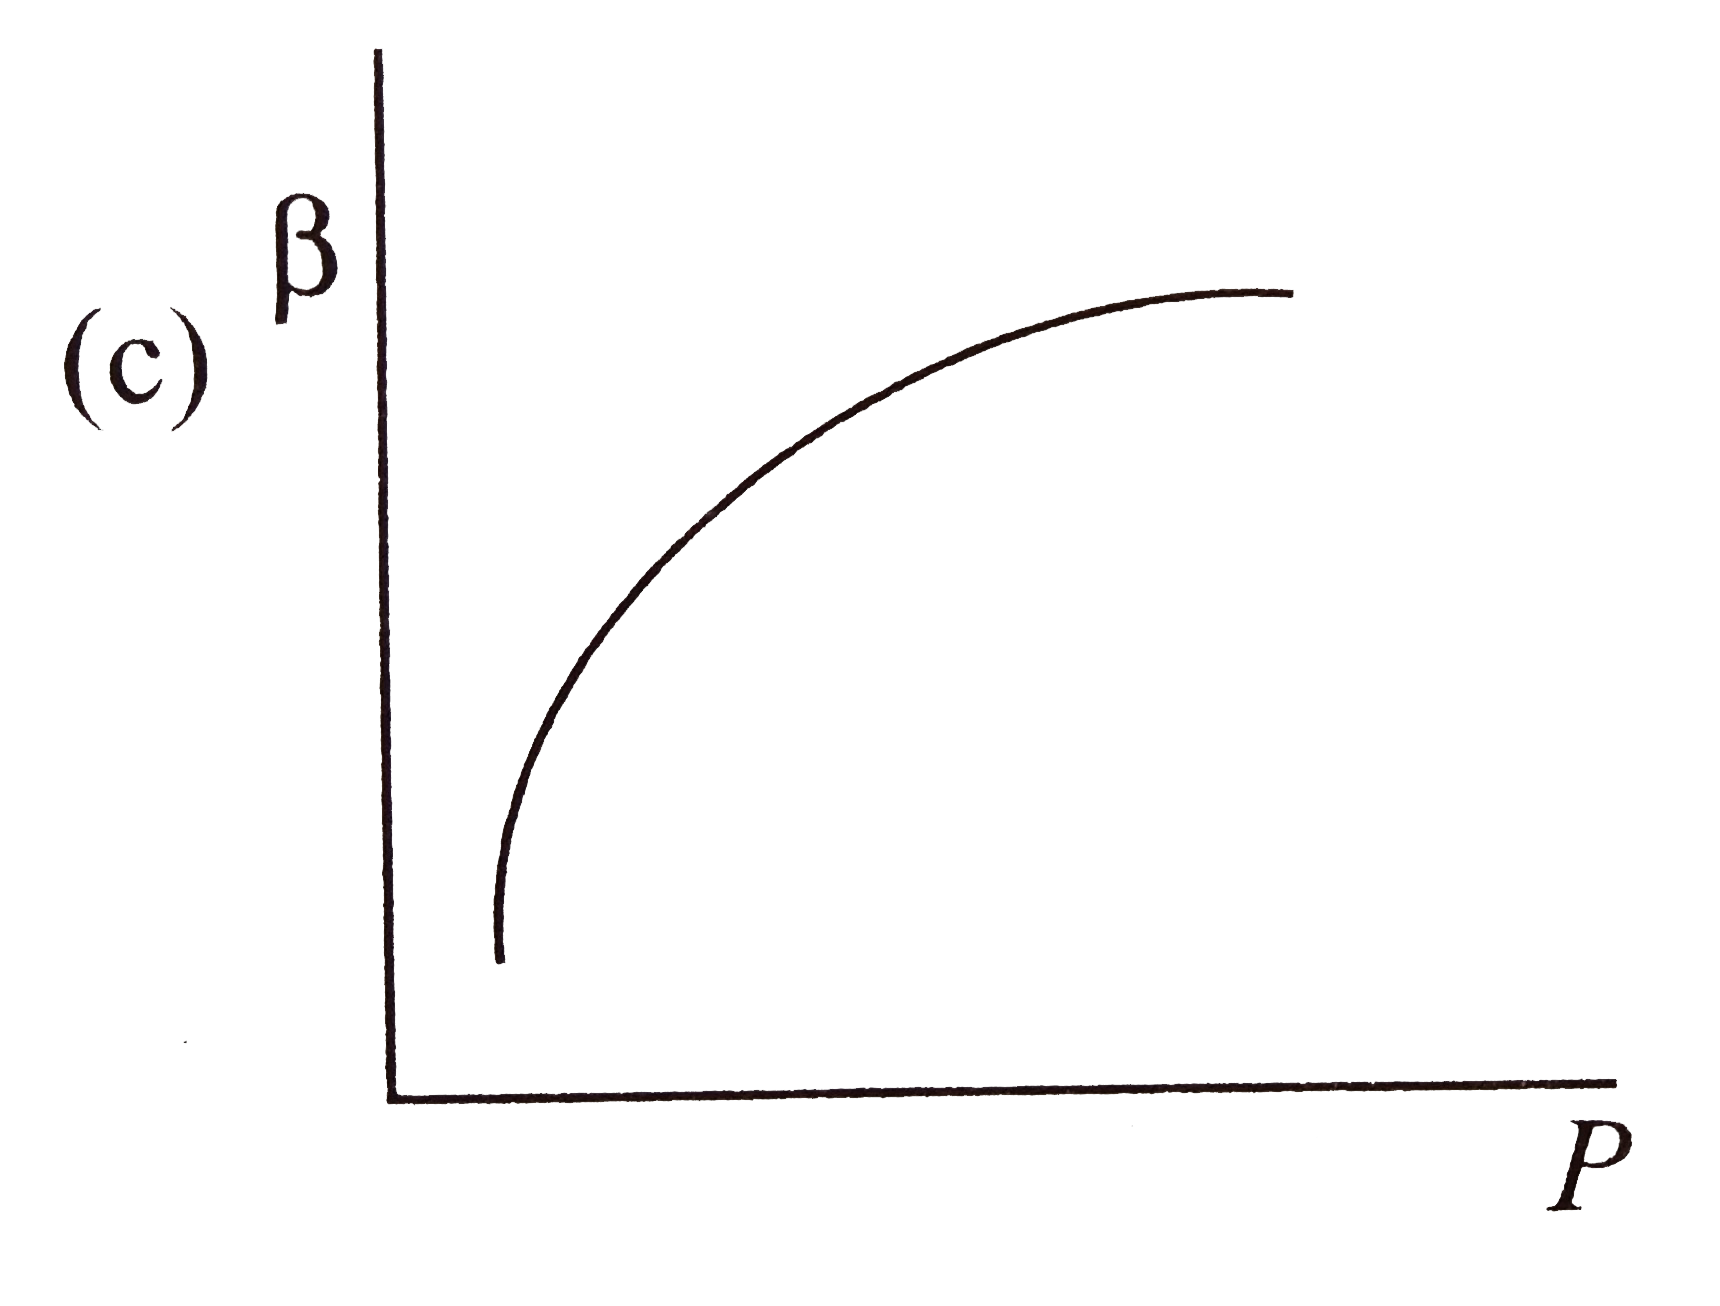
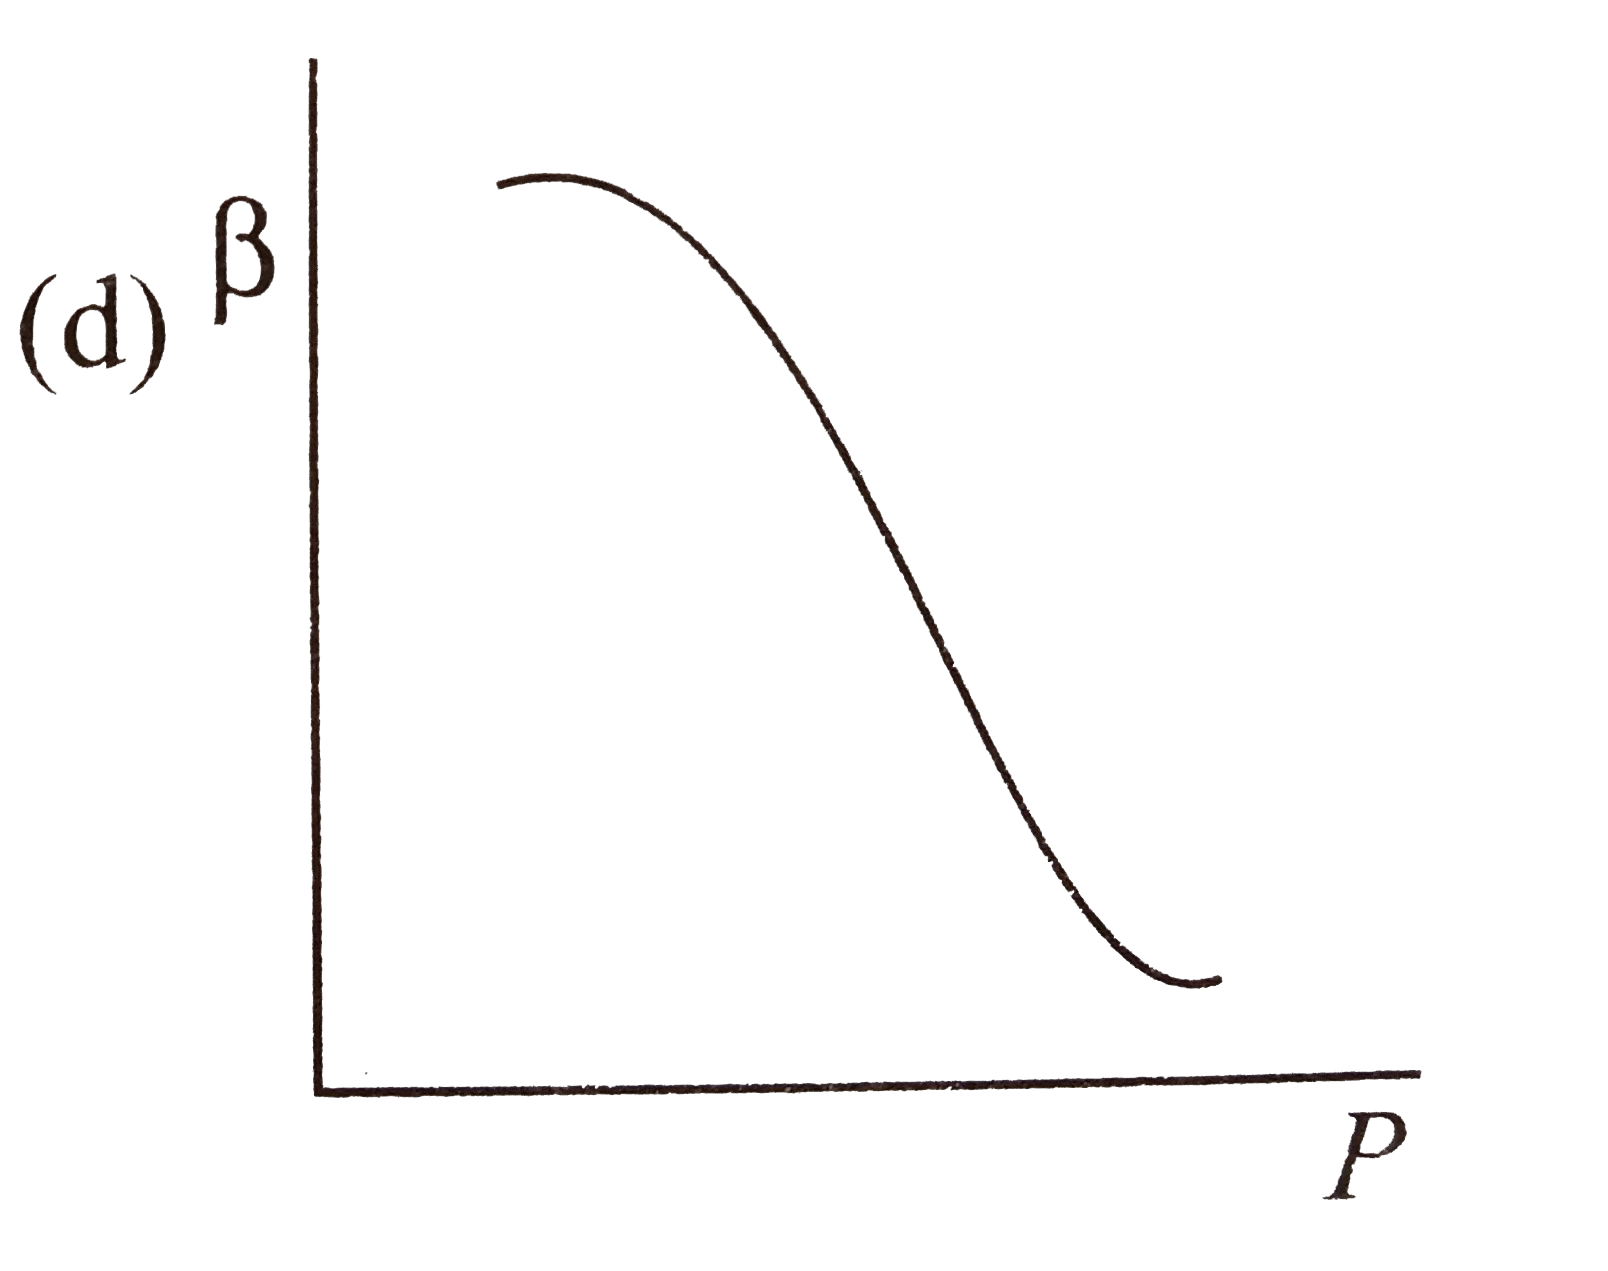
The correct Answer is:A
From PV=RT
dV.P+V.dP=0
or (dVdP)=−VP or β=1P (Rectangular hyperbola)
β×P=1. Thus plot of β Vs P gives (a)
Related Playlists
- BOOK - A2ZCHAPTER - STATES OF MATTEREXERCISE - Dalton'S Law Of Partial Pressure, Graham'S Law Of Diffusion/ Effusion37videos
STATES OF MATTER
- BOOK - A2ZCHAPTER - STATES OF MATTEREXERCISE - Kinectic Theory Of Gases, Maxwell Distribution Of Speed45videos
STATES OF MATTER
- BOOK - A2ZCHAPTER - STATES OF MATTEREXERCISE - Section D - Chapter End Test30videos
STATES OF MATTER
- BOOK - A2ZCHAPTER - SOME BASIC PRINCIPALS OF ORGANIC CHEMISTRYEXERCISE - Section D - Chapter End Test60videos
SOME BASIC PRINCIPALS OF ORGANIC CHEMISTRY
Similar Questions
Which of the following graphs correctly represents the variation of β=−(dVdP)1V with P for an ideal gas at constant temperature ?
View SolutionWhich of the following graphs correctly represents the variation of β=−dV/dPV
with P for an ideal gas at constant temperature?View Solutionwhich of the following graphs correctly represents the vatiation β=−(dVdP)T/V with P for an ideal gas at constant temperature ? .
View SolutionWhich of the following graph is correctly represented?
View SolutionWhich of following graphs correctly represent variation of α=−(dV/dP)TV with P for fixed amount of an ideal gas at constant temperature ?
View SolutionWhich of the following graphs represent the behaviour of an ideal gas ?
View SolutionWhich one of the following graphs correctly gives the ideal gas behaviour ?
View SolutionAt a constant pressure, of the following graphs that one which represents the variation of the density of an ideal gas with the absolute temperature T, is
View SolutionWhich of following graphs correctly represents the variation of particle momentum with de-Broglie wavelength?
View Solutionwhich of the following graph represents the variation of resistivity (ρ) with temperature (T) for copper?
View Solution

