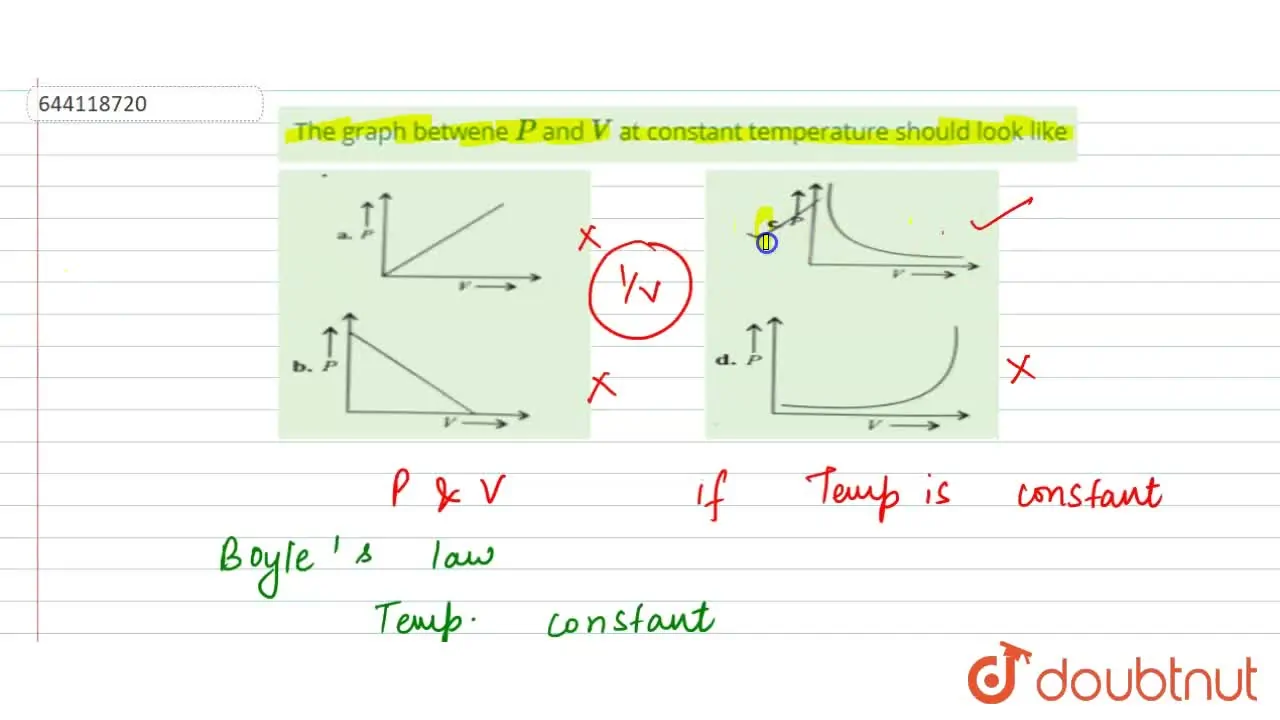
The graph betwene and at constant temperature should look like
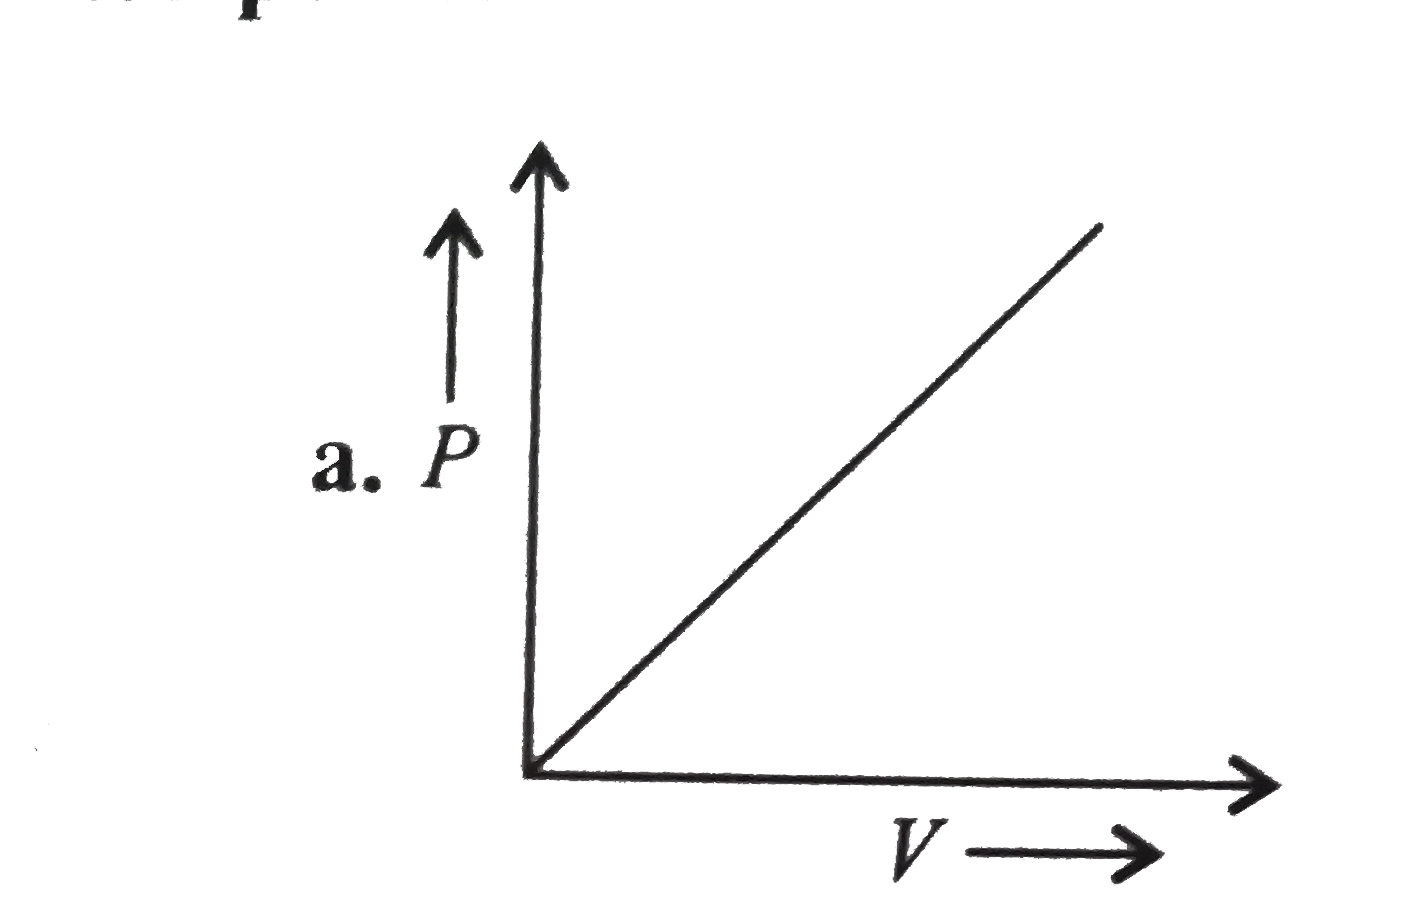
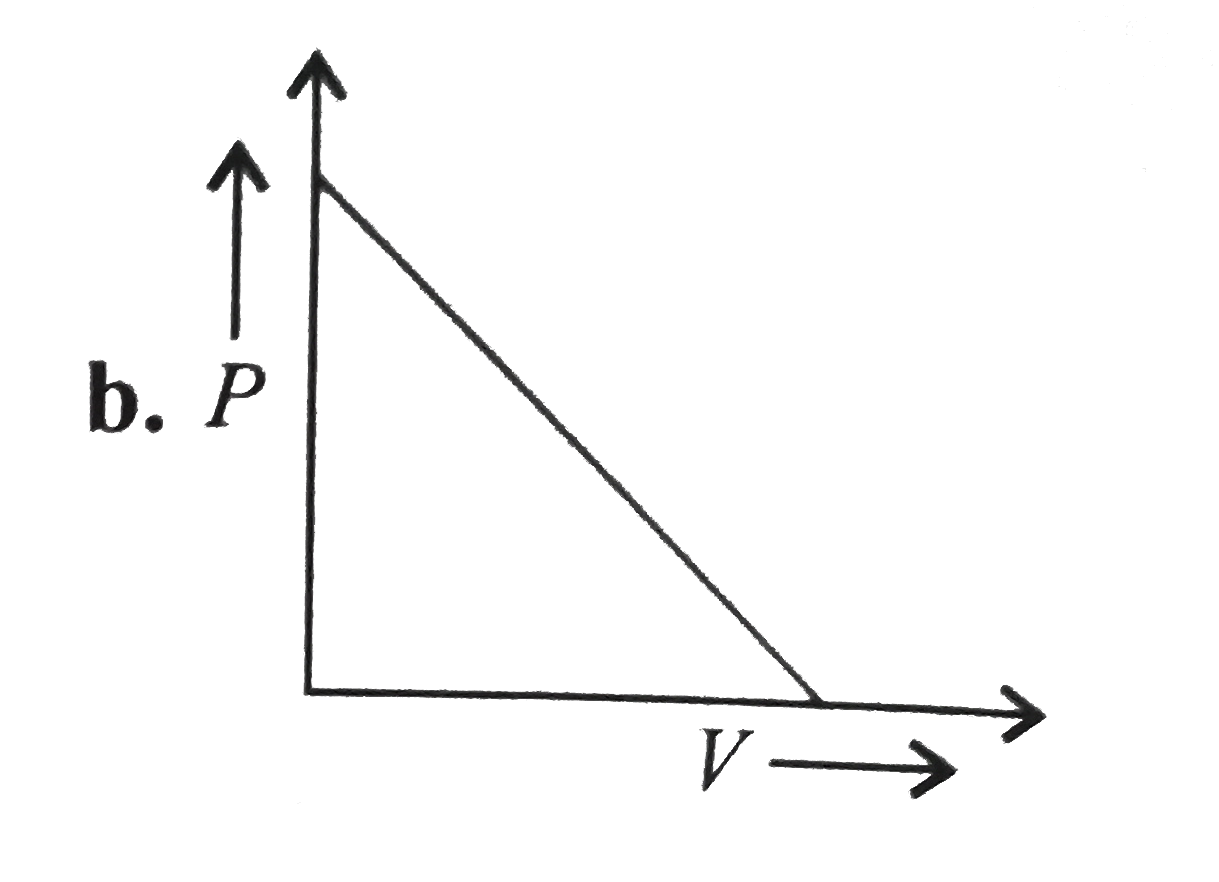
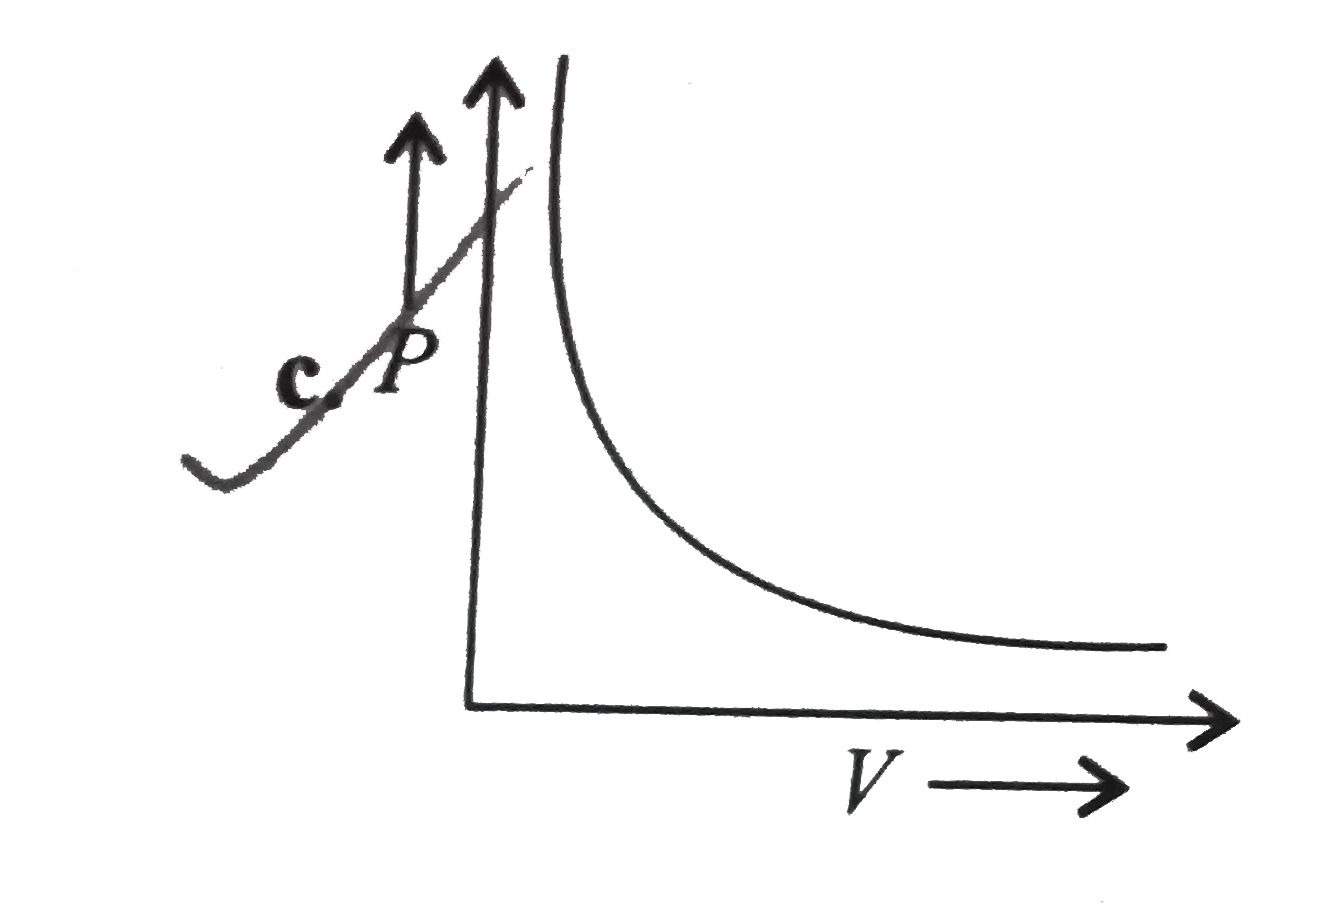
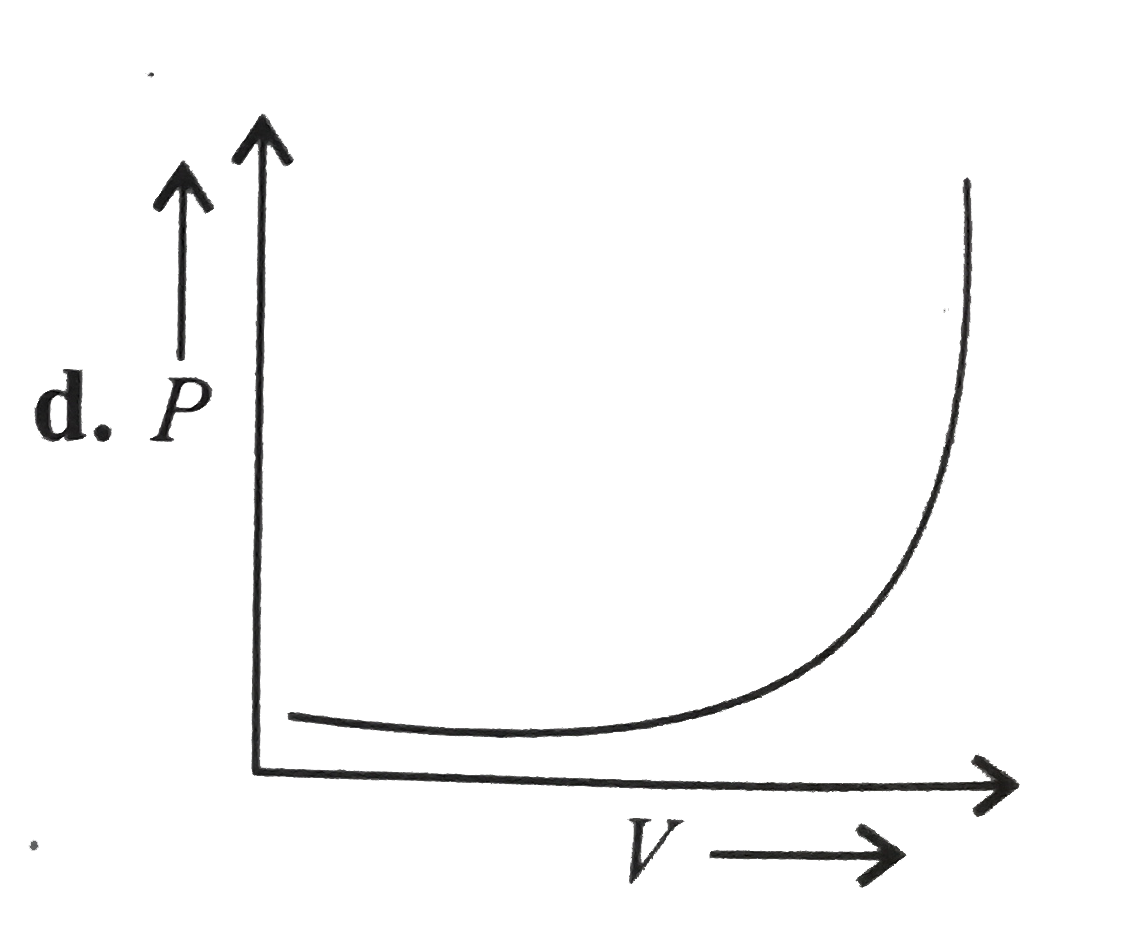
(Boyle's law)
Related Playlists
Similar Questions
The slope of the graph between log P and log V at constant temperature for a given mass of gas is
View SolutionThe graph between PV vs P at constant temperature is linear parallel to the pressure axis.
View SolutionWhat is the type of graph between log P and log V at constant temperature?
View SolutionA student measures the focal length of a convex lens by putting an object pin at a distance u from the lens and measuring the distance v of the image pin. The graph between u and v plotted by the student should look like
View SolutionWhat is the type of graph between log P and log(1V) at constant temperature for a given amount of gas ?
View SolutionThe slope of the plot between pV and p at constant temperature is
View SolutionThe law describing realtionship between P and V of ideal gas at constant temperature is called..........
View SolutionThe graph between 1v and 1u for a concave mirror looks like.
View SolutionThe graph between 1v and 1u for a concave mirror looks like.
View SolutionThe graph between (P/T) and T for a gas at constant volume will be:
View Solution

