Match the following graphical variation with their description.
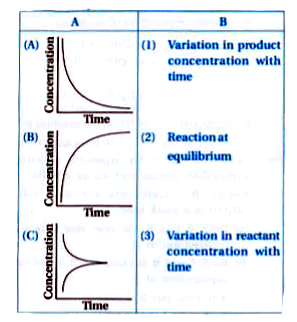
The correct Answer is:A-3,B-1,C-2
(A) Graph (A) represents variation of reactant concentration with time.
(B) Graph (B) represents variation of product concentration with time.
(C) Graph (C) represents reaction at equilibrium.
Related Playlists
- BOOK - KUMAR PRAKASHANCHAPTER - EQUILIBRIUMEXERCISE - SECTION-D NCERT Exemplar Problems (Assertions and Reason)7videos
EQUILIBRIUM
- BOOK - KUMAR PRAKASHANCHAPTER - EQUILIBRIUMEXERCISE - SECTION-D NCERT Exemplar Problems (Long Answer)4videos
EQUILIBRIUM
- BOOK - KUMAR PRAKASHANCHAPTER - EQUILIBRIUMEXERCISE - SECTION-D NCERT Exemplar Problems (Short Answer )16videos
EQUILIBRIUM
- BOOK - KUMAR PRAKASHANCHAPTER - ENVIRONMENT CHEMISTRY EXERCISE - Question For Module (Section-C)1videos
ENVIRONMENT CHEMISTRY
- BOOK - KUMAR PRAKASHANCHAPTER - HYDROCARBONSEXERCISE - (Questions for Module (Section - D))1videos
HYDROCARBONS
Similar Questions
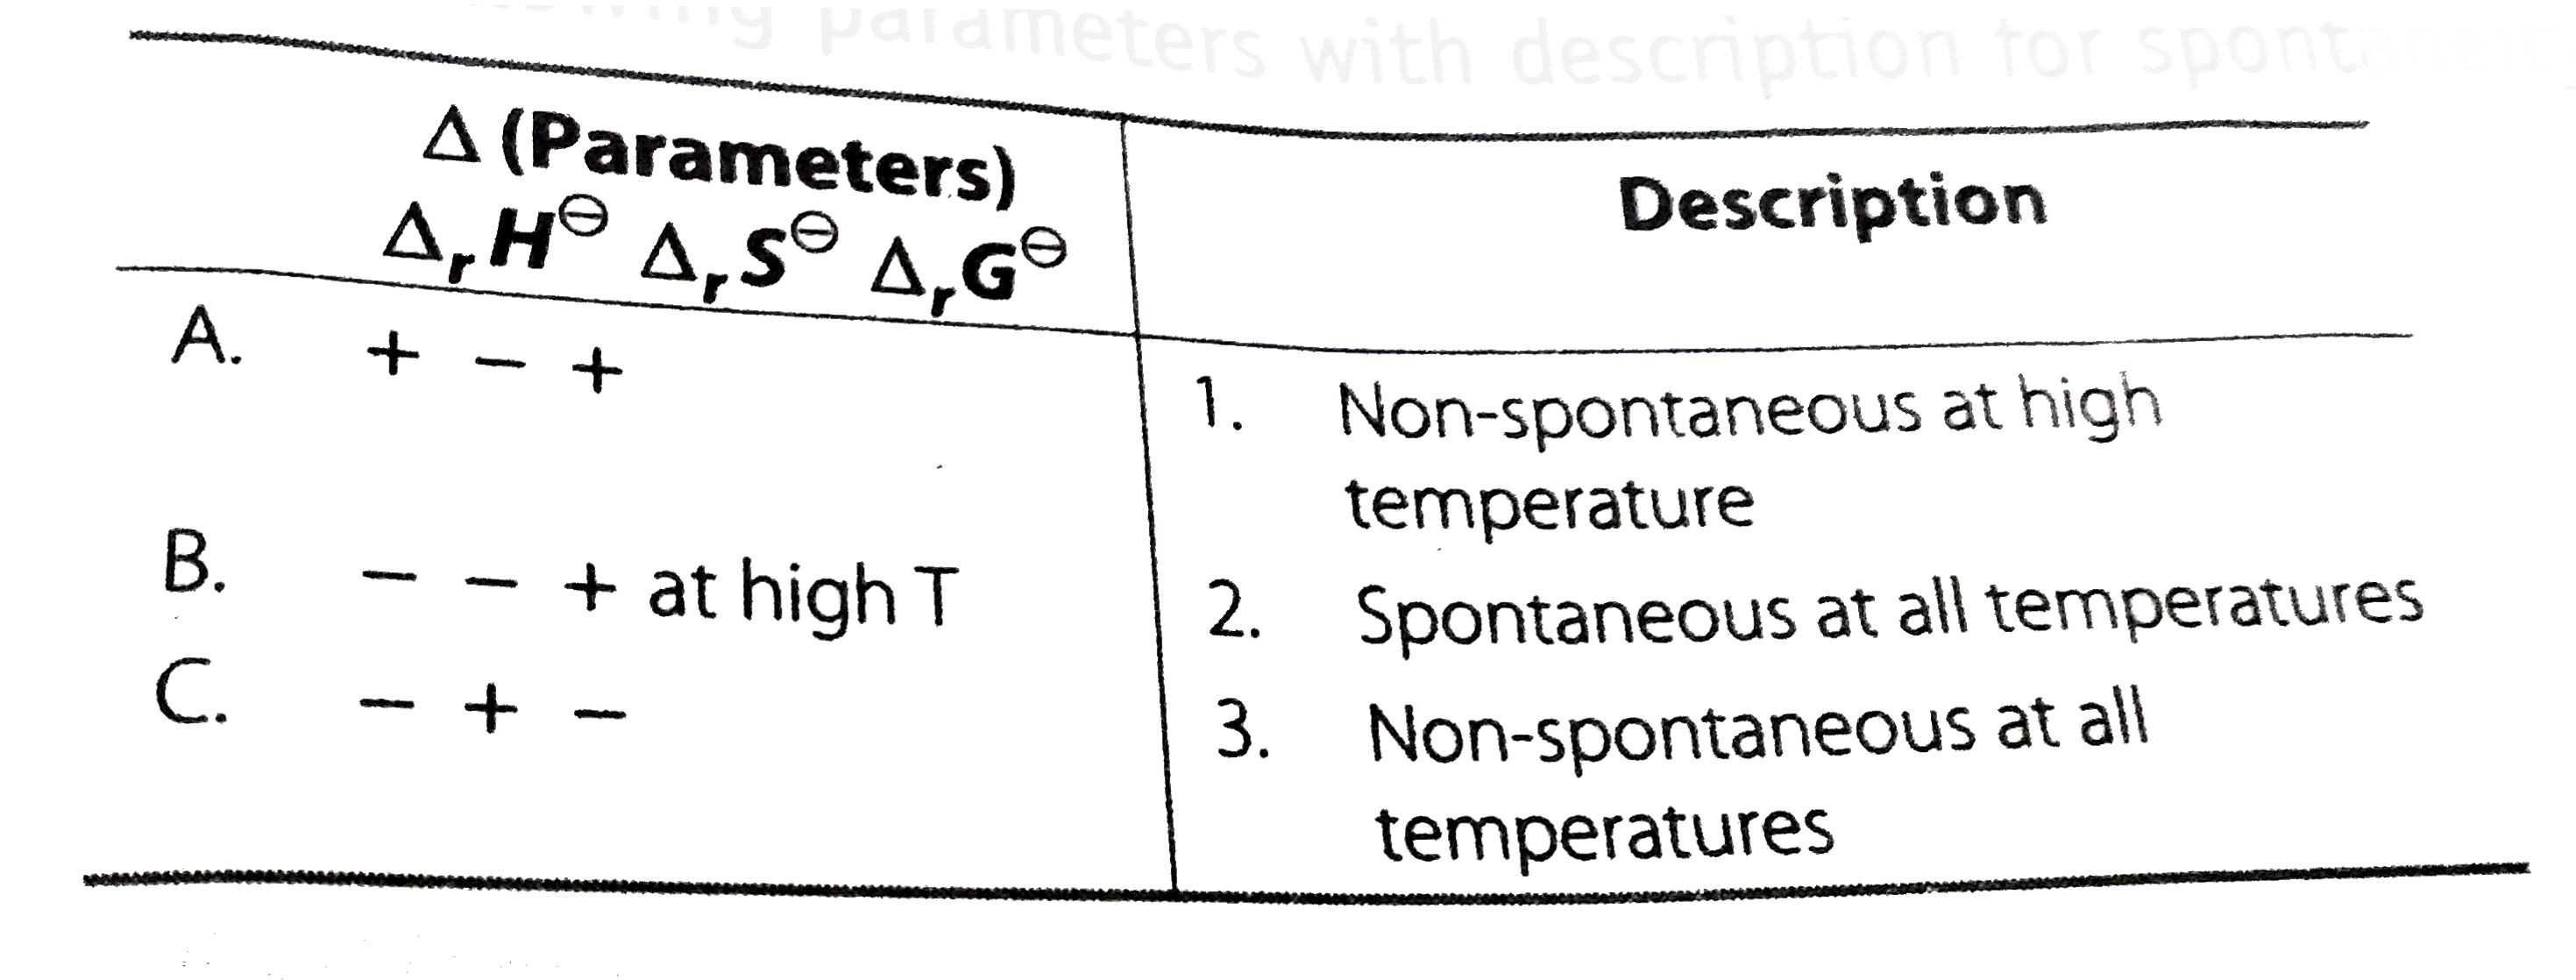
Match the following parameters with description for spontaneity
 View Solution
Match the following parameters with description for spontaneity
 View Solution
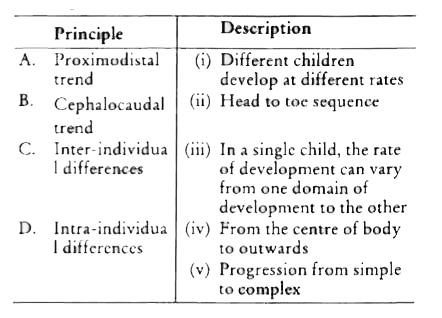
Match the following principles of development with their correct descriptions
 View Solution
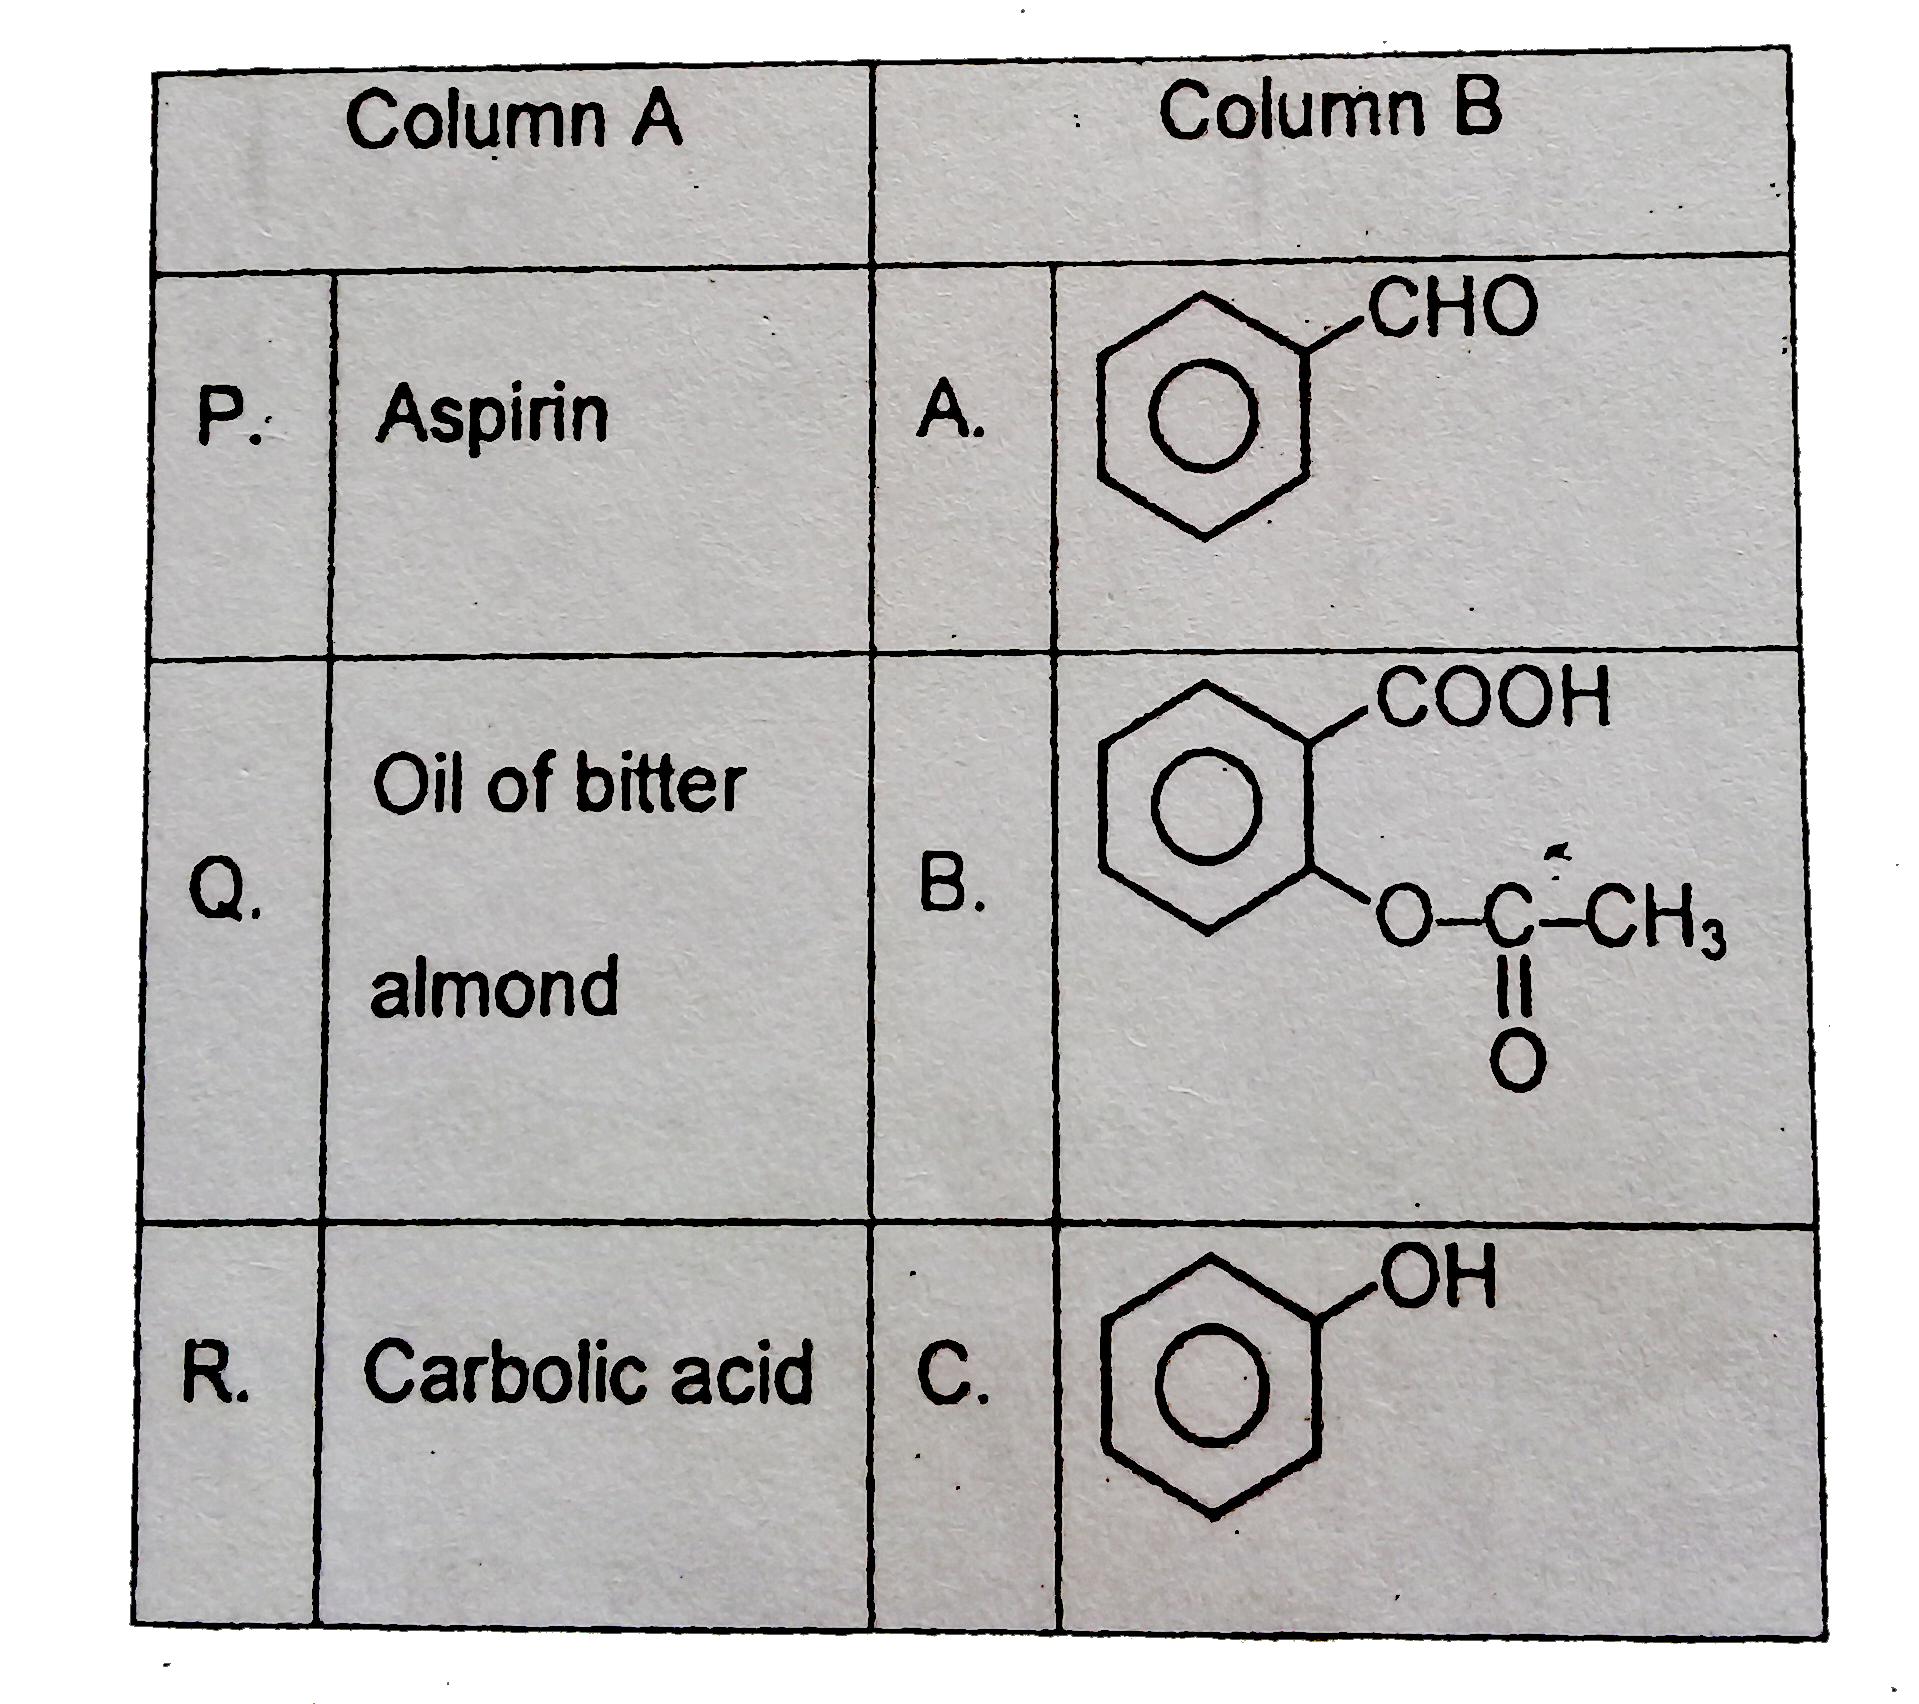
The correct match of the compoun in column a with the description in column B is:View Solution
The correct match of the compoun in column a with the description in column B is:View SolutionMatch the terms in column I with their description in column II and choose the correct option.
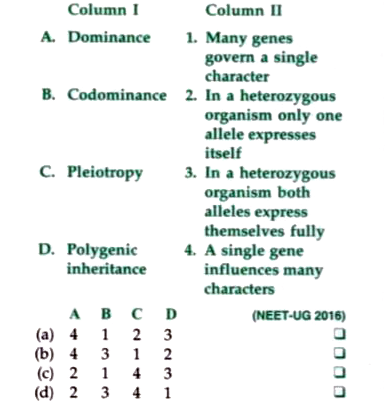 View Solution
Match the terms in column -I with their description in column -II and choose the correct option :
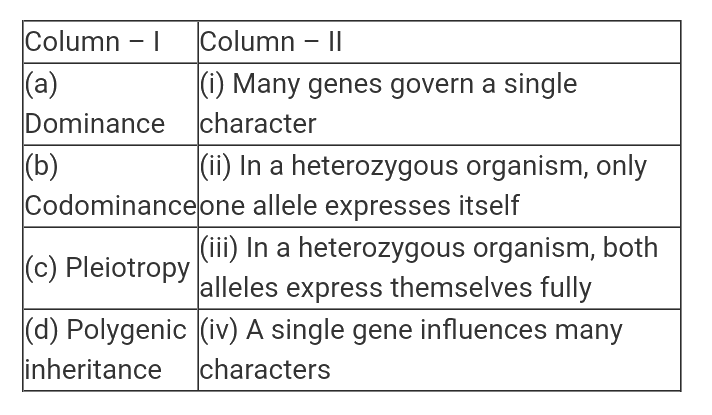 View Solution
Match the terms in column-I with their description in column-II and choose the correct option
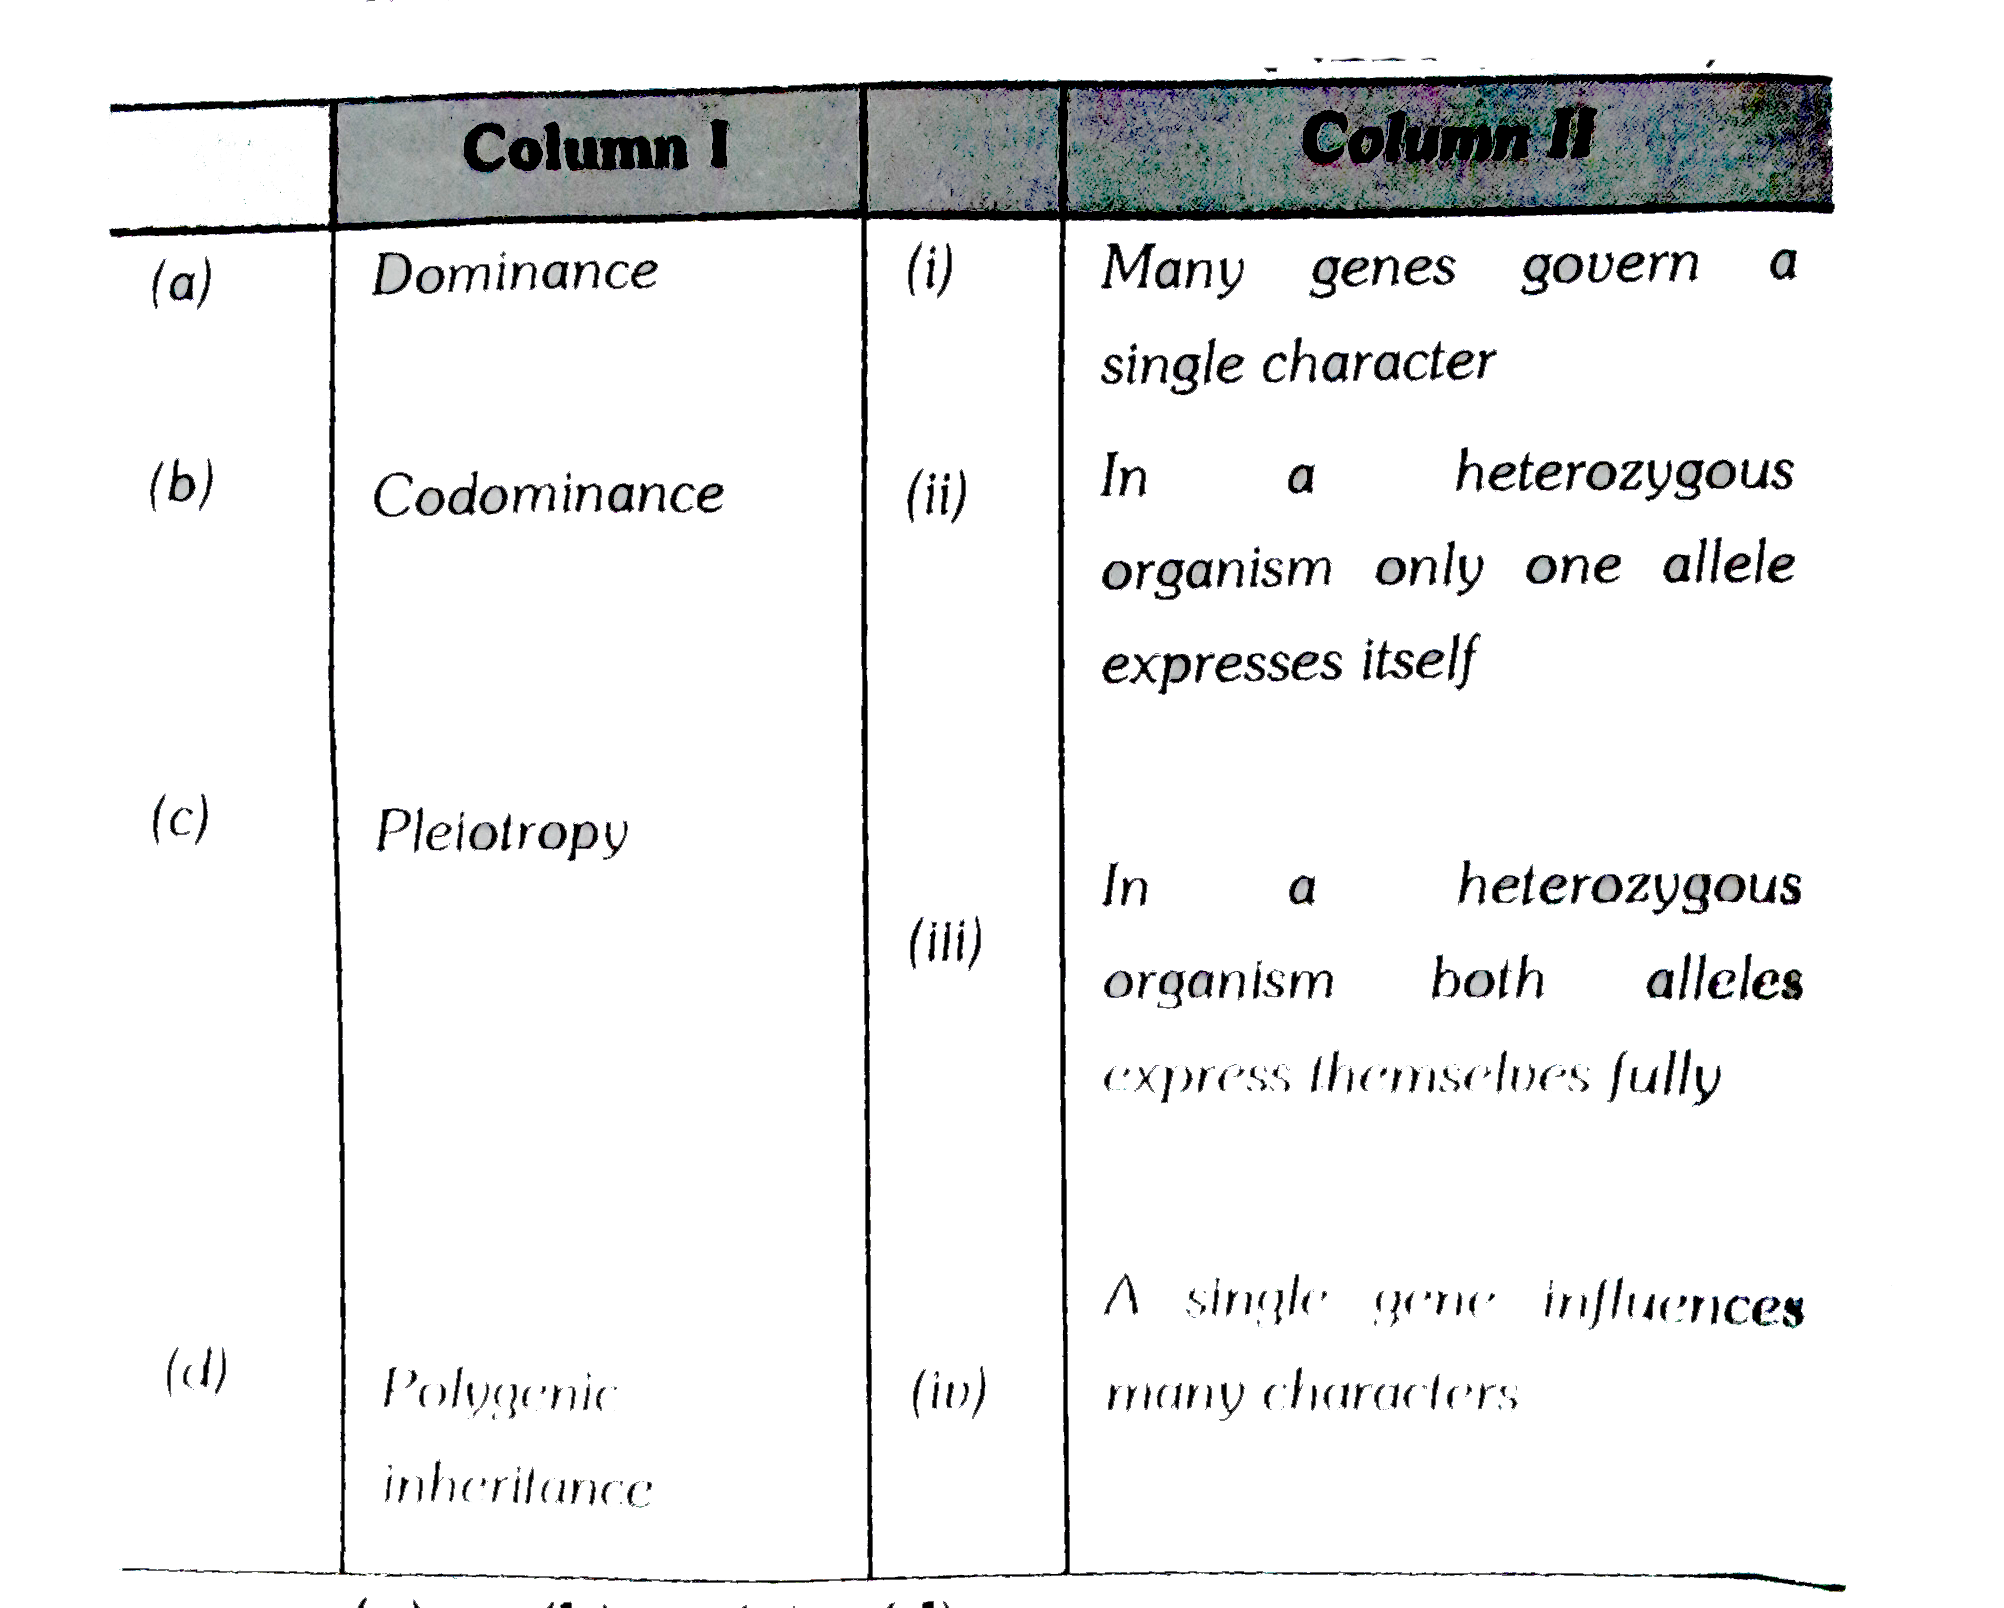 View Solution
Match the terms in Column I with their description in Column II and choose the correct option
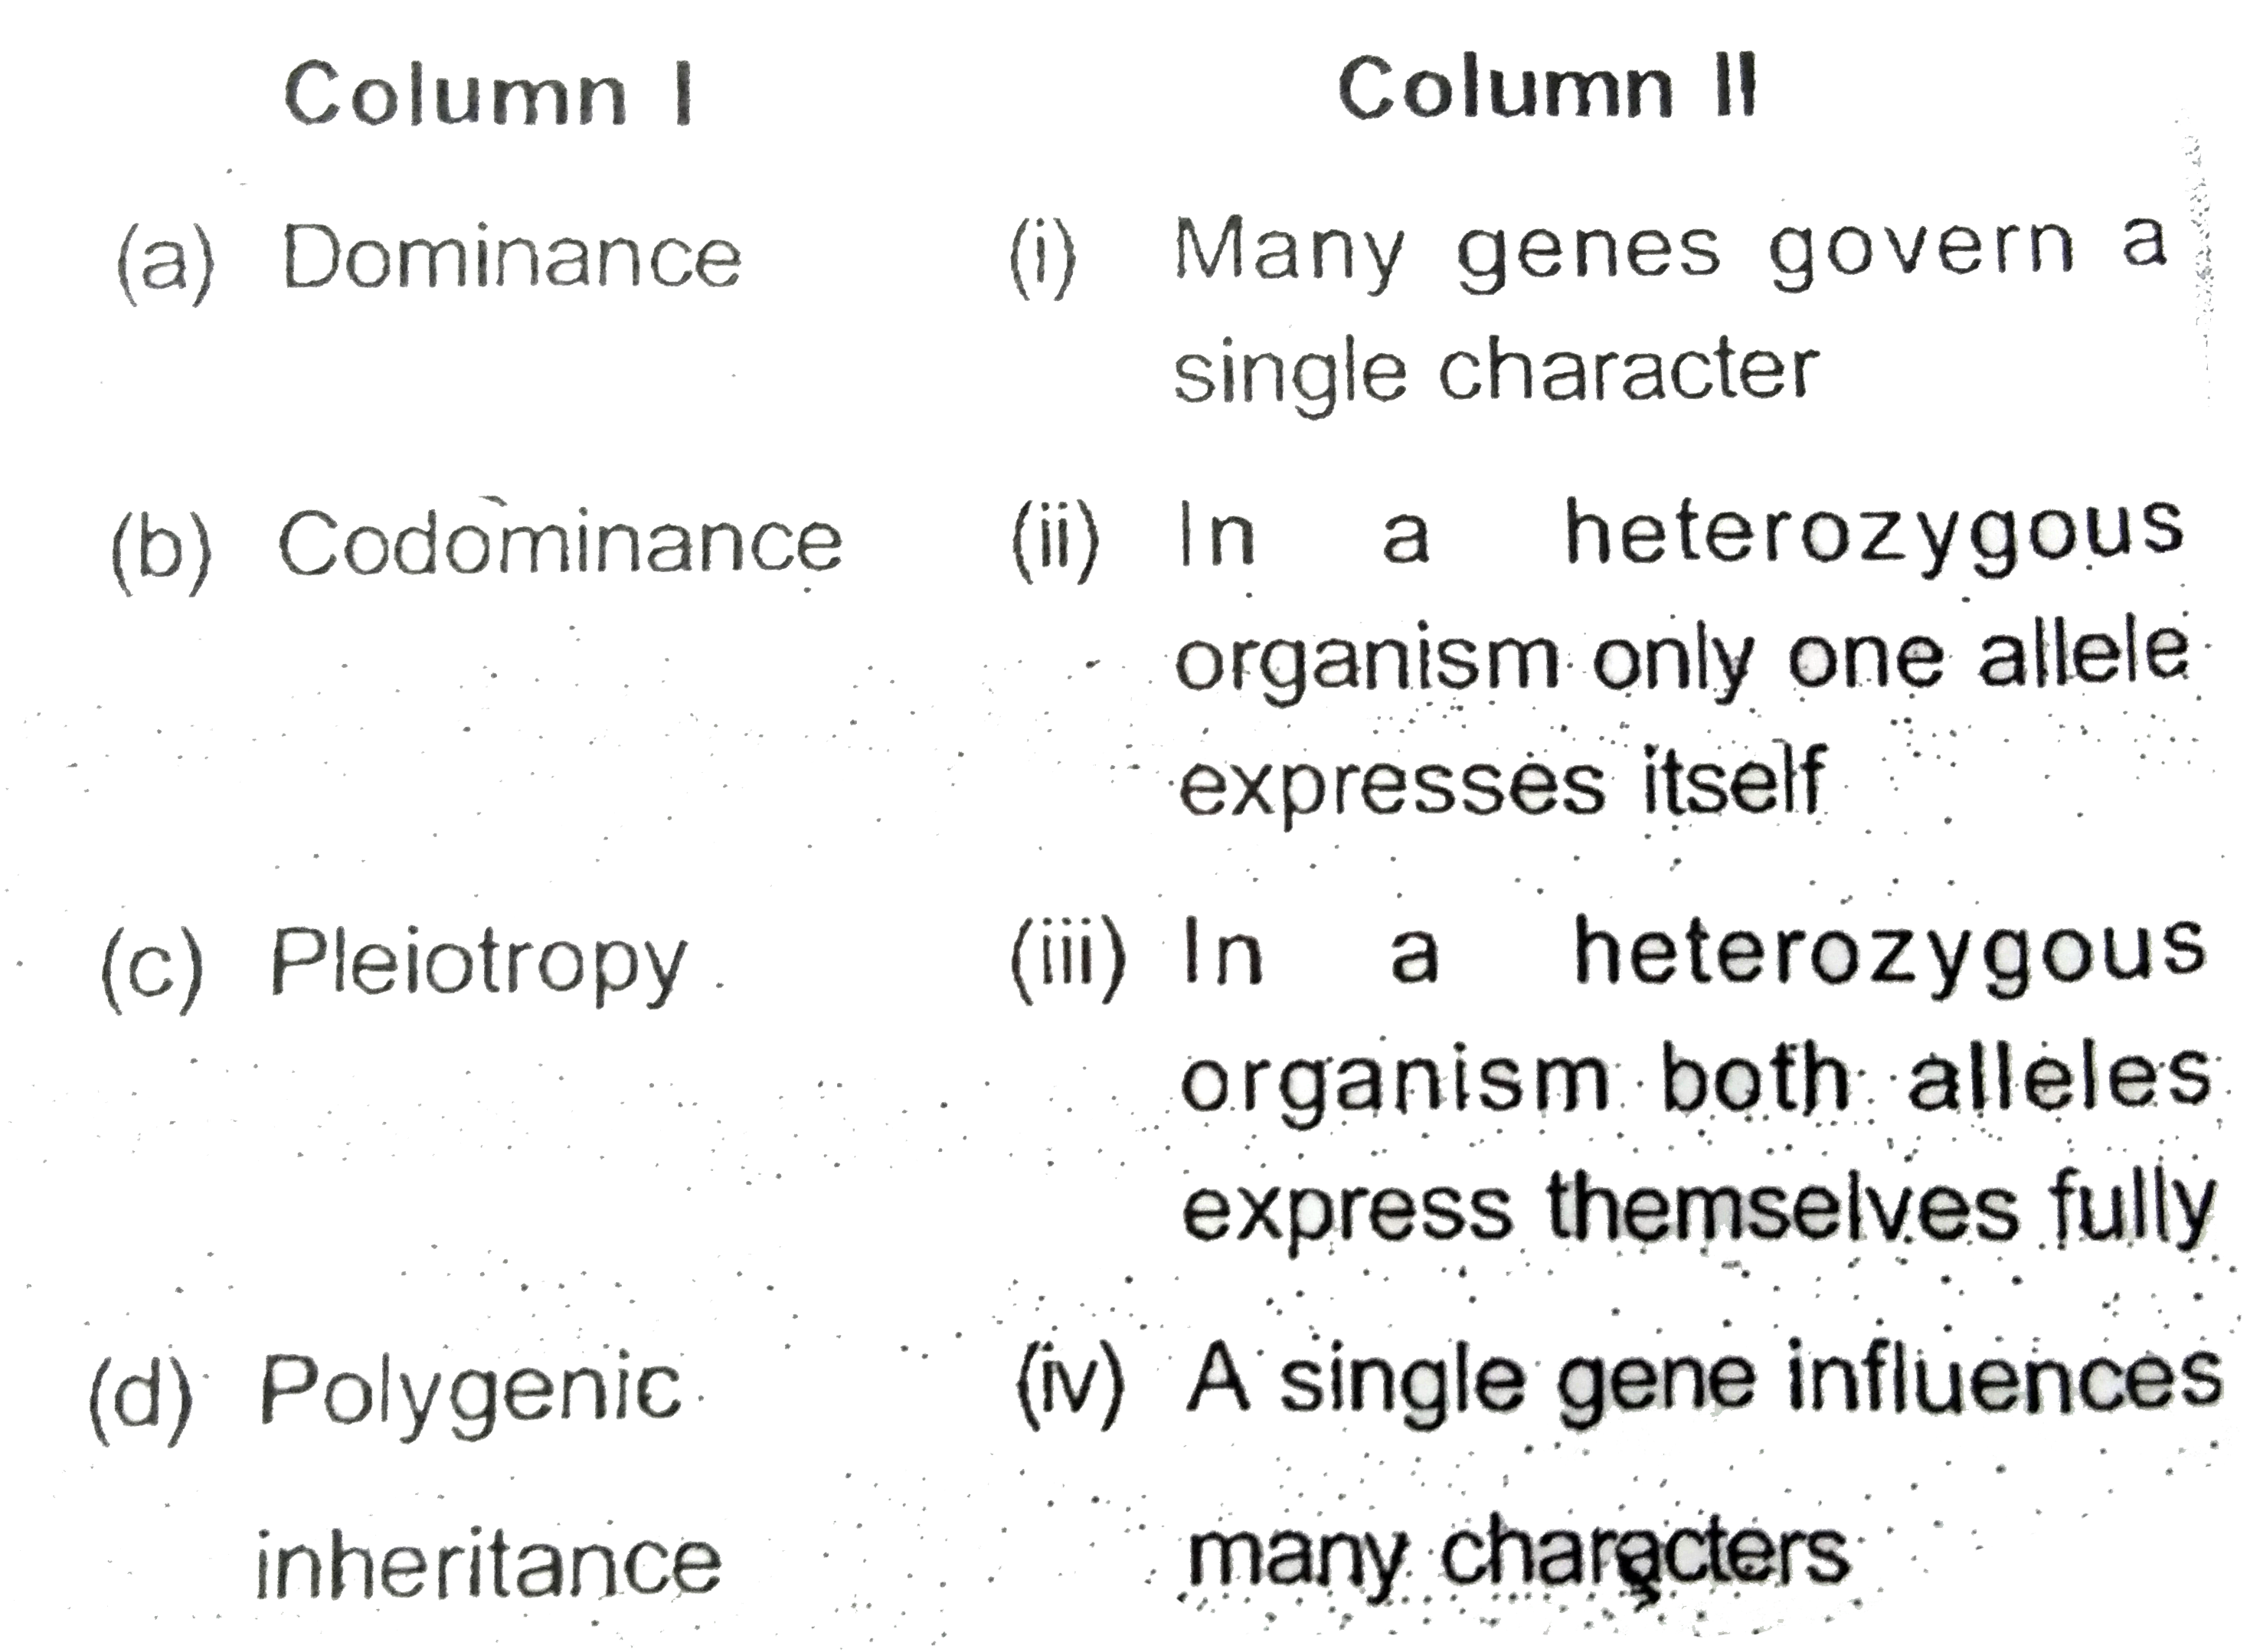 View Solution
Match the terms in Column-I with their description in Column-II, and choose the correct option.
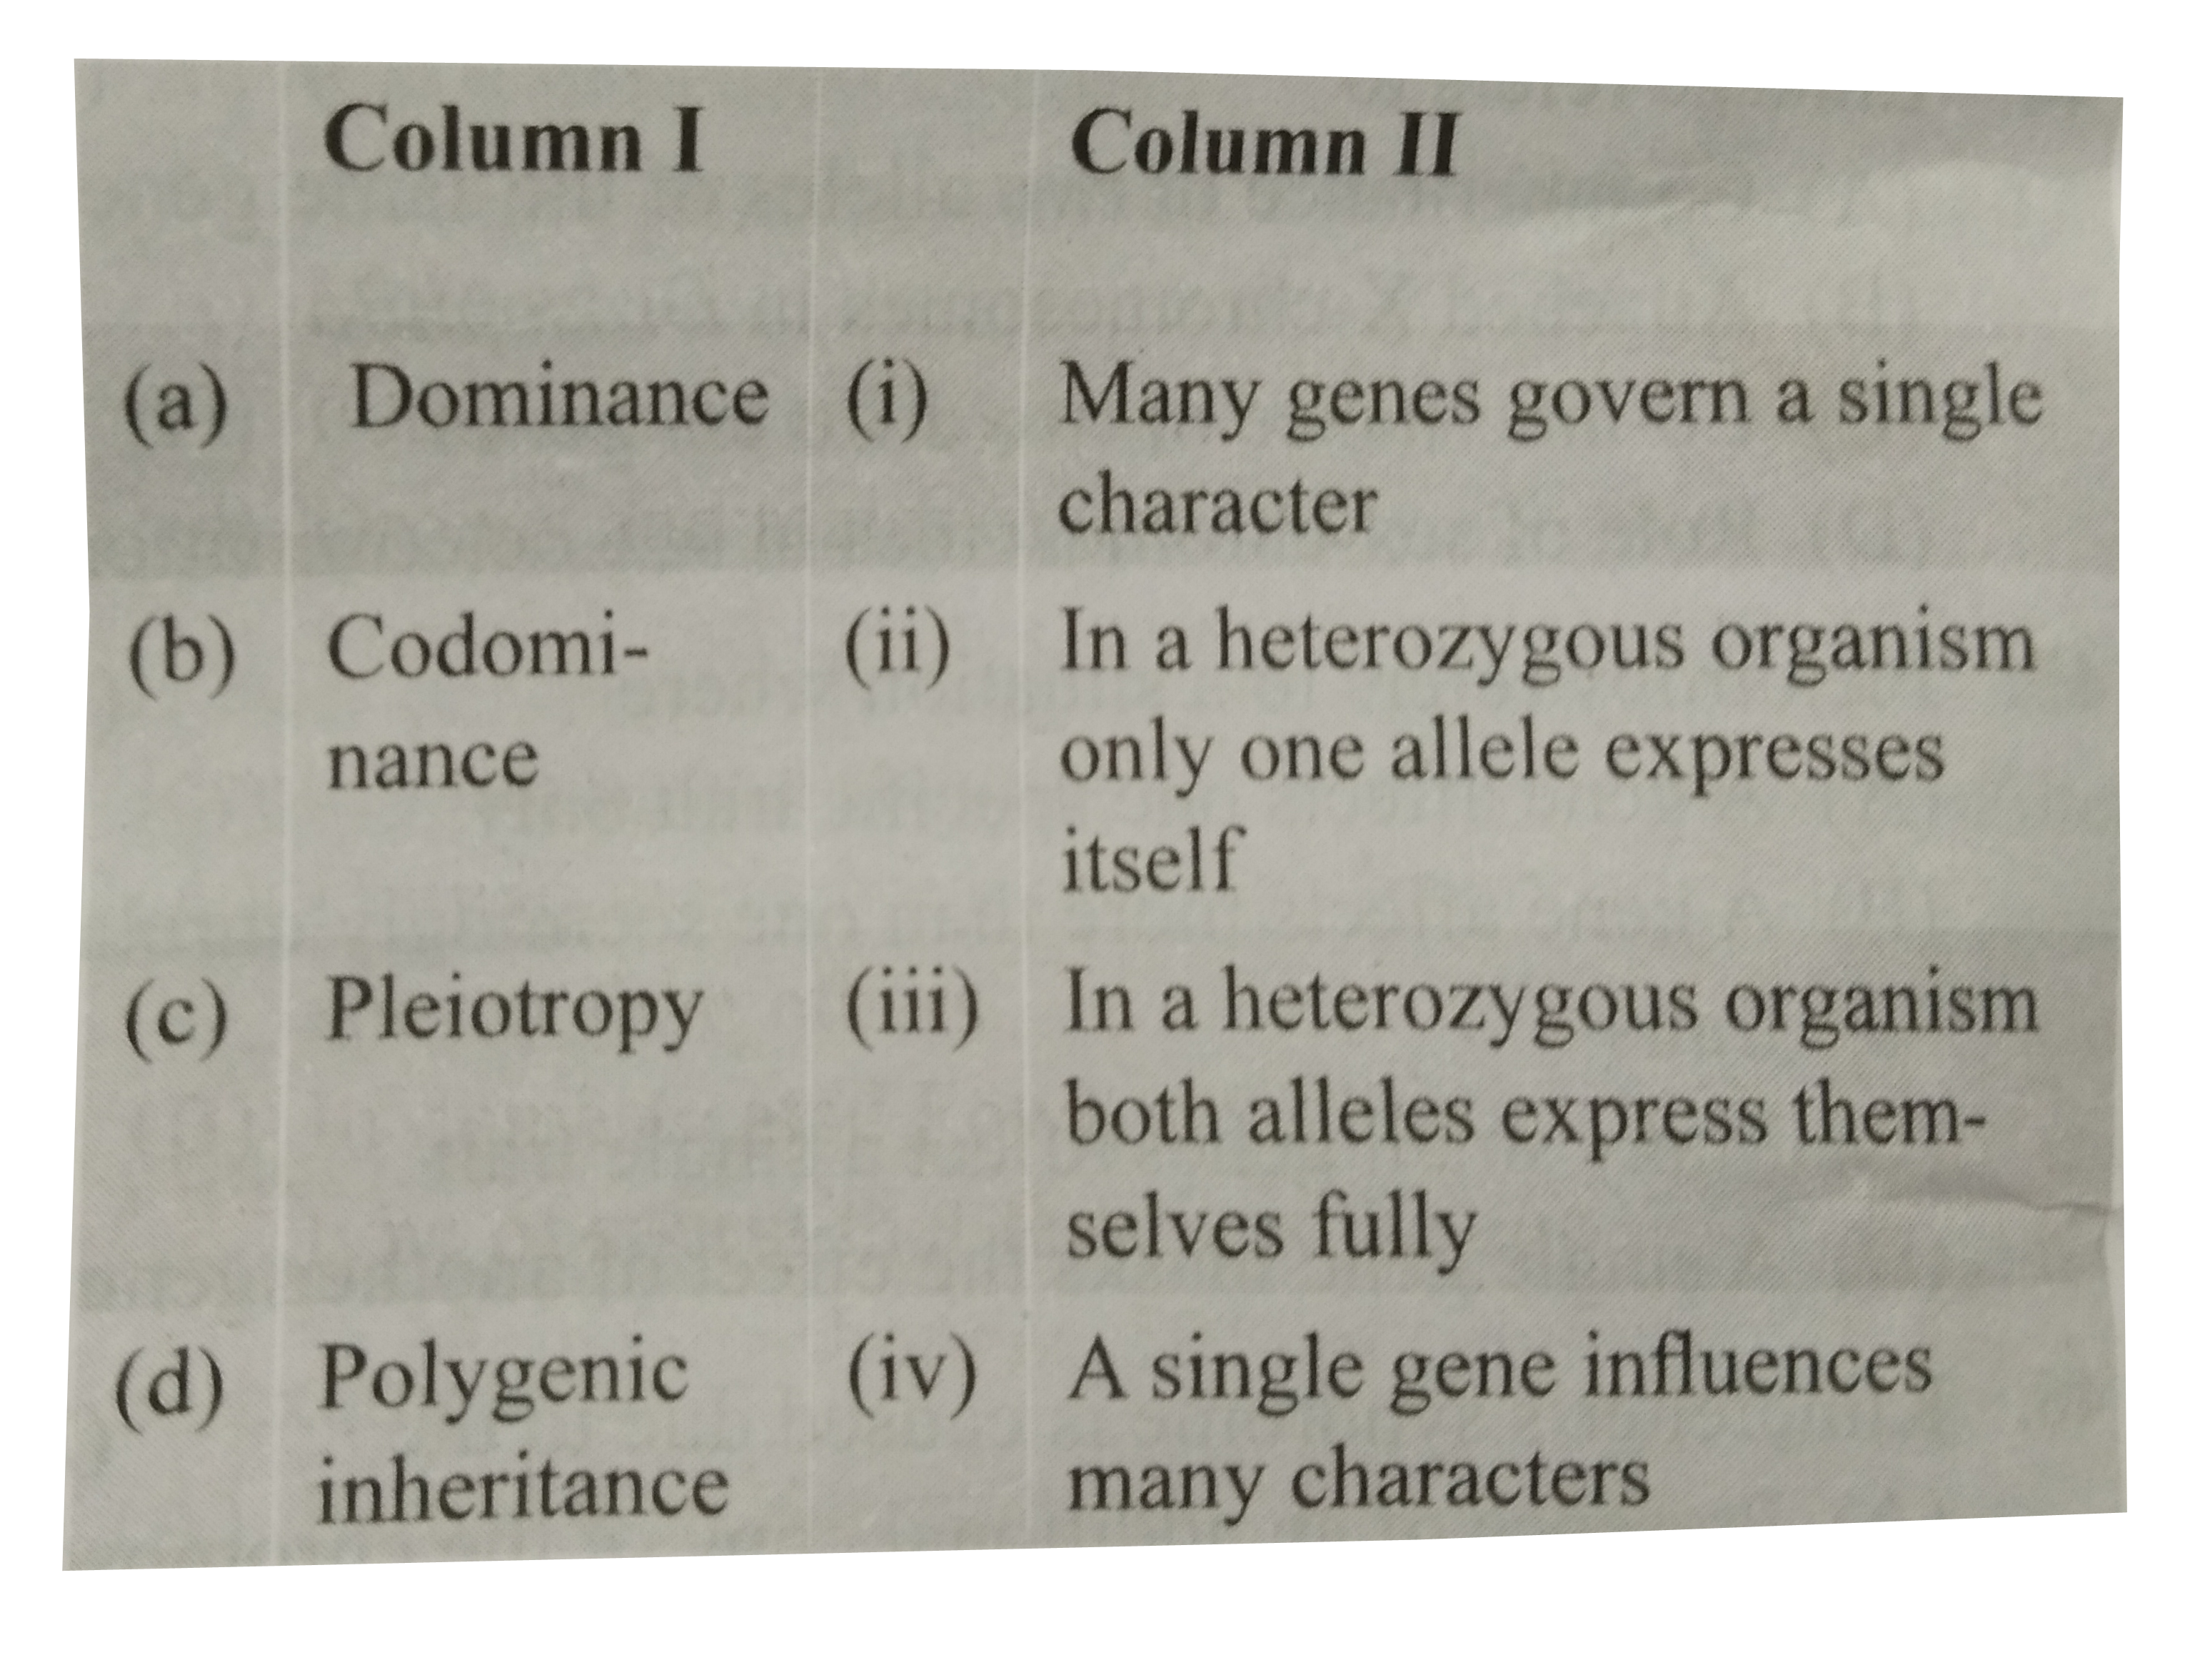 View Solution

