In which of the following indicator diagrams gives below do AB,BC, and CA represent isothermal, isochroic, and adiabatic changes, respectively?
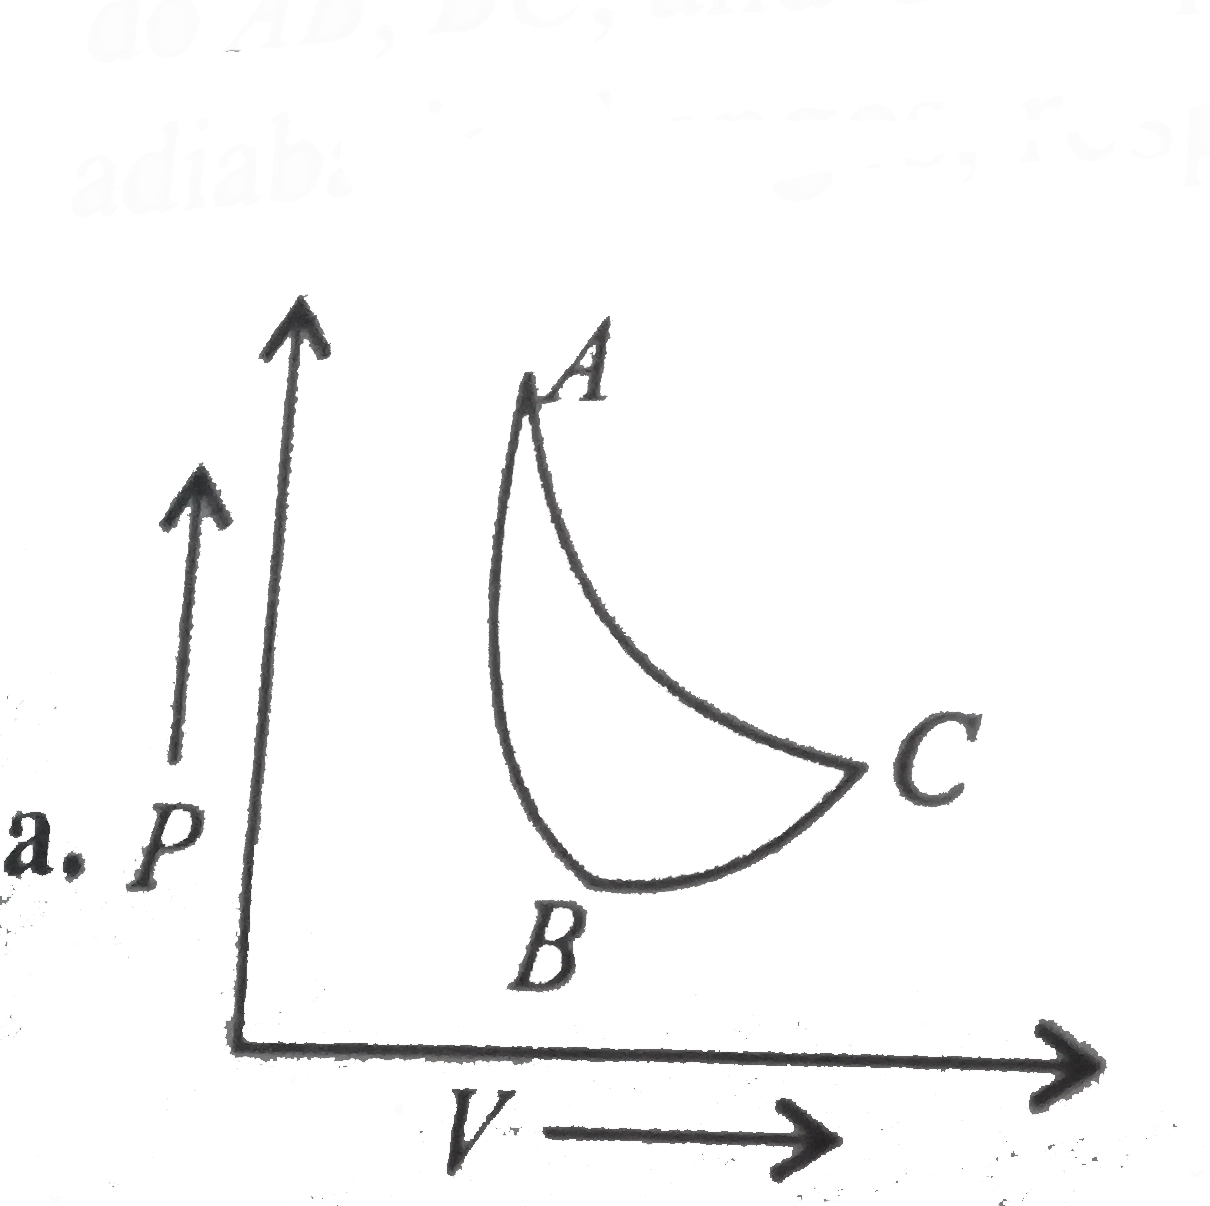

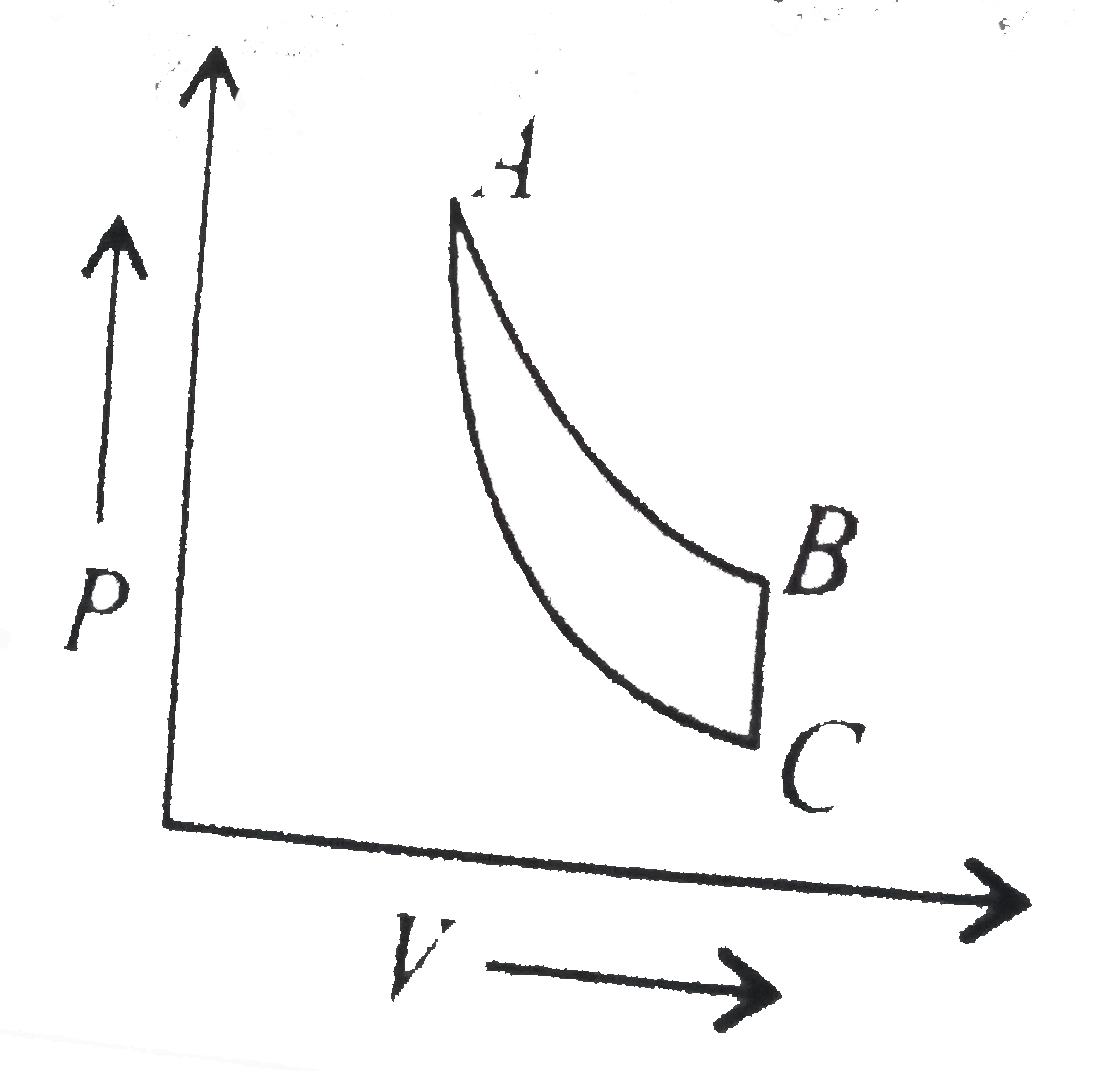
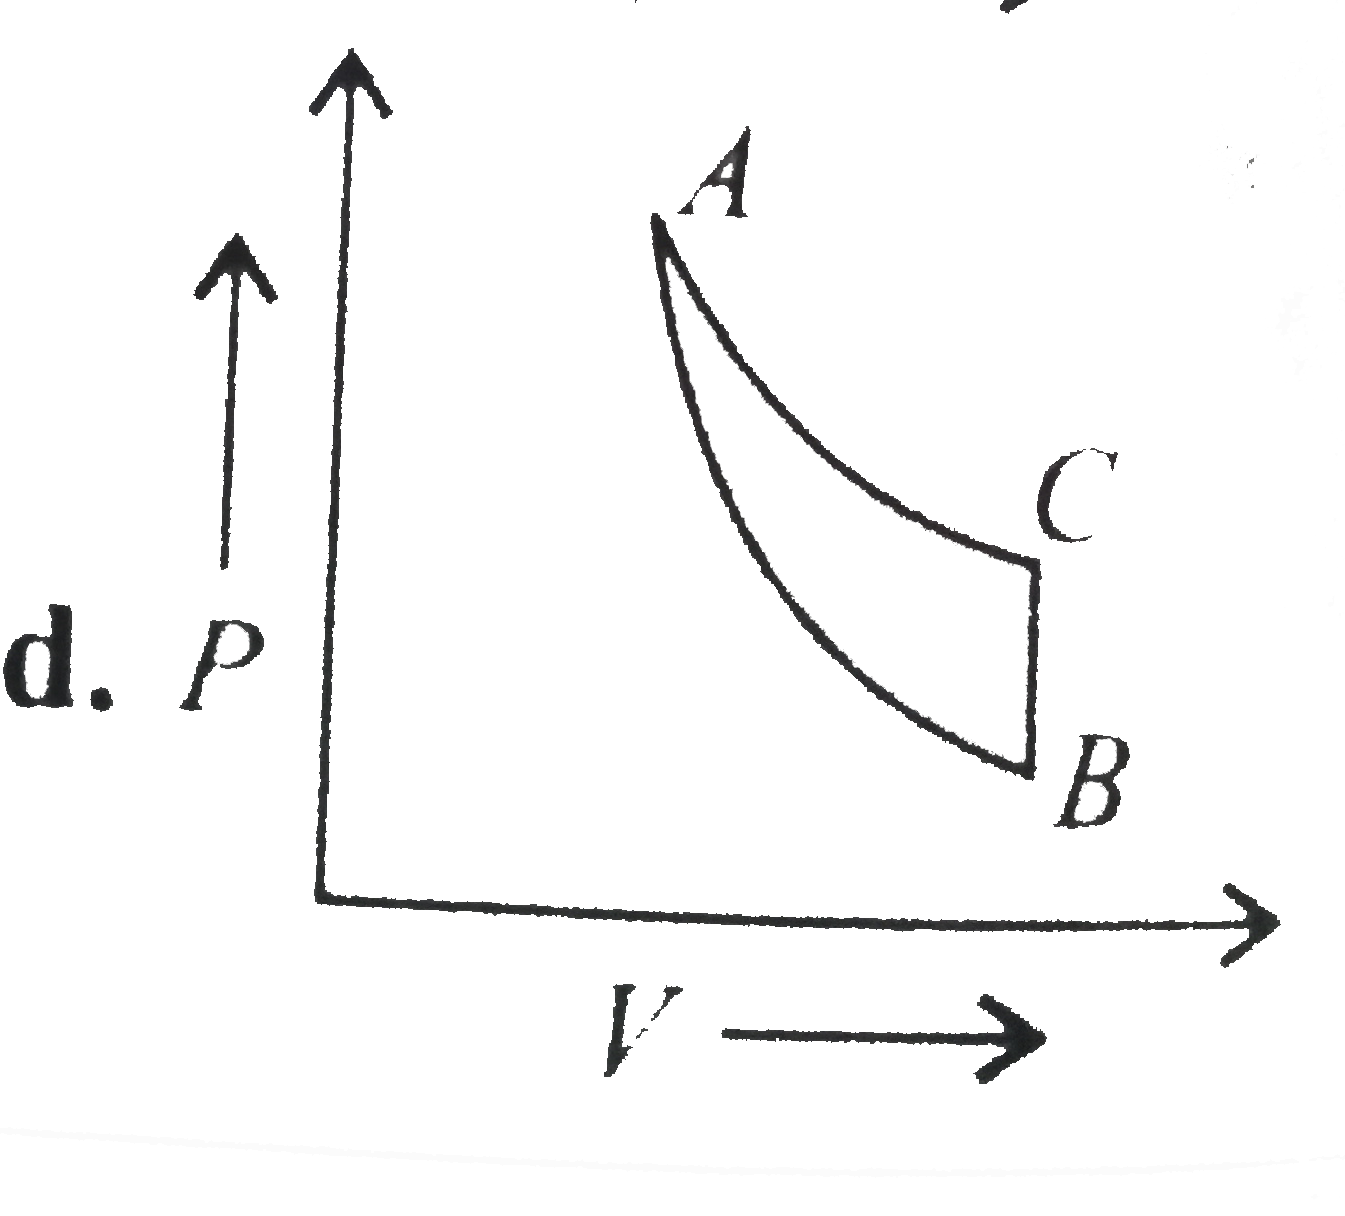
To solve the question regarding the indicator diagram where segments AB, BC, and CA represent isothermal, isochoric, and adiabatic changes respectively, we can follow these steps:
1. Understanding the Processes:
- Isothermal Process (AB): In an isothermal process, the temperature remains constant. For an ideal gas, this means that the product of pressure (P) and volume (V) is constant, which results in a hyperbolic curve on a PV diagram.
- Isochoric Process (BC): In an isochoric process, the volume remains constant. On a PV diagram, this is represented as a vertical line since pressure changes while volume stays the same.
- Adiabatic Process (CA): In an adiabatic process, there is no heat exchange with the surroundings. The relationship between pressure and volume is different from that of an isothermal process, and it typically results in a steeper curve than the isothermal curve.
2. Sketching the Diagram:
- Draw a PV diagram with pressure (P) on the y-axis and volume (V) on the x-axis.
- For the isothermal process (AB), draw a hyperbolic curve that represents constant temperature.
- For the isochoric process (BC), draw a vertical line from point B to point C, indicating that volume is constant.
- For the adiabatic process (CA), draw a curve that is steeper than the isothermal curve, indicating that as volume decreases, pressure increases significantly without heat exchange.
3. Analyzing the Relationships:
- The isothermal curve (AB) should be at a lower temperature compared to the adiabatic curve (CA) because in an adiabatic process, the temperature increases as the volume decreases.
- The vertical line (BC) indicates that pressure changes while volume remains constant, which is characteristic of an isochoric process.
4. Finalizing the Diagram:
- Ensure that the curves and lines are correctly labeled as AB for isothermal, BC for isochoric, and CA for adiabatic.
- The final diagram should clearly show the relationships between the three processes.
5. Identifying the Correct Option:
- Based on the drawn diagram and the characteristics of each process, identify the option that matches the description of AB, BC, and CA as isothermal, isochoric, and adiabatic, respectively.
Conclusion:
The correct answer for the indicator diagram where AB represents isothermal, BC represents isochoric, and CA represents adiabatic changes is option D.
- Isothermal Process (AB): In an isothermal process, the temperature remains constant. For an ideal gas, this means that the product of pressure (P) and volume (V) is constant, which results in a hyperbolic curve on a PV diagram.
- Isochoric Process (BC): In an isochoric process, the volume remains constant. On a PV diagram, this is represented as a vertical line since pressure changes while volume stays the same.
- Adiabatic Process (CA): In an adiabatic process, there is no heat exchange with the surroundings. The relationship between pressure and volume is different from that of an isothermal process, and it typically results in a steeper curve than the isothermal curve.
- Draw a PV diagram with pressure (P) on the y-axis and volume (V) on the x-axis.
- For the isothermal process (AB), draw a hyperbolic curve that represents constant temperature.
- For the isochoric process (BC), draw a vertical line from point B to point C, indicating that volume is constant.
- For the adiabatic process (CA), draw a curve that is steeper than the isothermal curve, indicating that as volume decreases, pressure increases significantly without heat exchange.
- The isothermal curve (AB) should be at a lower temperature compared to the adiabatic curve (CA) because in an adiabatic process, the temperature increases as the volume decreases.
- The vertical line (BC) indicates that pressure changes while volume remains constant, which is characteristic of an isochoric process.
- Ensure that the curves and lines are correctly labeled as AB for isothermal, BC for isochoric, and CA for adiabatic.
- The final diagram should clearly show the relationships between the three processes.
- Based on the drawn diagram and the characteristics of each process, identify the option that matches the description of AB, BC, and CA as isothermal, isochoric, and adiabatic, respectively.
The correct answer for the indicator diagram where AB represents isothermal, BC represents isochoric, and CA represents adiabatic changes is option D.
Topper's Solved these Questions
- BOOK - CENGAGE CHEMISTRY ENGLISHCHAPTER - THERMODYNAMICSEXERCISE - Ex 6.327videos
THERMODYNAMICS
- BOOK - CENGAGE CHEMISTRY ENGLISHCHAPTER - THERMODYNAMICSEXERCISE - Ex 6.416videos
THERMODYNAMICS
- BOOK - CENGAGE CHEMISTRY ENGLISHCHAPTER - THERMODYNAMICSEXERCISE - Ex 6.126videos
THERMODYNAMICS
- BOOK - CENGAGE CHEMISTRY ENGLISHCHAPTER - STOICHIOMETRYEXERCISE - Archives Subjective33videos
STOICHIOMETRY
Similar Questions
Which of the following indicates the isotherms?
 View Solution
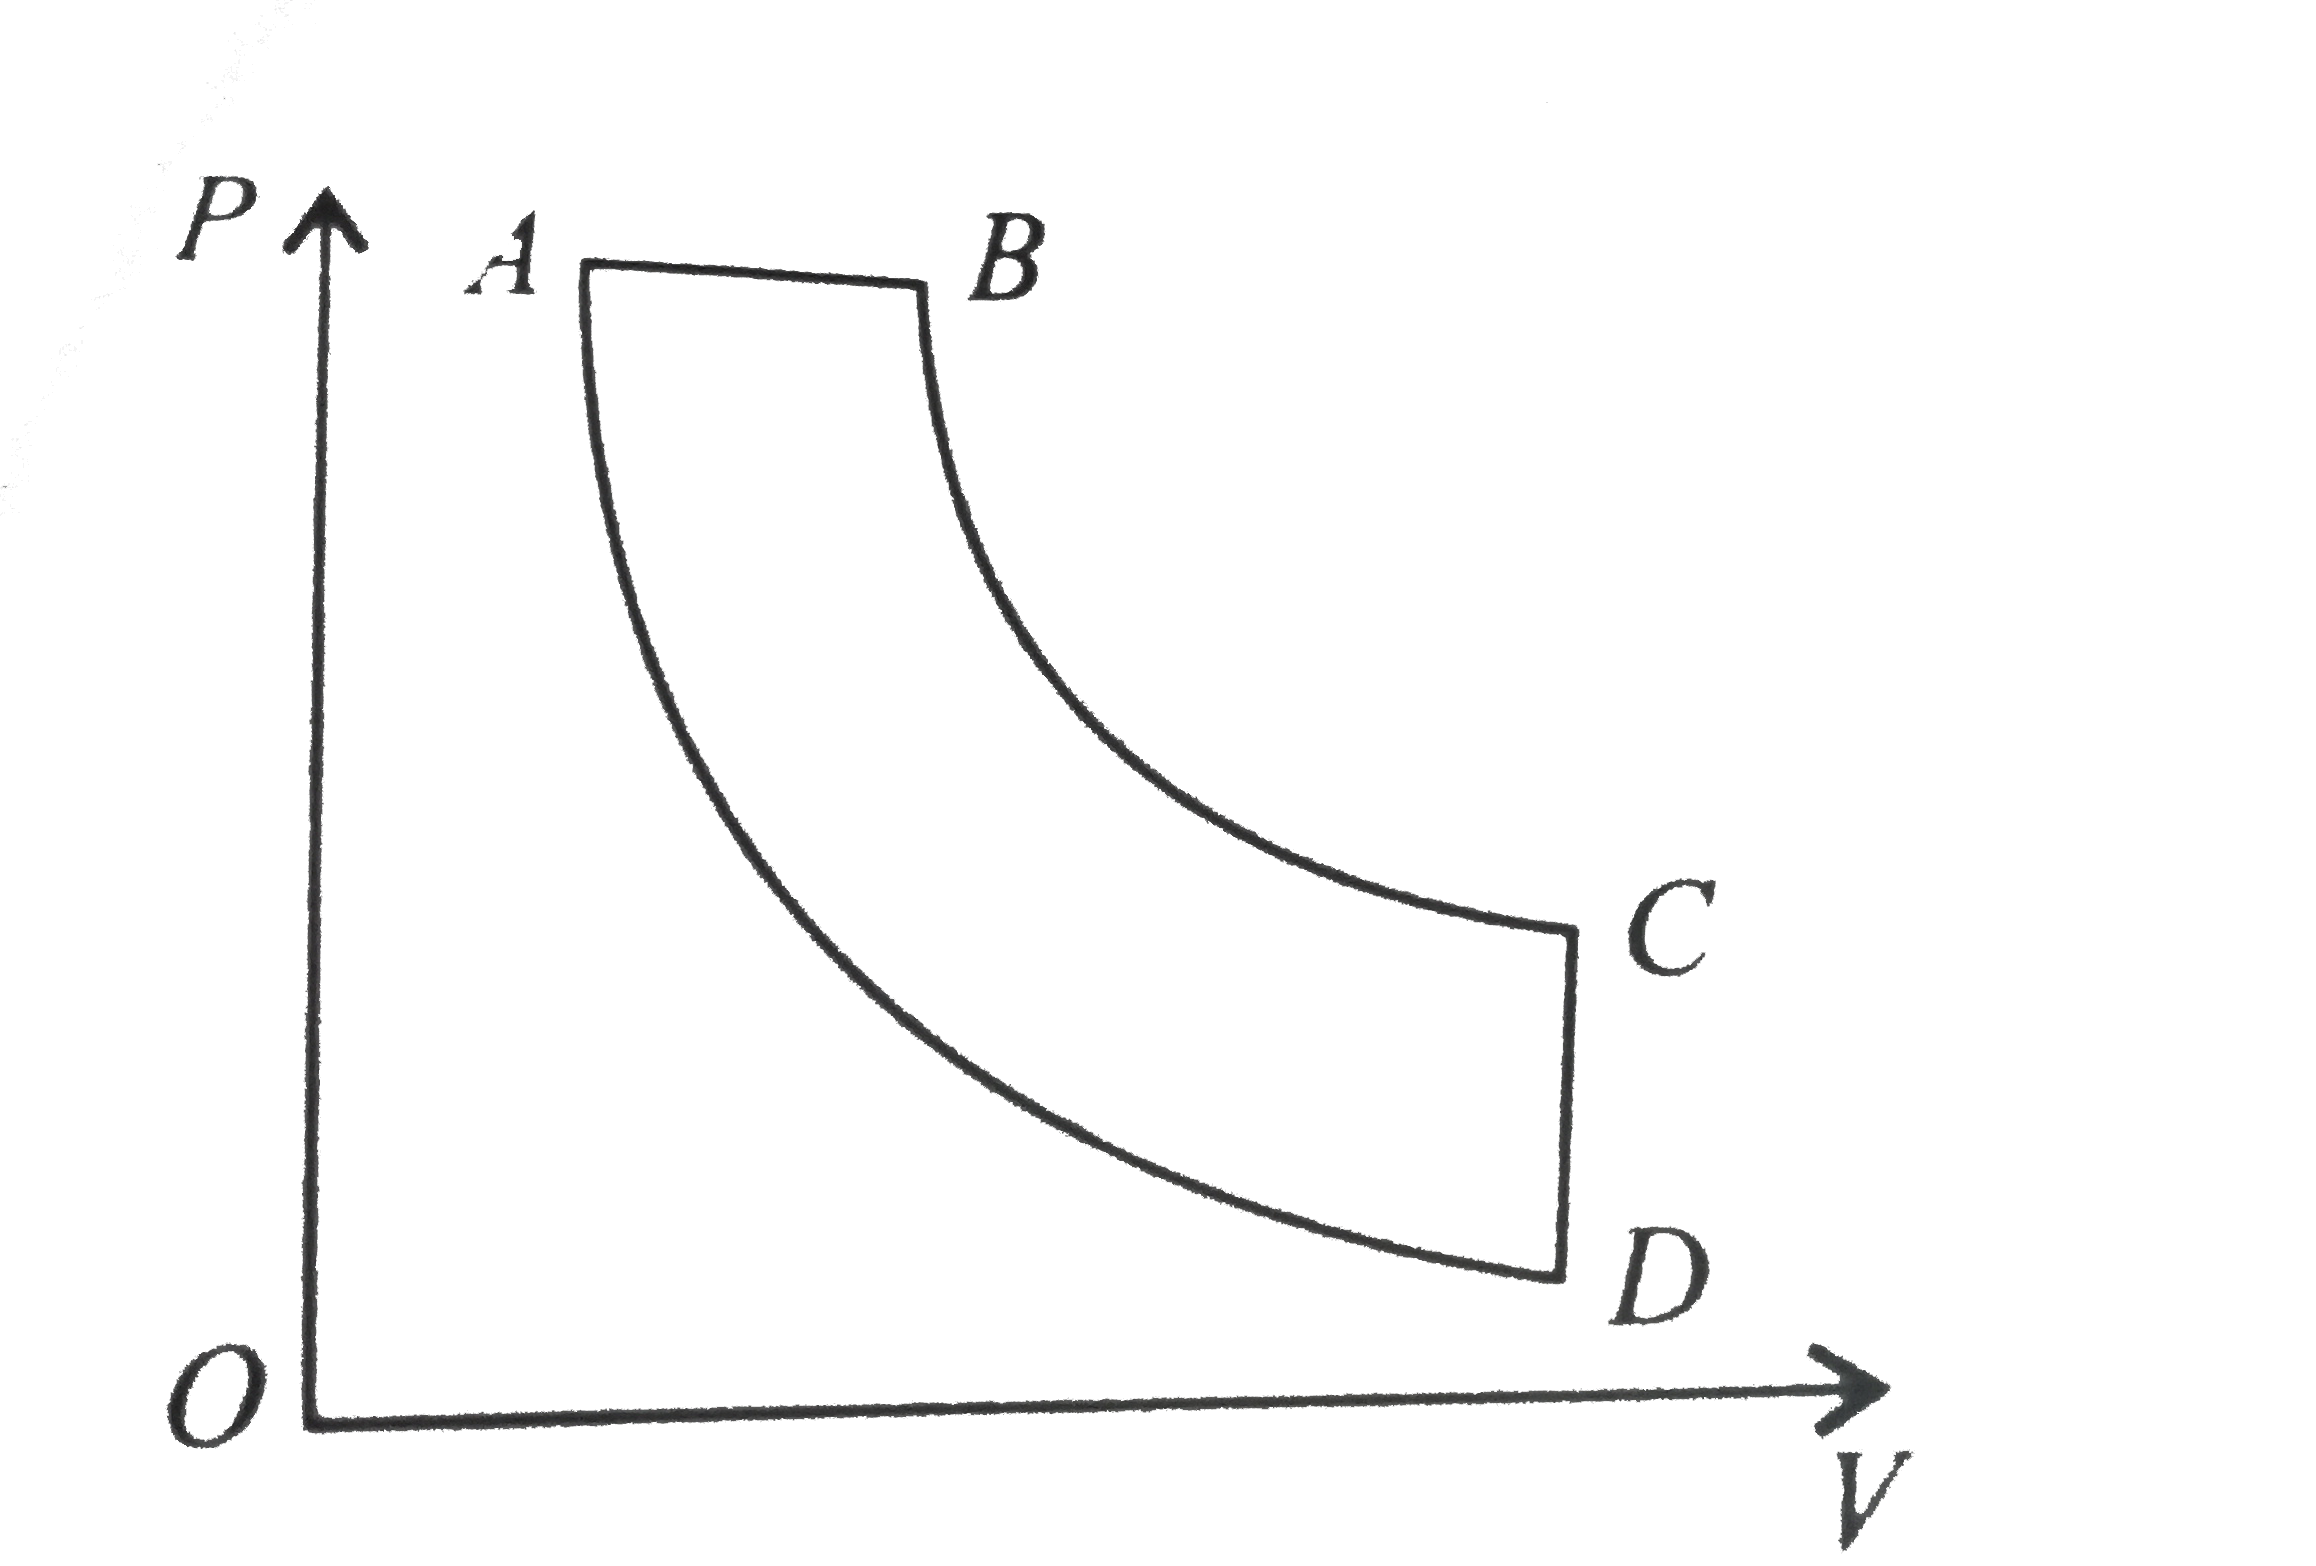
In the pressure-volume diagram given below, the isochoric, isothermal, isobaric, and isoentropic parts, respectively, are:
 View Solution
Give two examples each of (a) an isothermal change and (b) an adiabatic change.
View SolutionIn the diagram give n below shaded part represents :-
 View Solution
In the following pressure-volume diagram, the isochoric, isothermal and isobaric parts, respectively, are
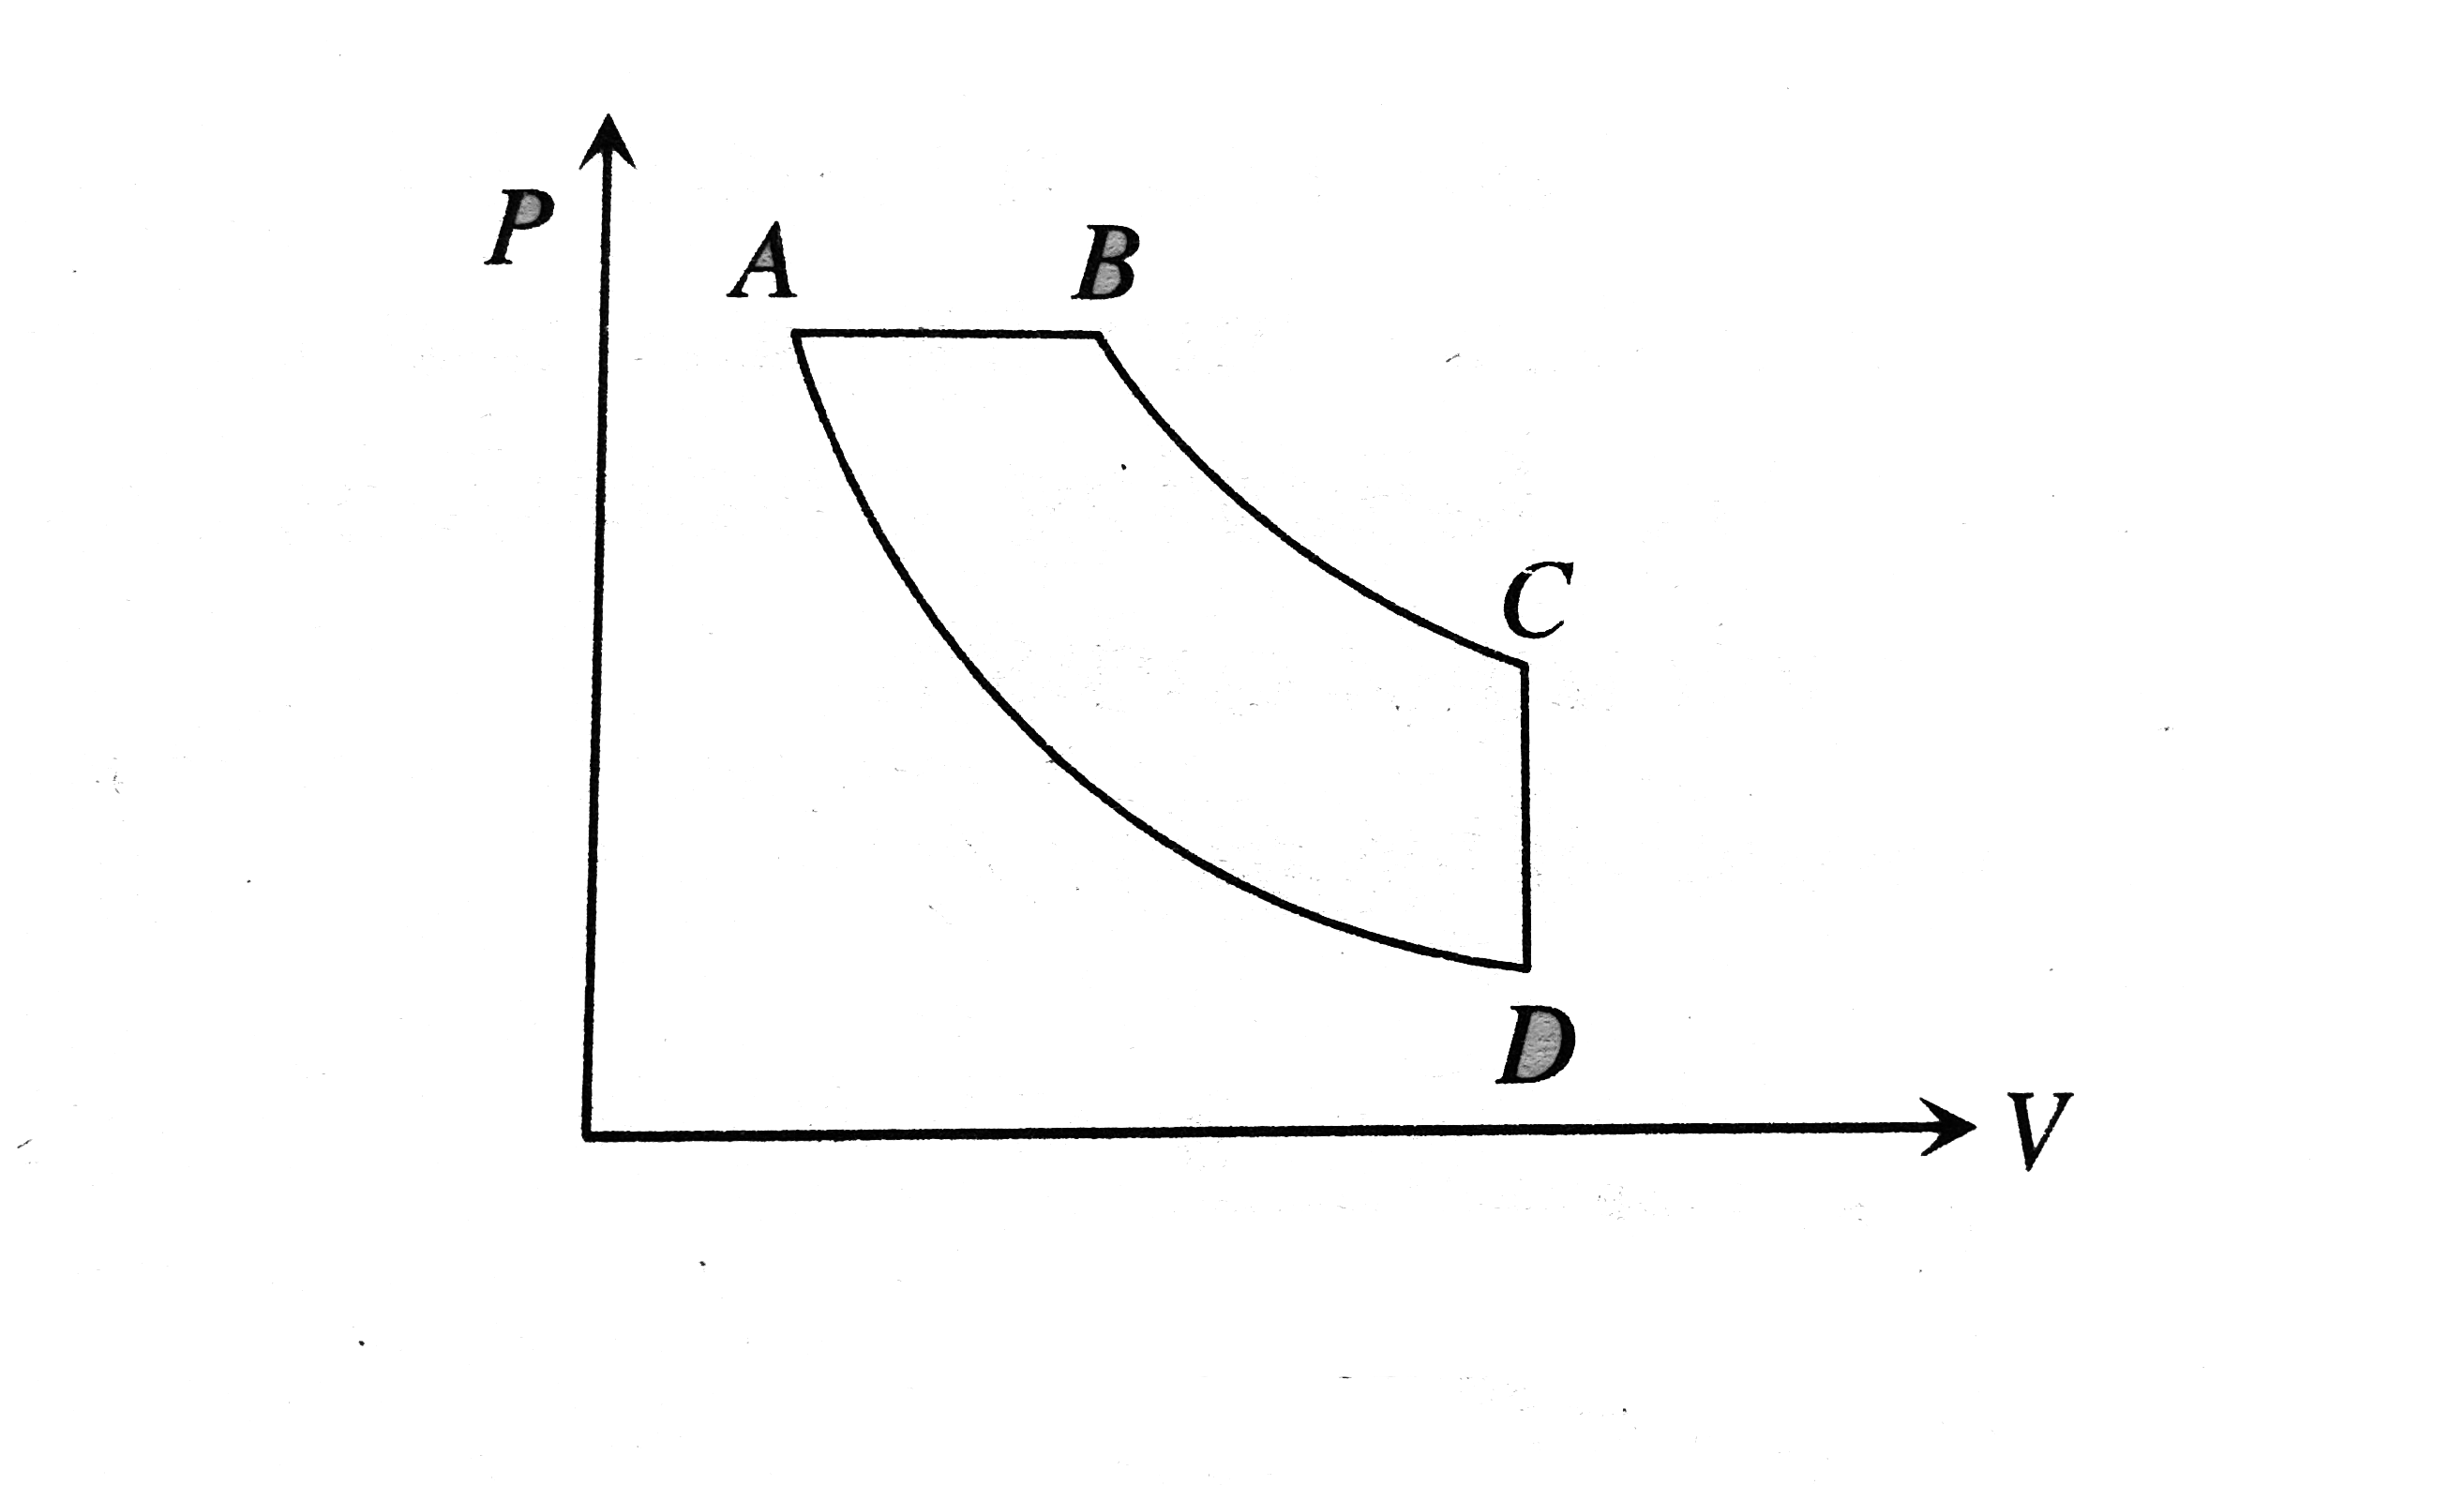 View Solution
Which stages of cell division do the following figures A and B represent respectively
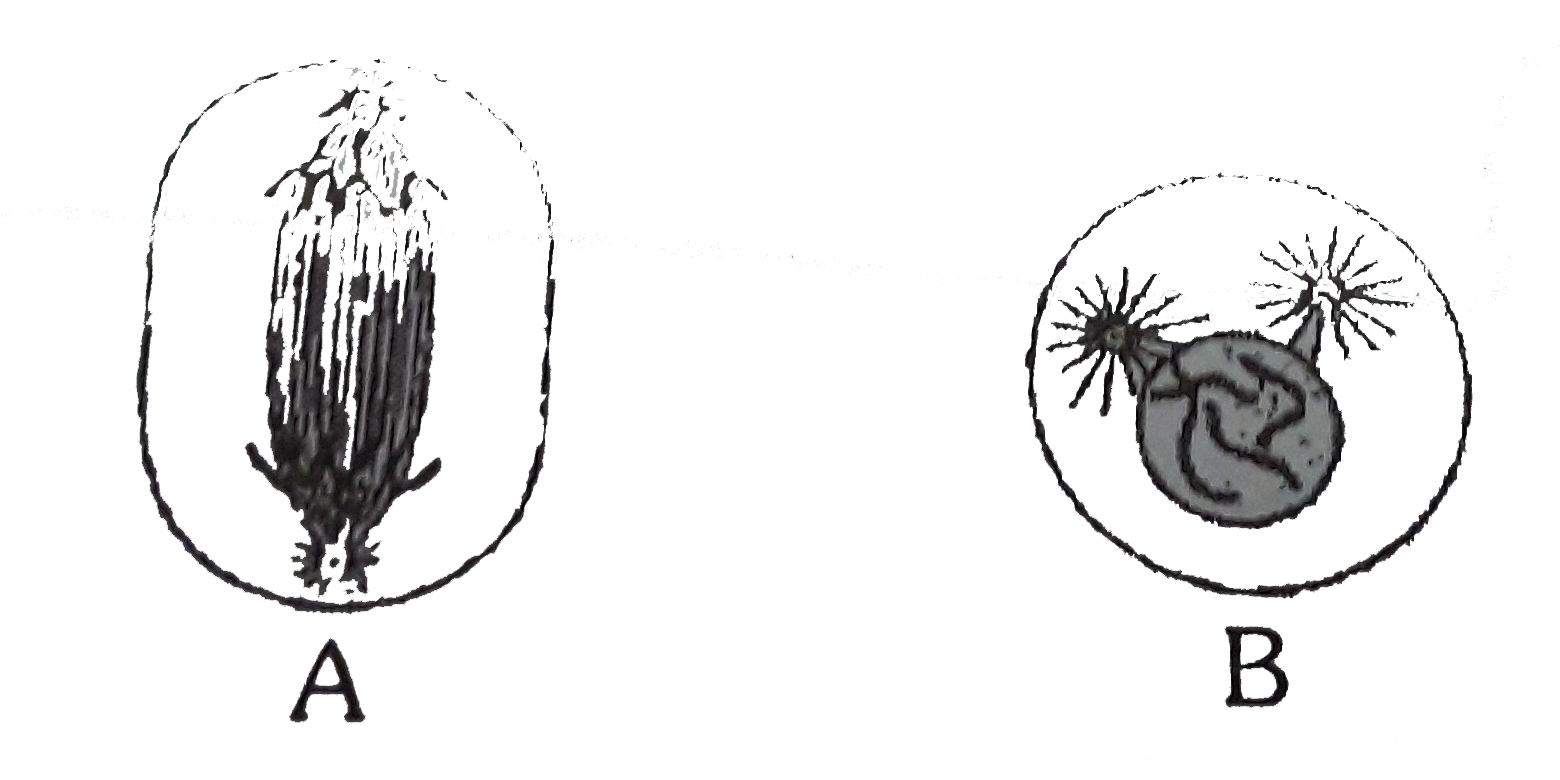 View Solution
Figure shows four PV diagrams. Which of these curves represent isothermal and adiabatic processes?
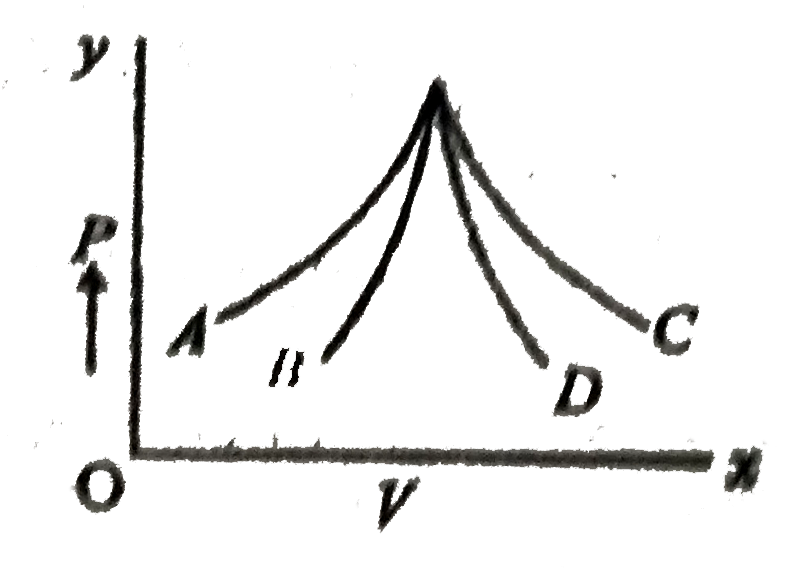 View Solution
Which of the following options is correct with respect to the circuit diagram given below?
 View Solution
Which stages of cell division do the following figures A and B represent respectively ?
 View Solution
For a given thermodynamic cyclic process, P−V indicator diagram is as shown in the figure. Process AB,BC&CA are isobaric, & isothermal respectively. Then which of the following curve represent correc V−T indicator diagram for the process ABCA?
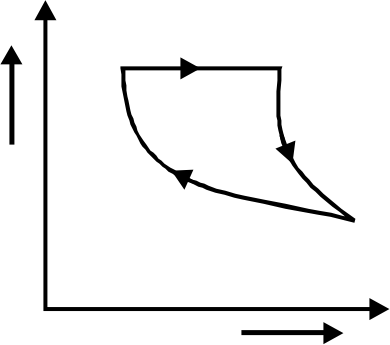 View Solution
