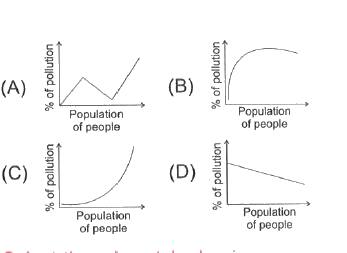
Which of the following graphs shows the likely relationship between the percentage of pollution to the population of people in a particular town?
Video Solution
Text Solution
The correct Answer is:C
As the population of people increases, pollution will also increase.
|
Updated on:21/07/2023
Related Playlists
- BOOK - SCIENCE OLYMPIAD FOUNDATION CHAPTER - POLLUTION OF AIR AND WATER EXERCISE - ACHIEVERS SECTION (HOTS)5videos
POLLUTION OF AIR AND WATER
- BOOK - SCIENCE OLYMPIAD FOUNDATION CHAPTER - NSO QUESTION PAPER 2020-21 SET AEXERCISE - SCIENCE14videos
NSO QUESTION PAPER 2020-21 SET A
- BOOK - SCIENCE OLYMPIAD FOUNDATION CHAPTER - REPRODUCTION AND ENDOCRINE SYSTEMEXERCISE - ACHIEVERS SECTION (HOTS)4videos
REPRODUCTION AND ENDOCRINE SYSTEM
Similar Practice Problems
- Question 1 - Select One
Which of the following graphs shows the relationship between the rate of an enzymatic activity and substrate concentration (S) ?
A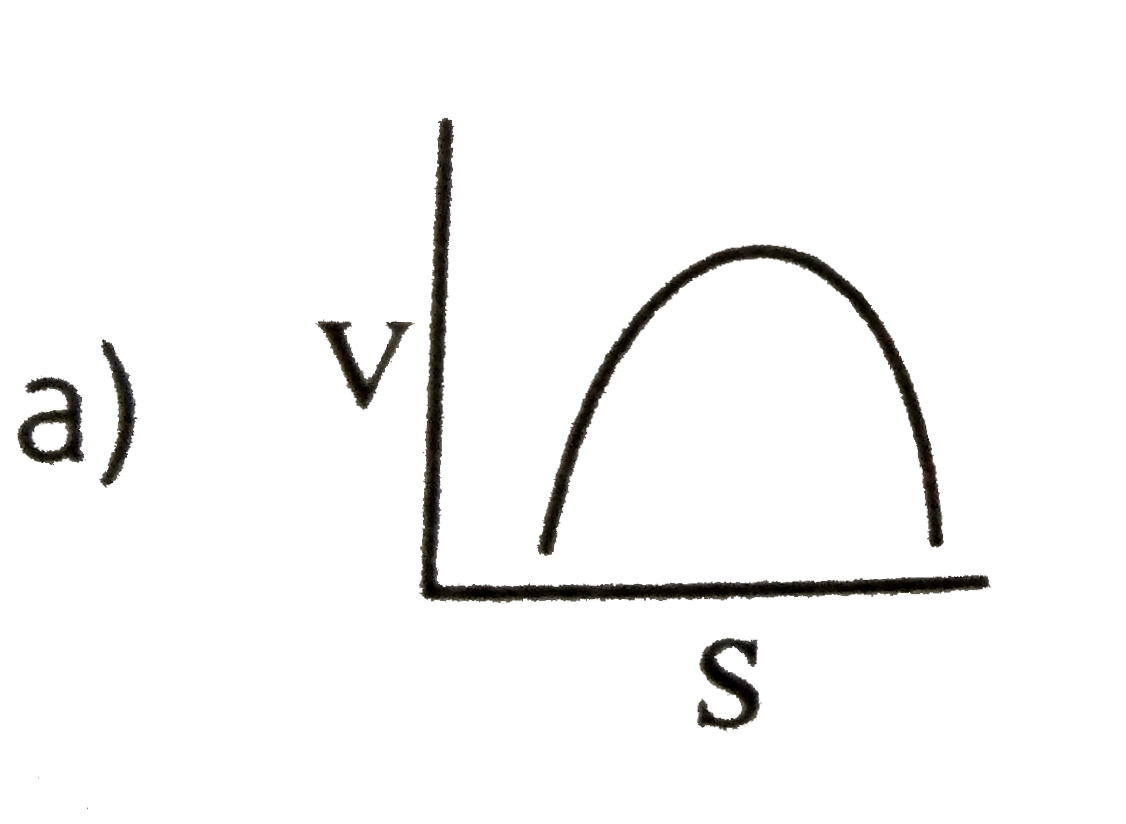 B
B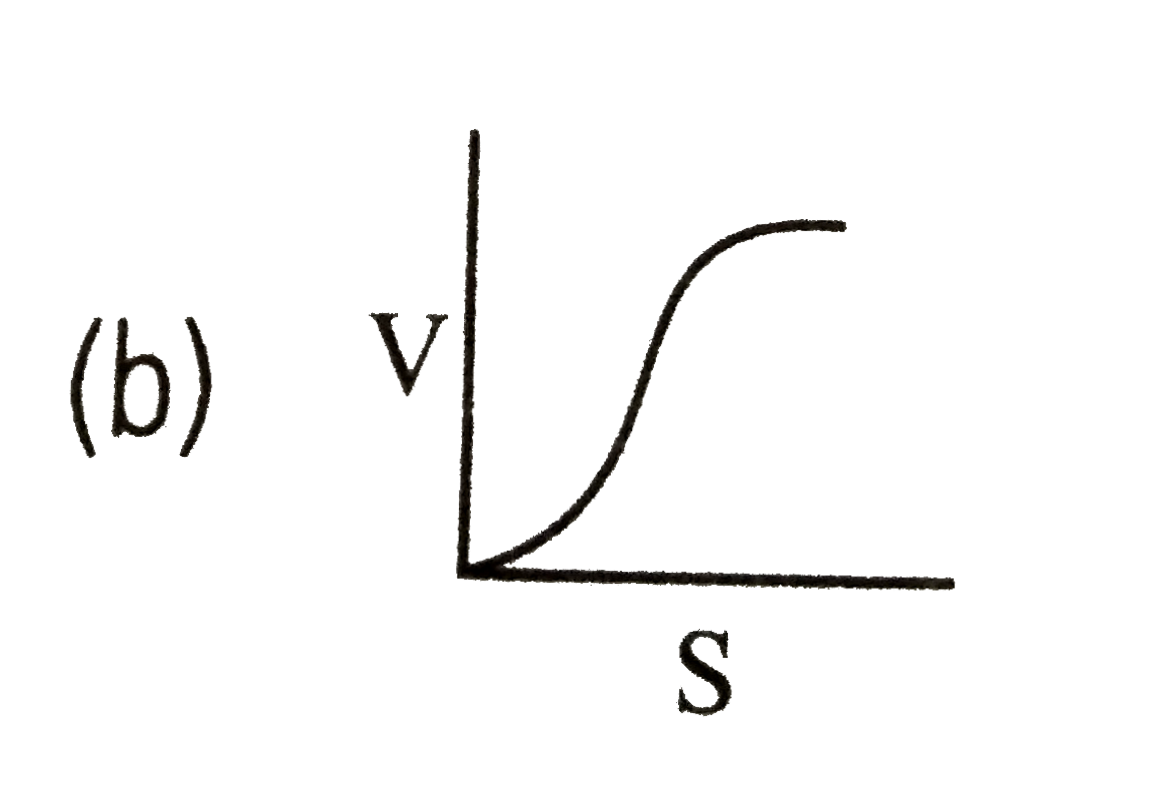 C
C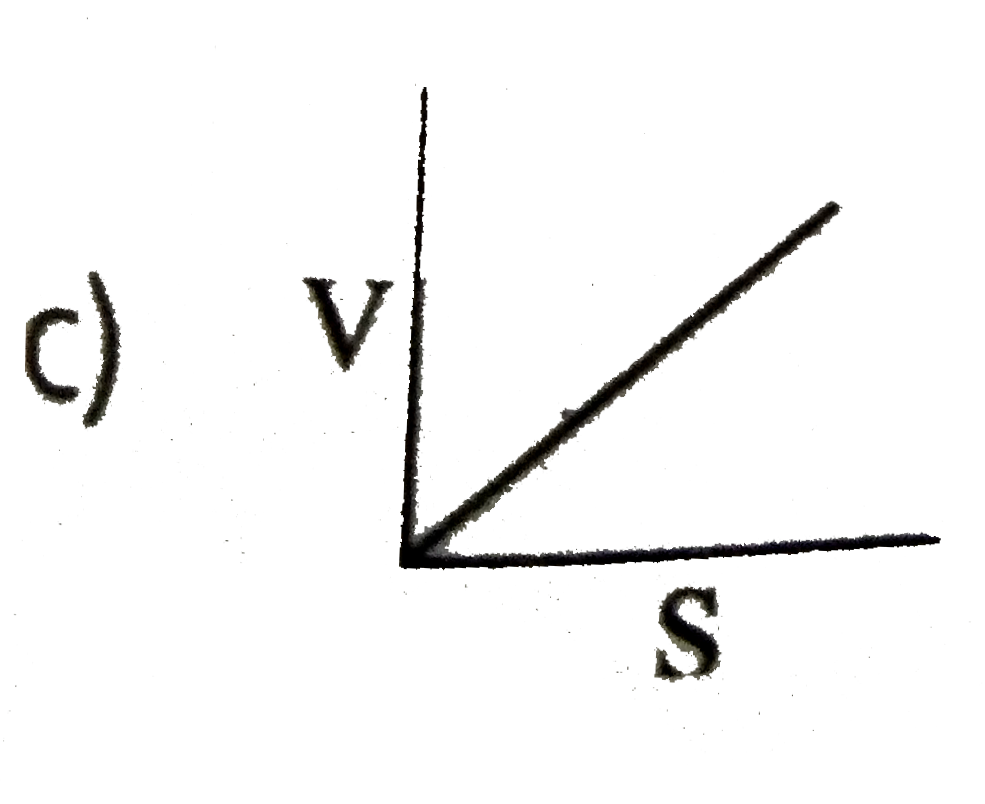 D
D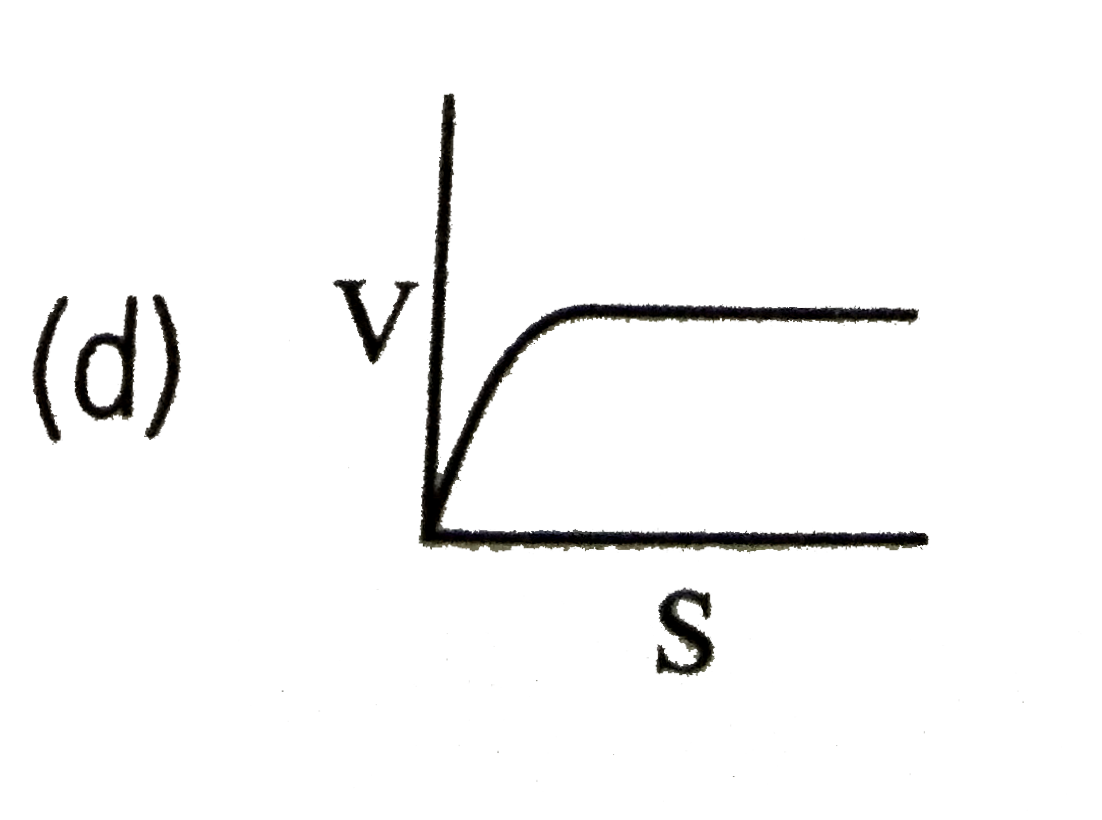
- Question 1 - Select One
Which one of the following graphs show the relationship between the rate of an enzymatic activity and substrate conc(S) -
A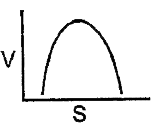 B
B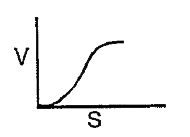 C
C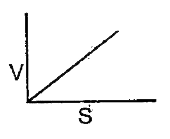 D
D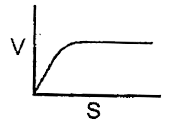
- Question 1 - Select One
Which of the following graphs shows the relationship between the rate of an enzymatic activity and substrate concentration (S) ?
A B
B C
C D
D
- Question 1 - Select One
Which of the following does not show diagonal relationship between beryllium and aluminium?
ABoth BeO and Al2O3 are amphoteric in nature.BBoth beryllium and aluminium form polymeric covalent hydrides.CBoth beryllium and aluminium form nitrides with nitrogen which evolve NH3 with water.DBoth metal carbonates are highly stable. - Question 1 - Select One
Of the following graphs , the one which shows the relationship between the resistance R of multirange moving coil ammeter and its range I is
A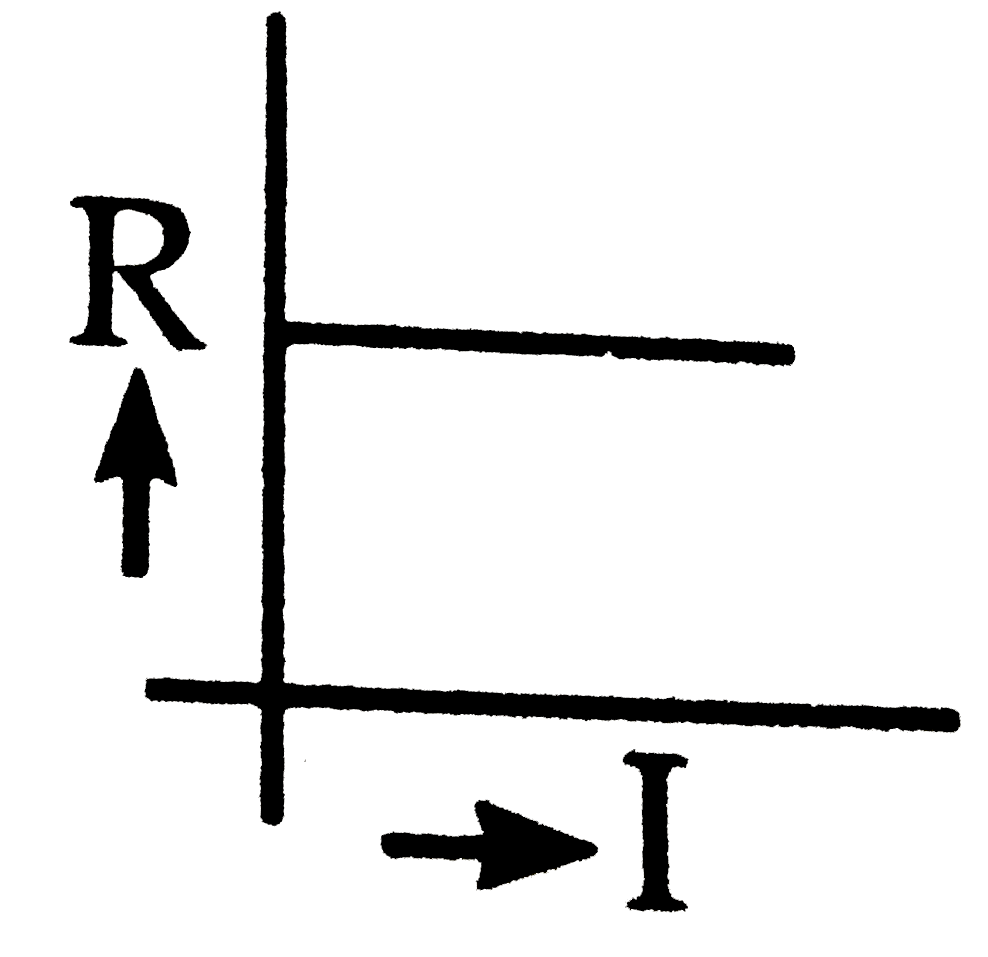 B
B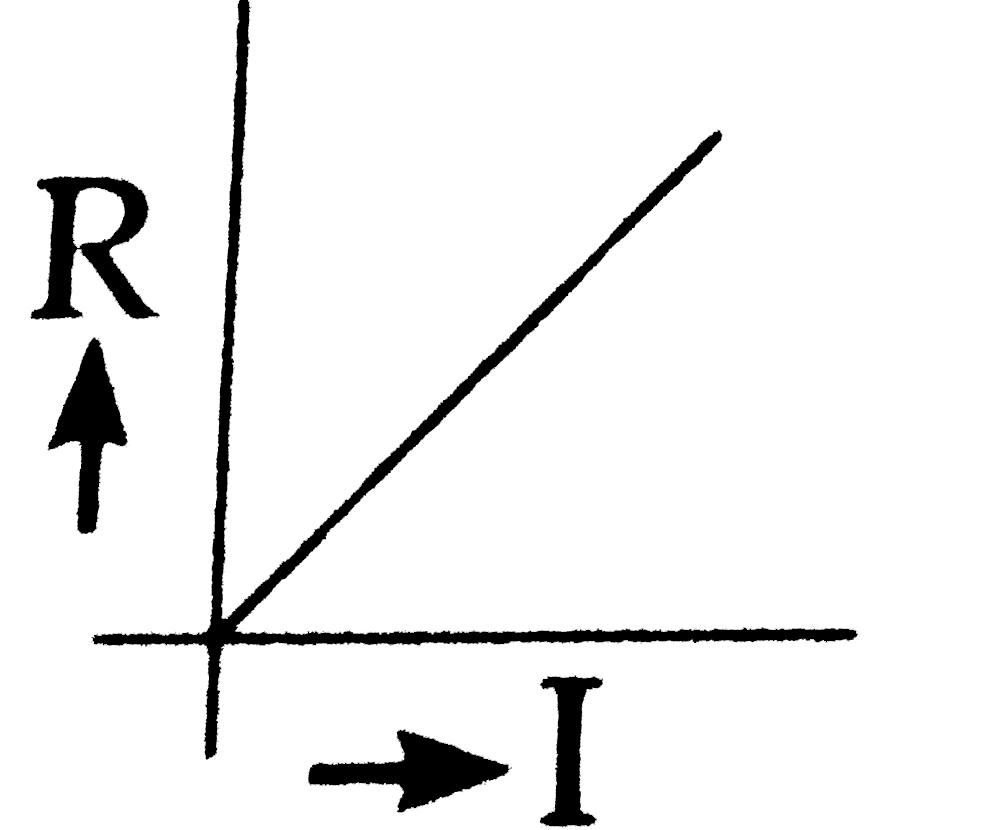 C
C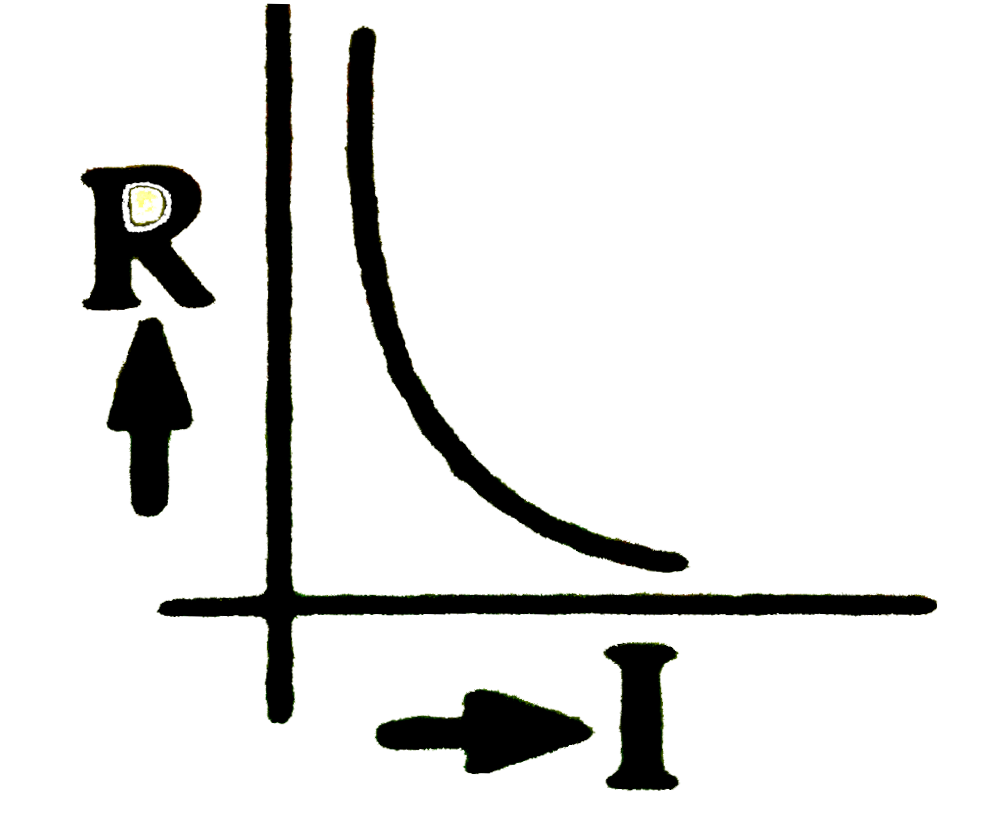 D
D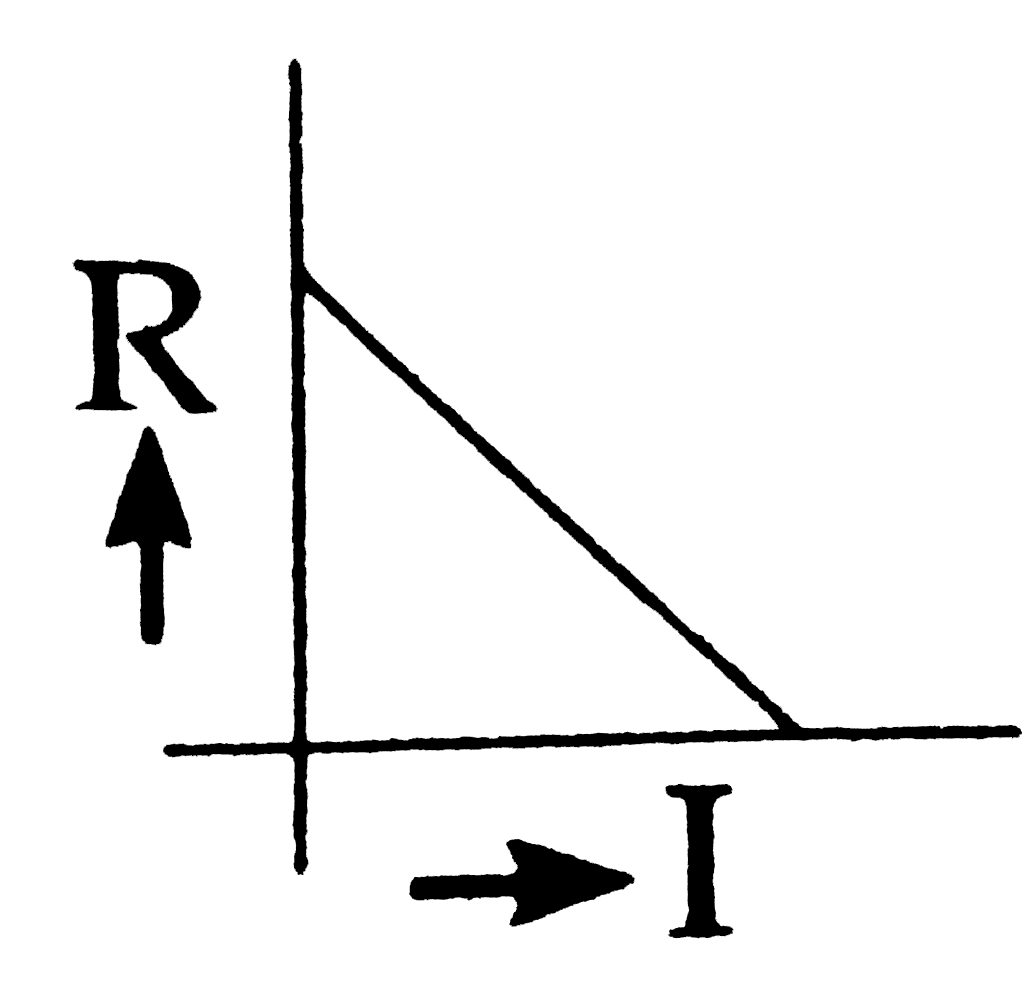
- Question 1 - Select One
Which of the following is correct statement showing showing the relationship between AP and MP ?
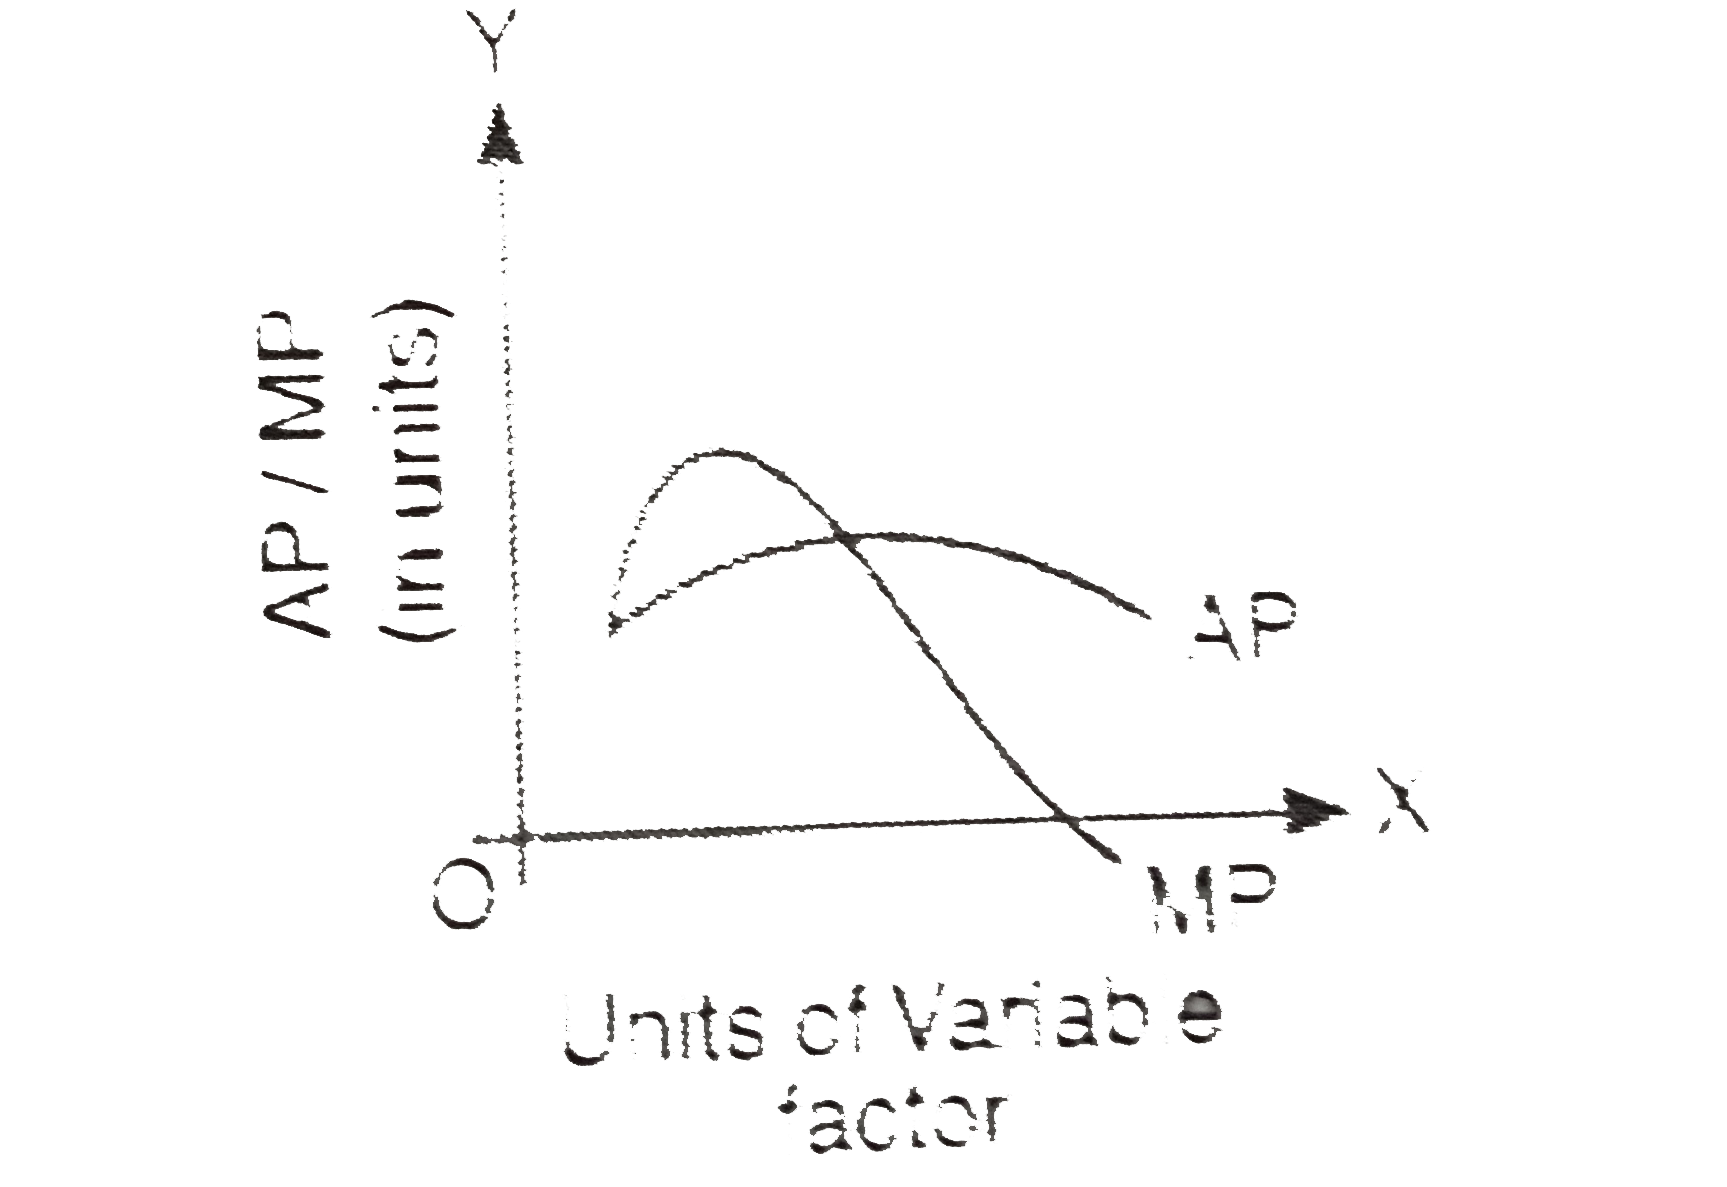 AWhen MP>AP,AP increasesBWhen MP=AP,AP is constantCWhen MP<AP,AP fallsDAll of these
 - Question 1 - Select One
Which of the following will not control particular pollutants
AIncineratorBArresterCScrubberDFilter - Question 1 - Select One
The bar graph shows the number of males and females (in crores) in india during 1951-1991. Read the graph and answer the following questions
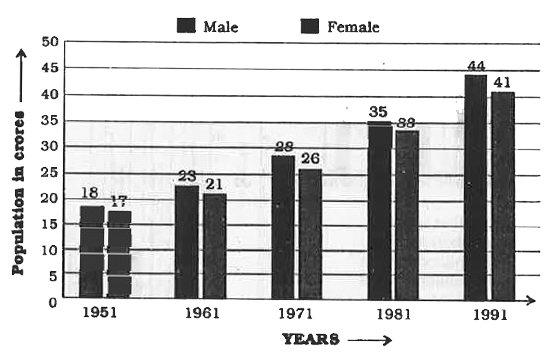
What was the approximate percentage of female population of female population in India during 1991 ?A48.23B48.02C48.03D48.33 - Question 1 - Select One
Which of the graphs shown in the figure below best represents the relationship between the radioactive decay rare [−(dN/dt)] and population N?
A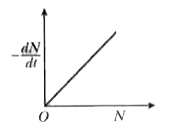 B
B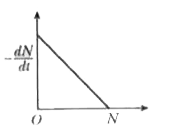 C
C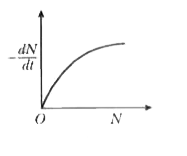 D
D