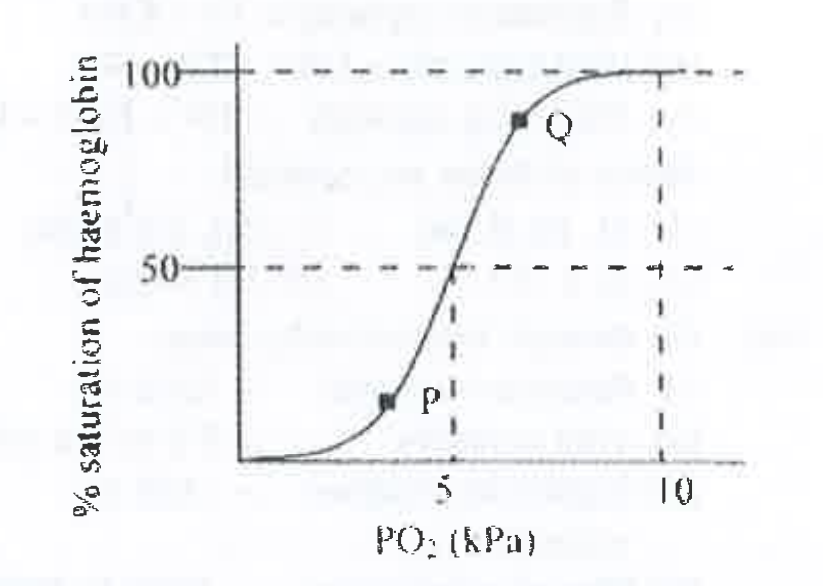
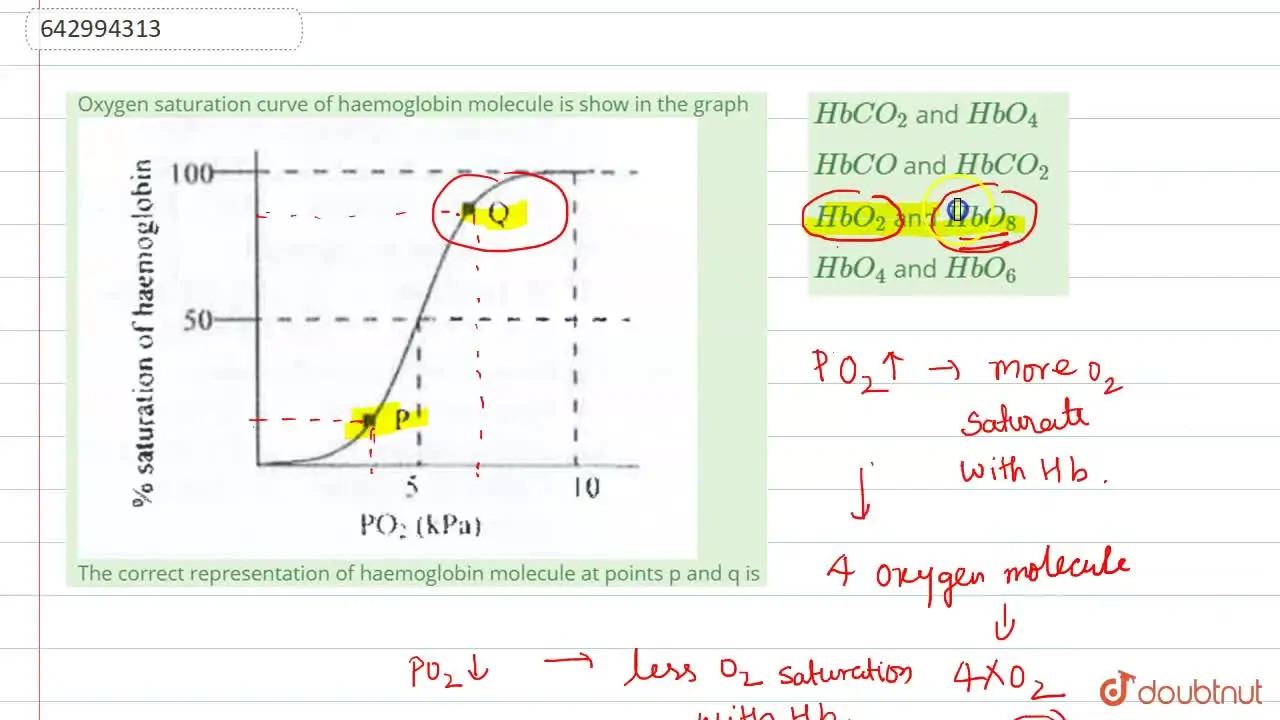
Oxygen saturation curve of haemoglobin molecule is show in the graph

The correct representation of haemoglobin molecule at points p and q is respectively
HbCO2 and HbO4
HbCO and HbCO2
HbO2 and HbO8
HbO4 and HbO6
The correct Answer is:C
Step by step video & image solution for Oxygen saturation curve of haemoglobin molecule is show in the graph The correct representation of haemoglobin molecule at points p and q is respectively by Biology experts to help you in doubts & scoring excellent marks in Class 12 exams.
Related Playlists
Similar Questions
Oxygen dissociation curve of haemoglobin is
View SolutionEach haemoglobin molecule has
View SolutionIdentify correct 2-D representation of following molecule
 View Solution
Name the polypeptides present in a haemoglobin molecule.
View SolutionNumber of iron atoms present in haemoglobin molecule is
View SolutionOxygen molecule shows the property of :
View SolutionNumber of haemoglobin molecules present in an average
human body isView SolutionThe correct statement in respect of protein haemoglobin is that it
View SolutionSelect the correct statements about oxygen molecule.
View SolutionWhich of the following is correct representation of dipole moment of NH3 molecule?
View Solution


