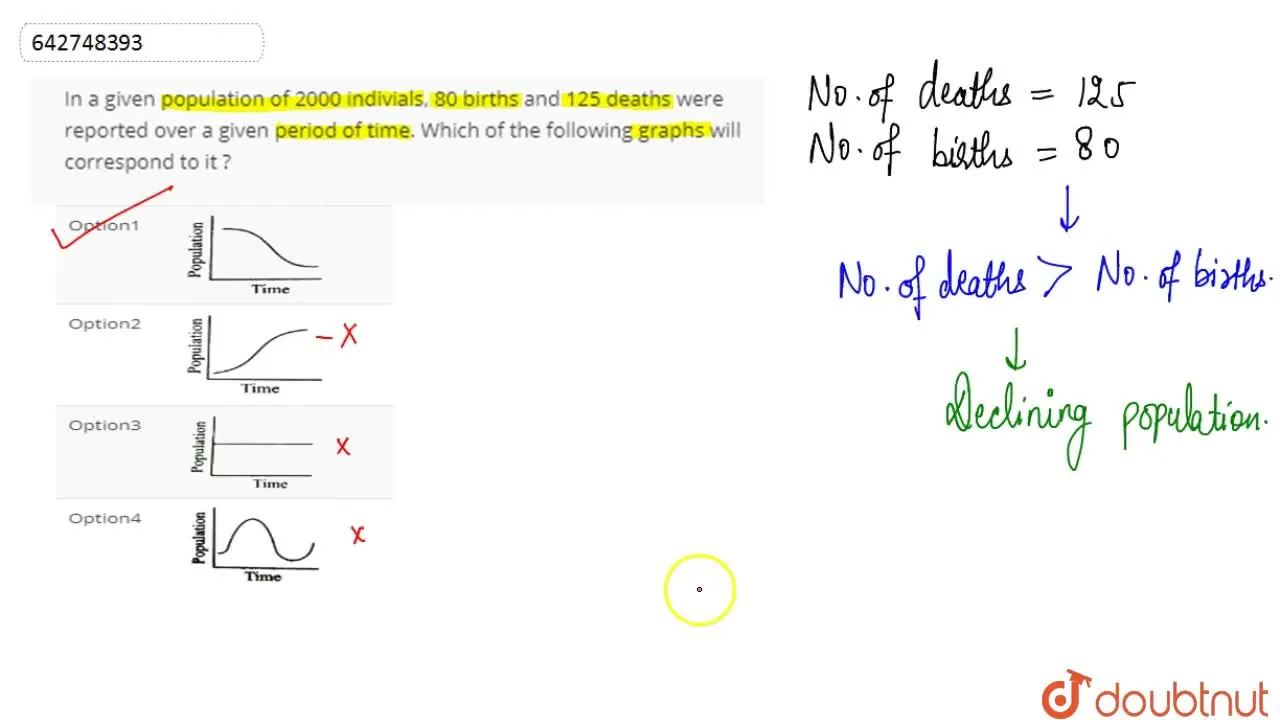
In a given population of 2000 indivials, 80 births and 125 deaths were reported over a given period of time. Which of the following graphs will correspond to it ?
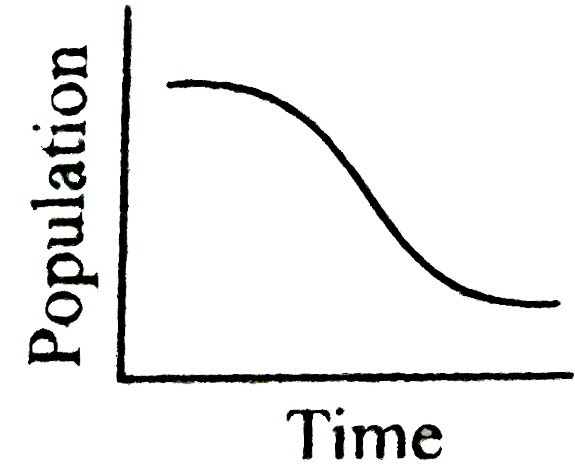
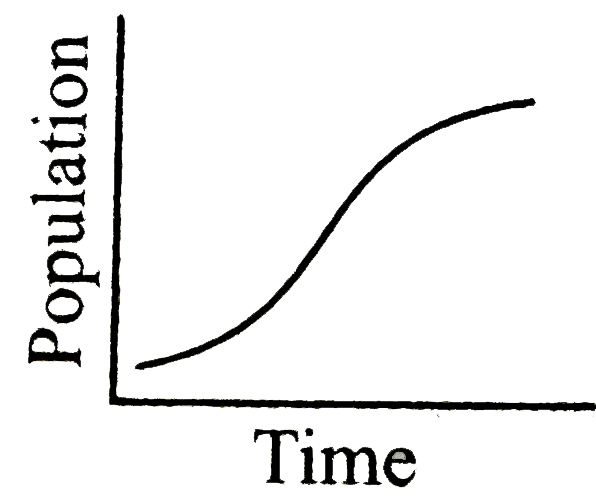
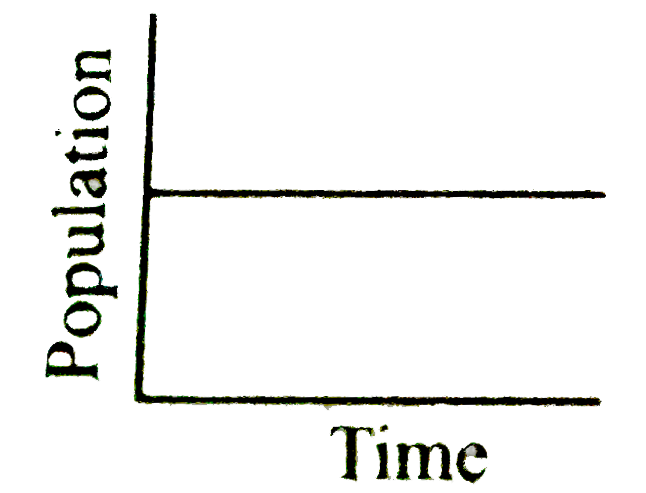
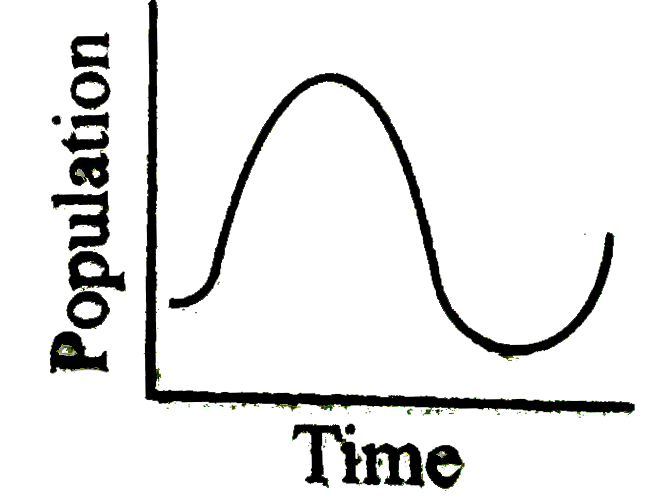
The correct Answer is:A
Number of deaths is more than the number of births, showing a declining population.
Related Playlists
- BOOK - NCERT FINGERTPS ENGLISHCHAPTER - ORGANISMS AND POPULATIONEXERCISE - HOTS5videos
ORGANISMS AND POPULATION
- BOOK - NCERT FINGERTPS ENGLISHCHAPTER - ORGANISMS AND POPULATIONEXERCISE - NCERT20videos
ORGANISMS AND POPULATION
- BOOK - NCERT FINGERTPS ENGLISHCHAPTER - MOLECULAR BASIS OF INHERITANCEEXERCISE - Molecular Basis Of Inheritance151videos
MOLECULAR BASIS OF INHERITANCE
- BOOK - NCERT FINGERTPS ENGLISHCHAPTER - PRACTICE PAPERSEXERCISE - Practice paper150videos
PRACTICE PAPERS
Similar Questions
Which of the following graph corresponds to a population of 2000 individuals, with 800 births and 1200 deaths over a given period of time?
View SolutionWhich of the following option is correct about given graph?
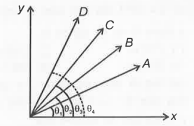 View Solution
Which of the following is incorrect about the given graph ?
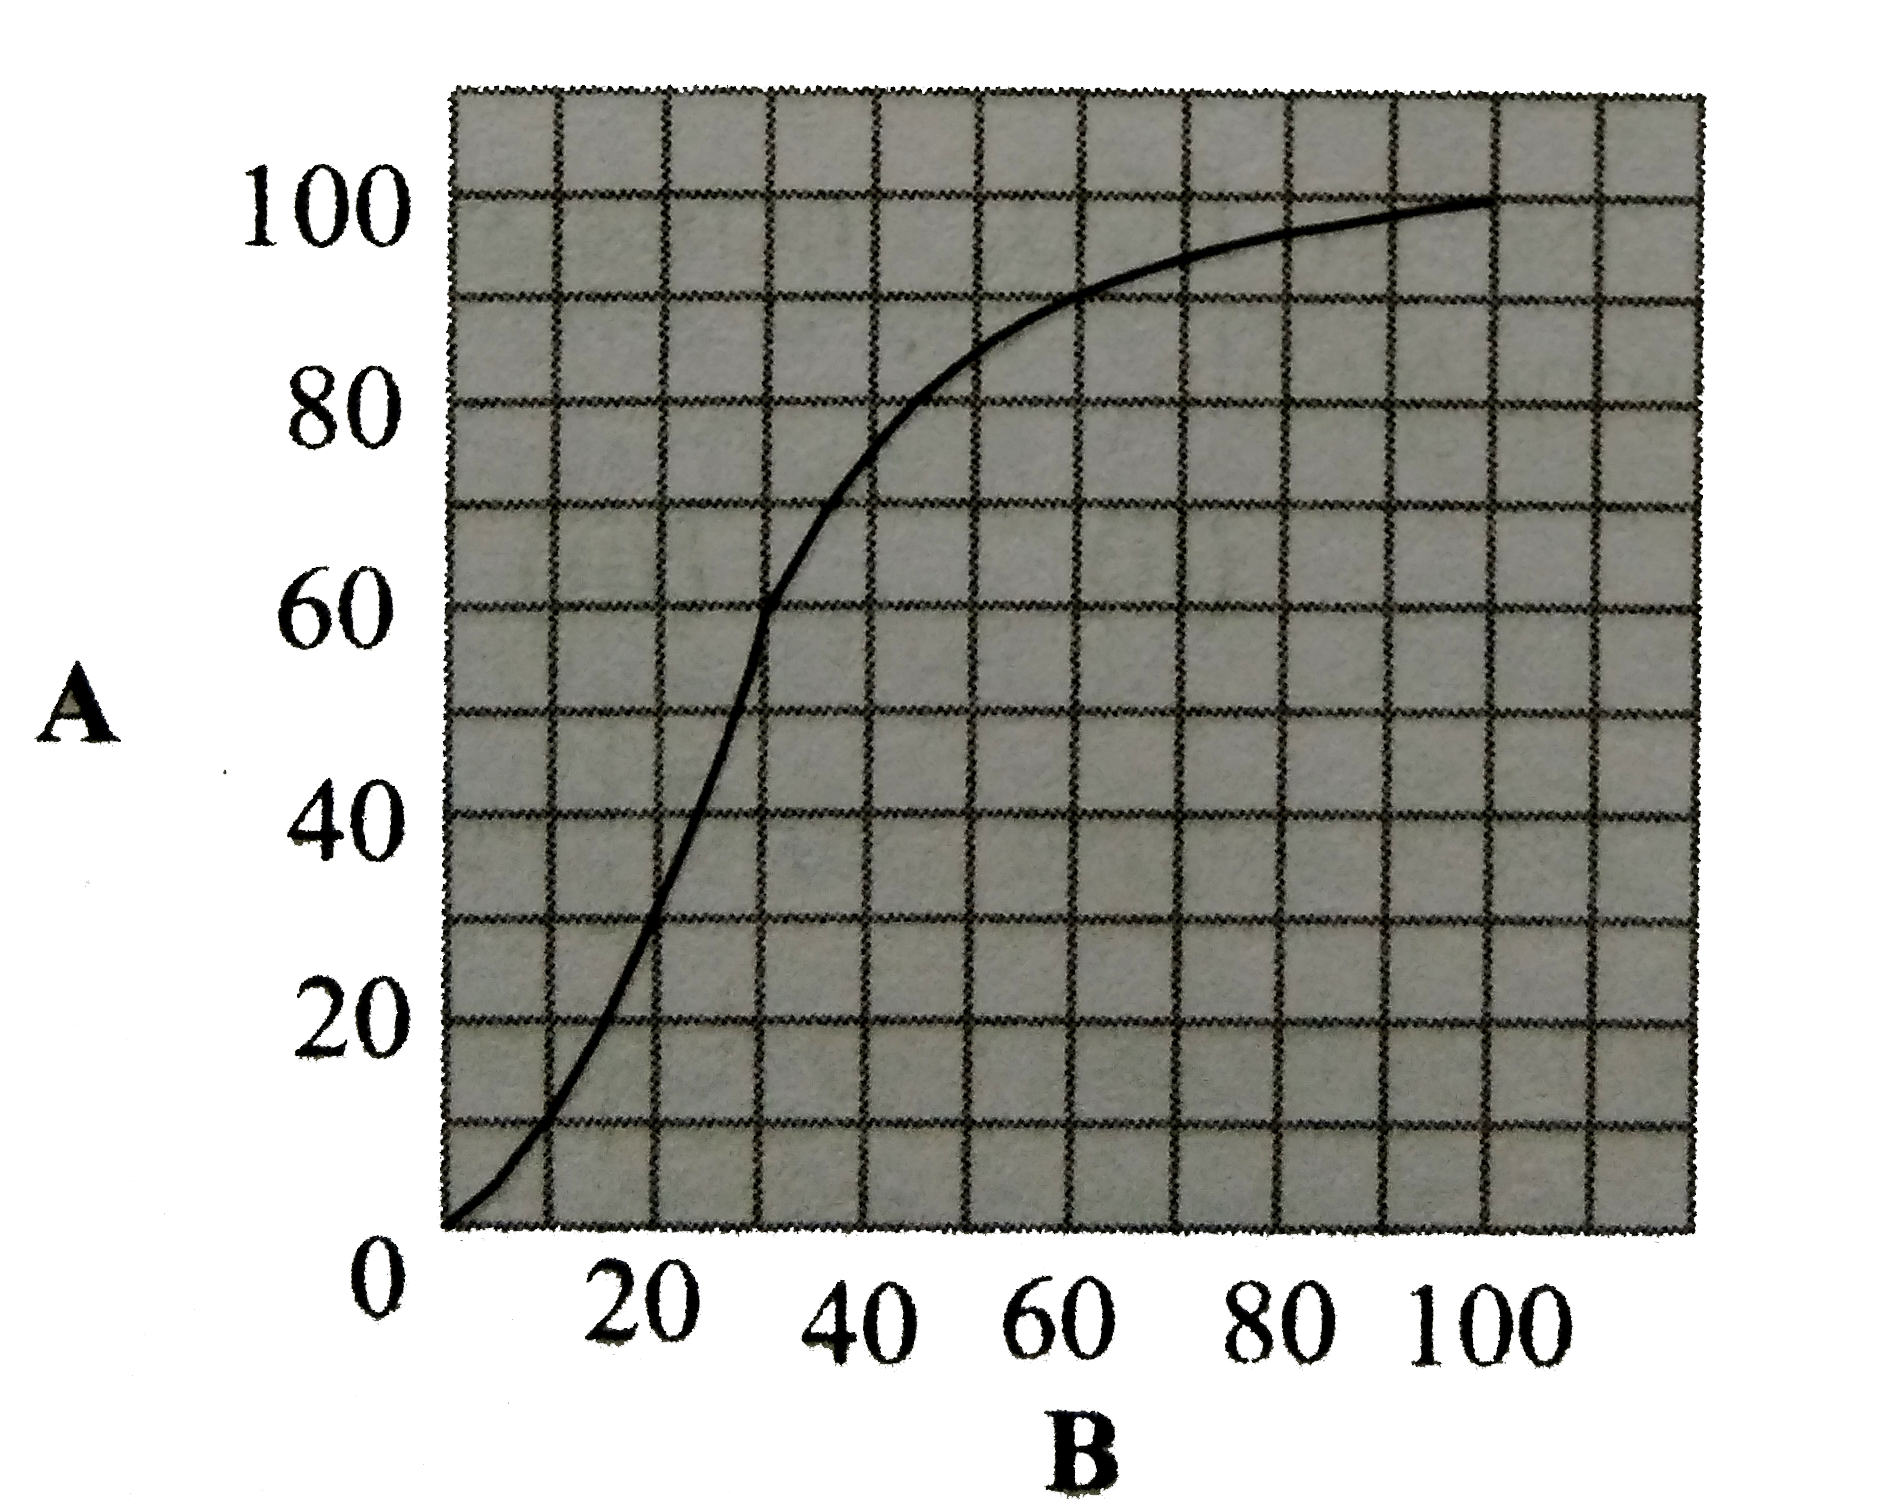 View Solution
From the given graph
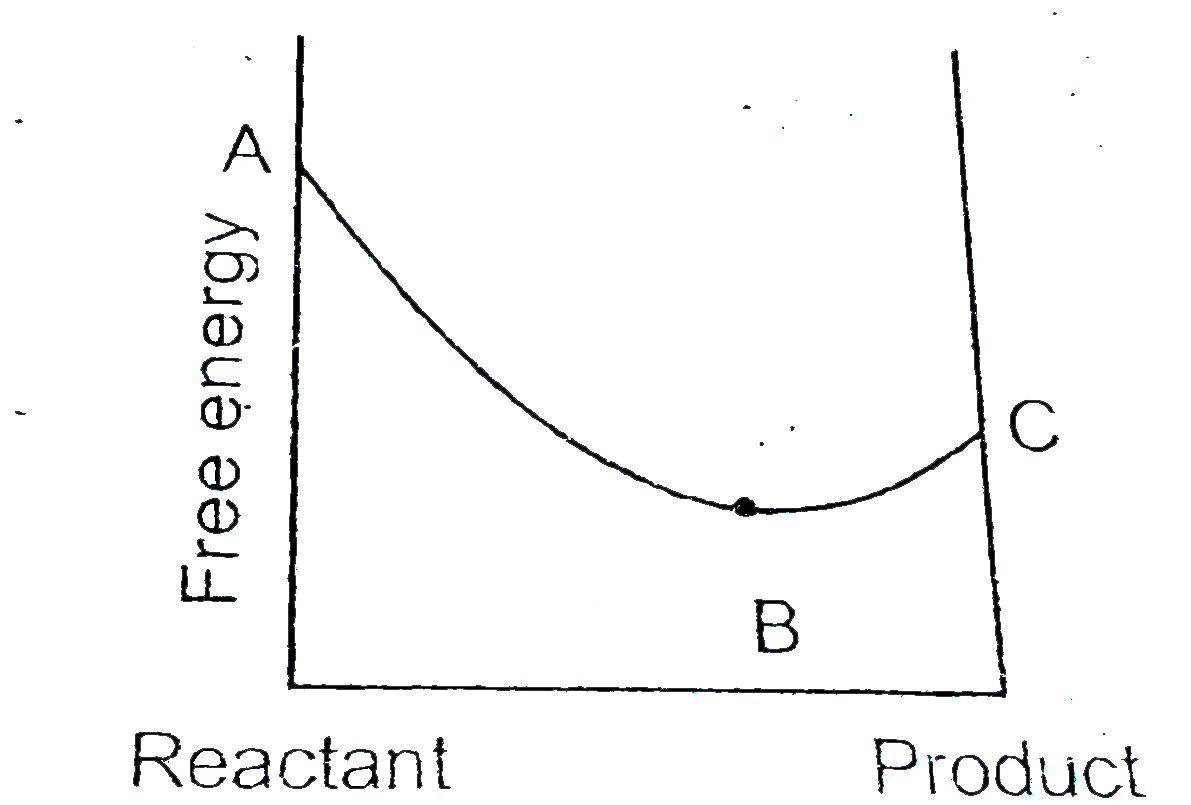
Which of the following statement is correct ?View SolutionWhich of the following describes the given graph correctly ?
 View Solution
Which of the following is true about given graphs A and B ?View SolutionWhich of the following gates correspond to the truth table given below ?
 View Solution
Which of the following gates corresponds to the truth table given below?
 View Solution
Which of the following gates corresponds to the truth table given below ?
 View Solution
Which of the following graphs given below show (s) adiabatic process?
 View Solution

