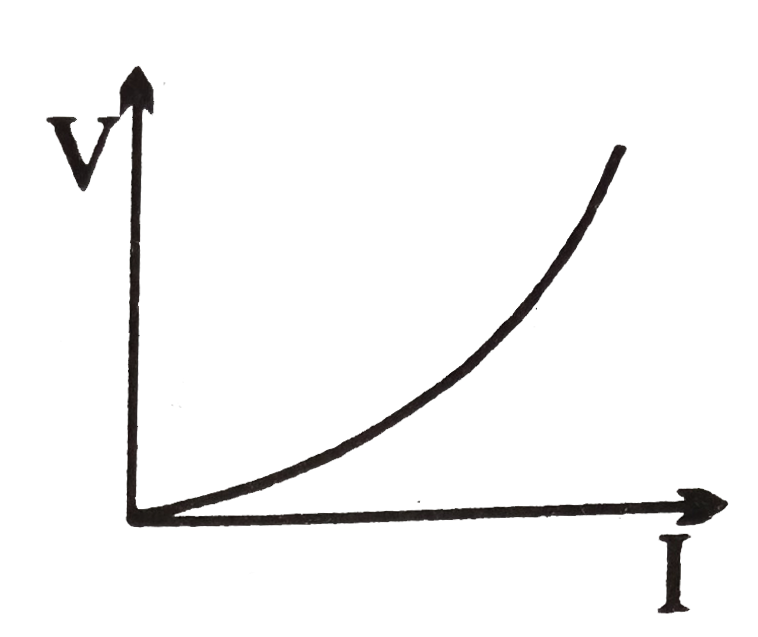
To verify Ohm's law, a student connects the voltmeter across the battery as shown in the figure. The measure voltage is plotted as a function of the current, and the following graph is obtained
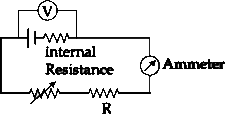
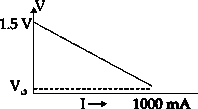
if VO is almost zero. identify the correct statement
the emf of the battery is 1.5 V and its internal resistance is 1.5Ω
The value of the resistance R is 1.5Ω
The potential difference across the battery is 1.5 V when it sends a current of 1000 mA.
The emf of the battery is 1.5 V and the value of R is 1.5Ω
The correct Answer is:B
Step by step video, text & image solution for To verify Ohm's law, a student connects the voltmeter across the battery as shown in the figure. The measure voltage is plotted as a function of the current, and the following graph is obtained if V_(O) is almost zero. identify the correct statement by Physics experts to help you in doubts & scoring excellent marks in Class 12 exams.
Updated on:21/07/2023Topper's Solved these Questions
Similar Questions
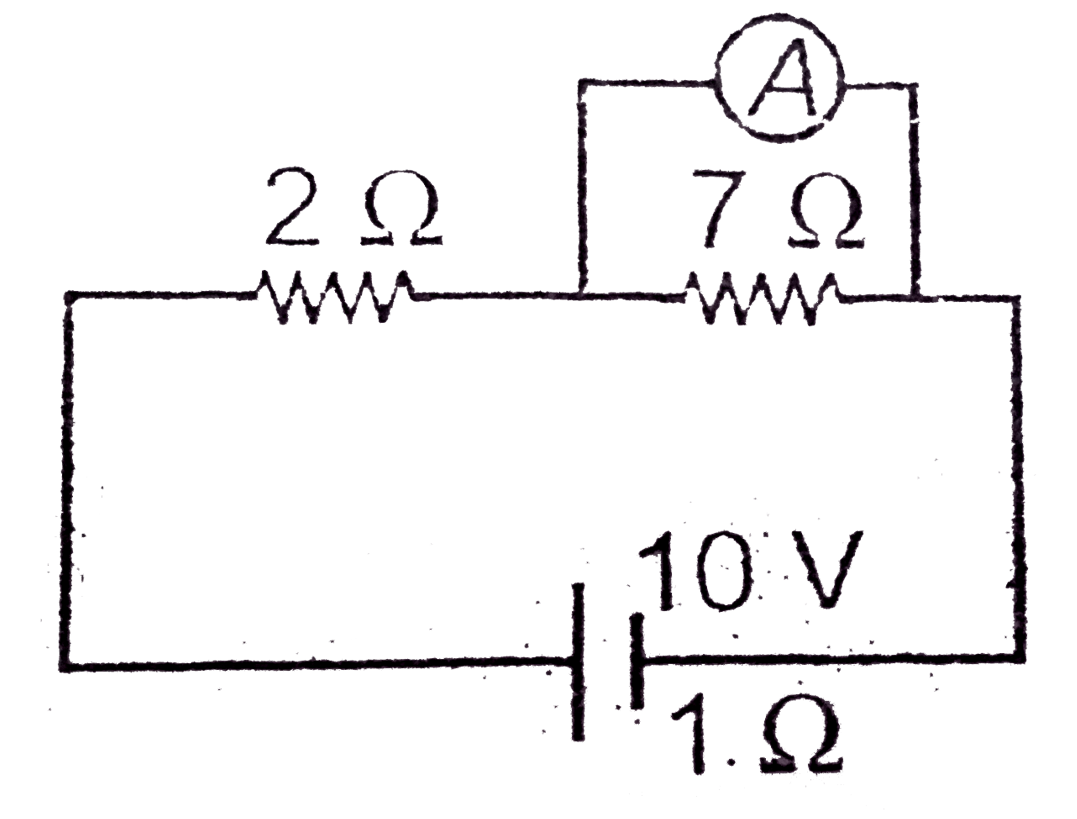
In the situation shown in figure , an ideal ammeter is connected across 7Ωresistors. Select the correct statement from the following
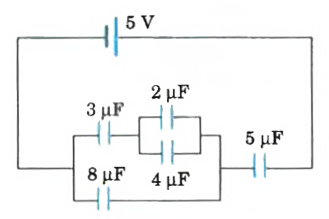
View SolutionFive capacitors are connected across a battery of 5V as shown in figure (o). Calculate the potential difference across the plates of the 5μF capacitor.
View Solution
Knowledge Check
A students connects an ammeter A and a voltmeter V to measure a resistancer as shown in figure. If the voltmeter reads 20V and the ammeter reads 4A, then R is
 Aequal to 5ΩBgreater than 5ΩCless than 5ΩDgreater or less than 5Ω depending upon the direction of current
If graph of a function f(x) which is defined in [-1, 4] is shown in the following figure then identify the correct statement(s).
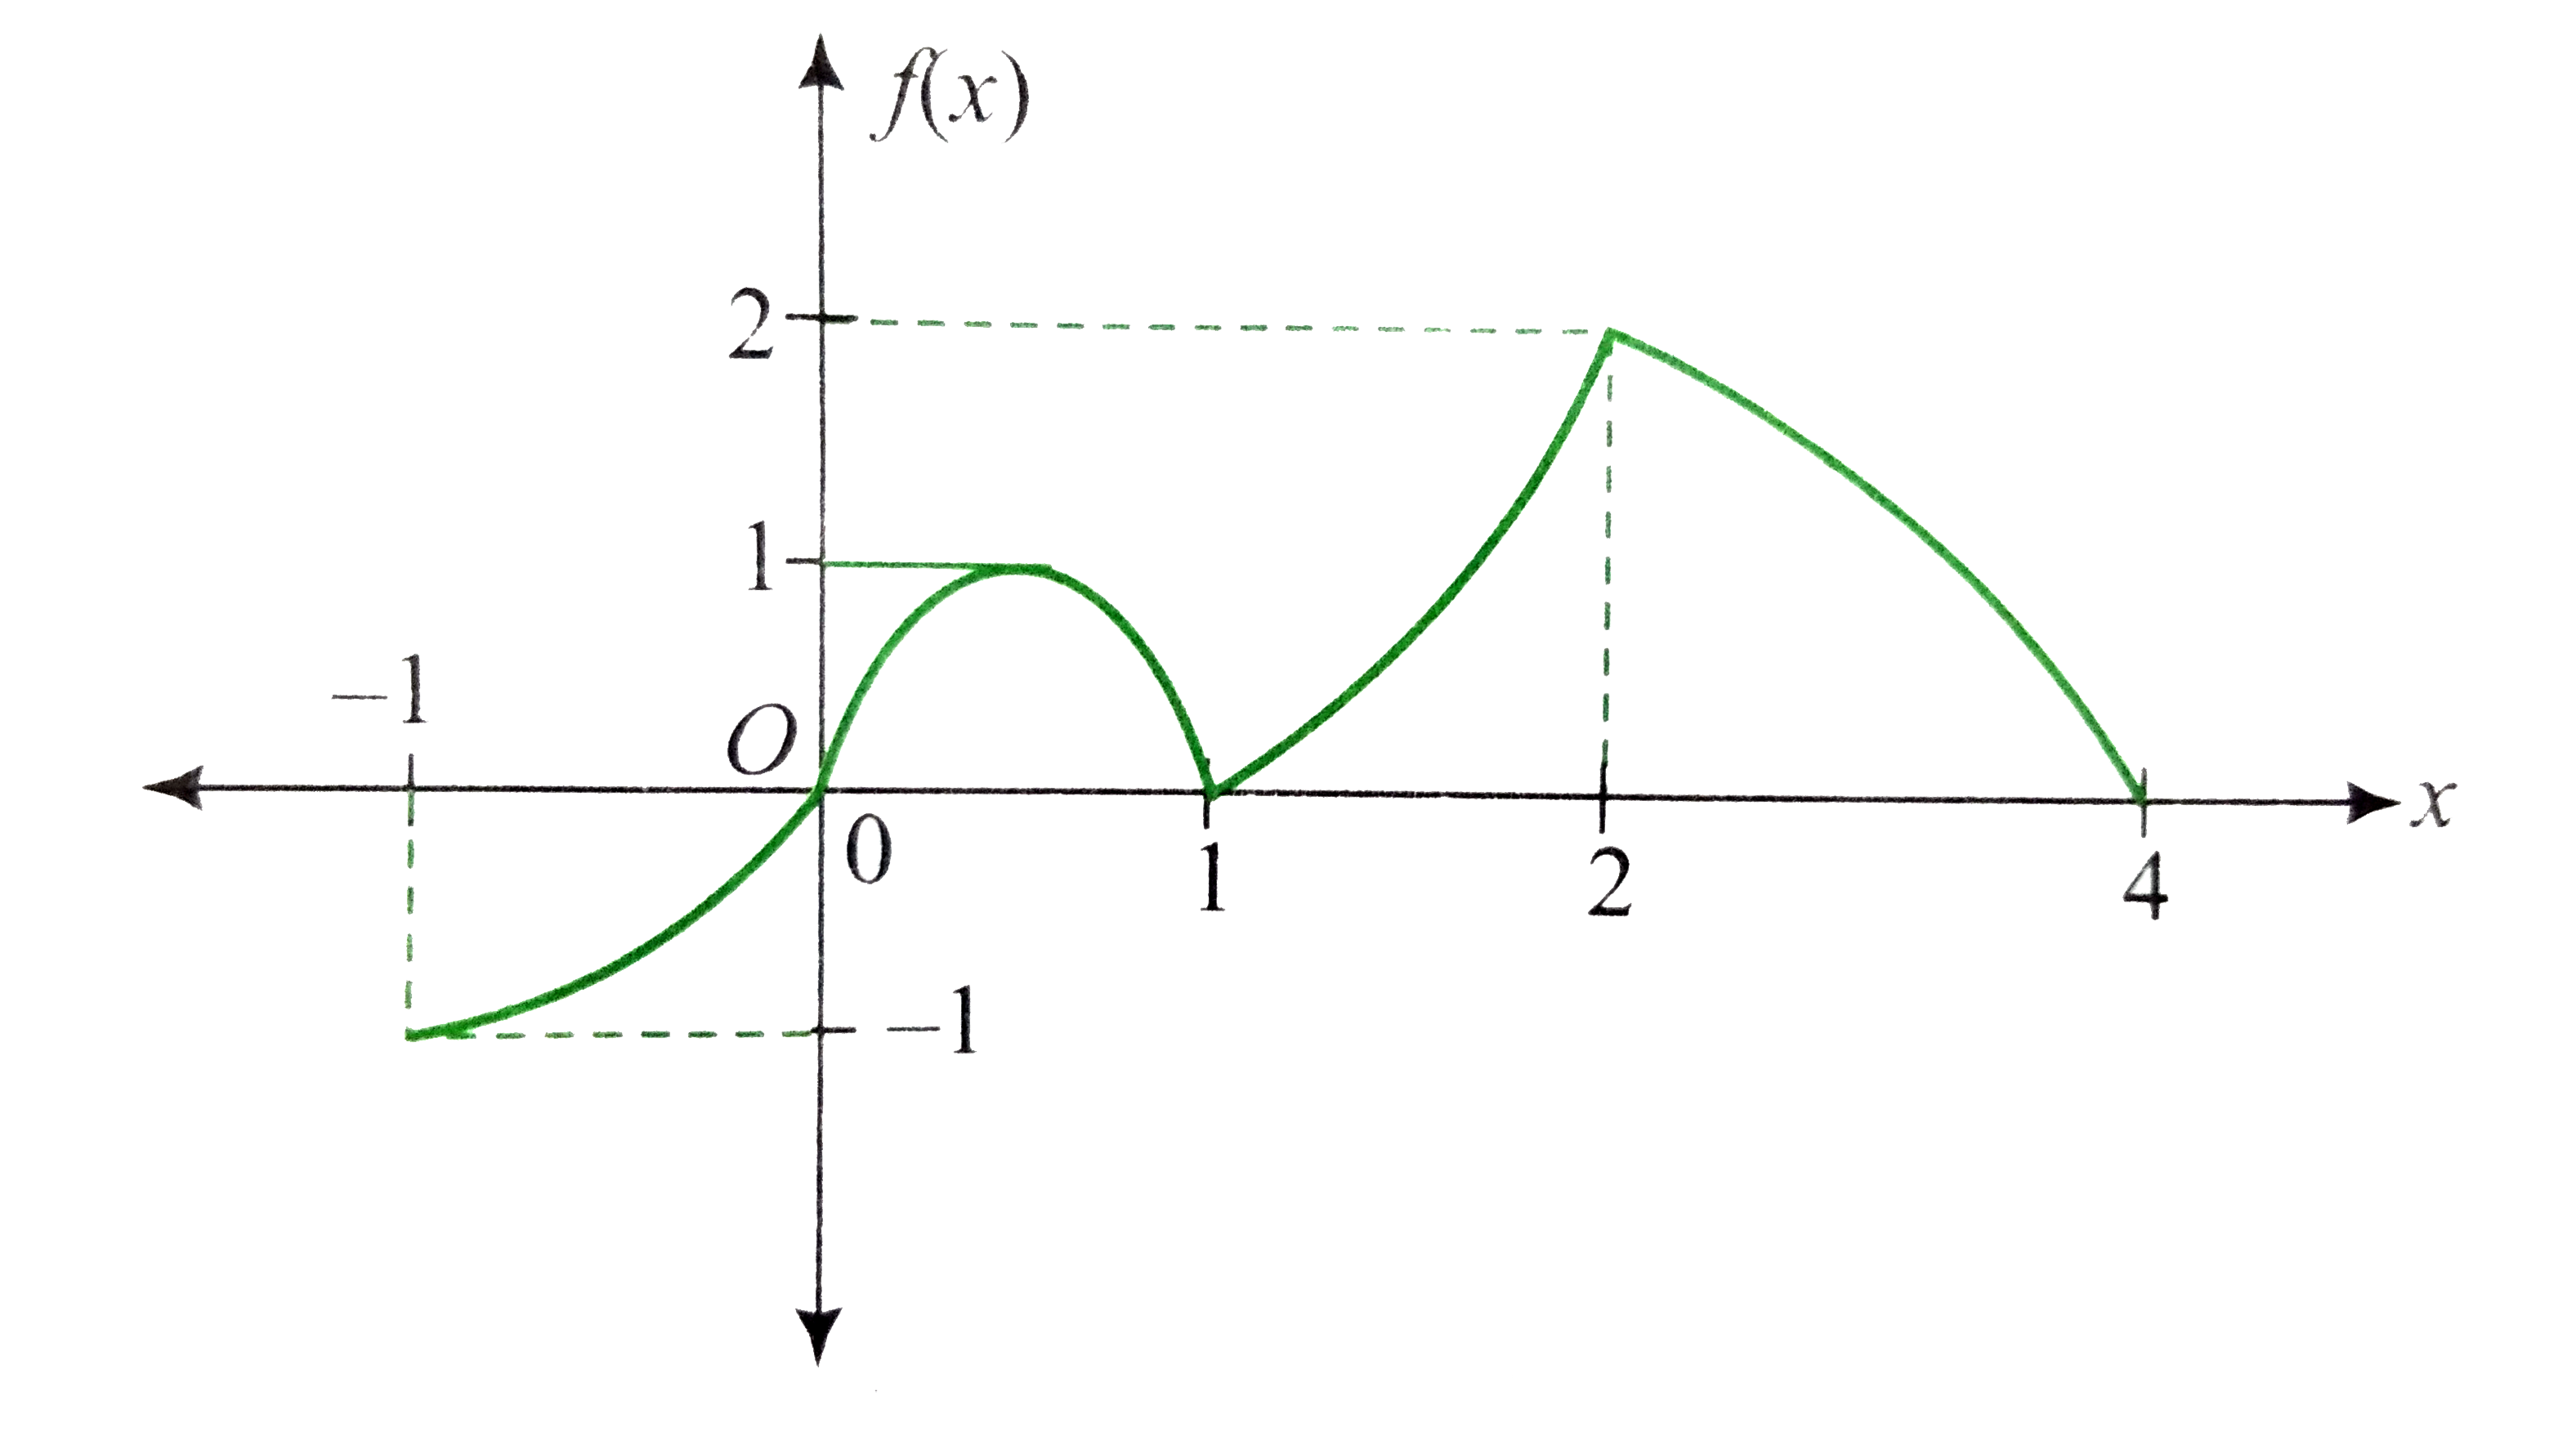 Adomain of f(|x|−1) is [−5,5]Brange of f(|x|+1) is [0,2]Crange of f(−|x|) is [−1,0]Ddomain of f(|x|) is [−3,3]
Different voltages are applied across a P−N junction and the currents are measured for each value. Which of the following graphs is obtained between voltage and current?
A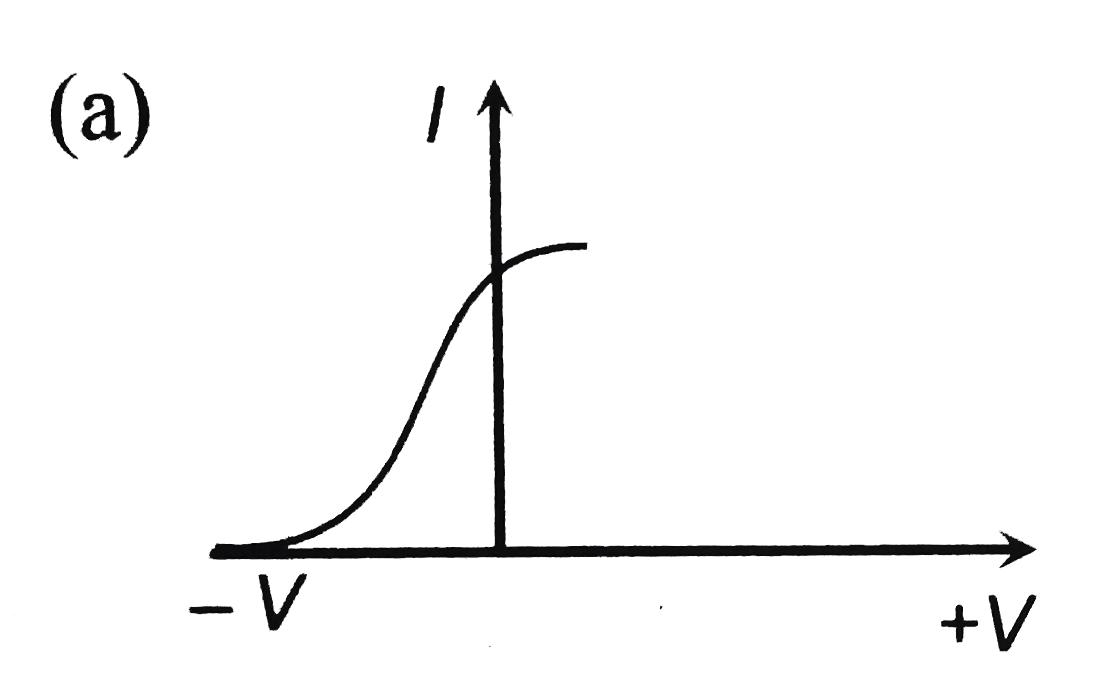 B
B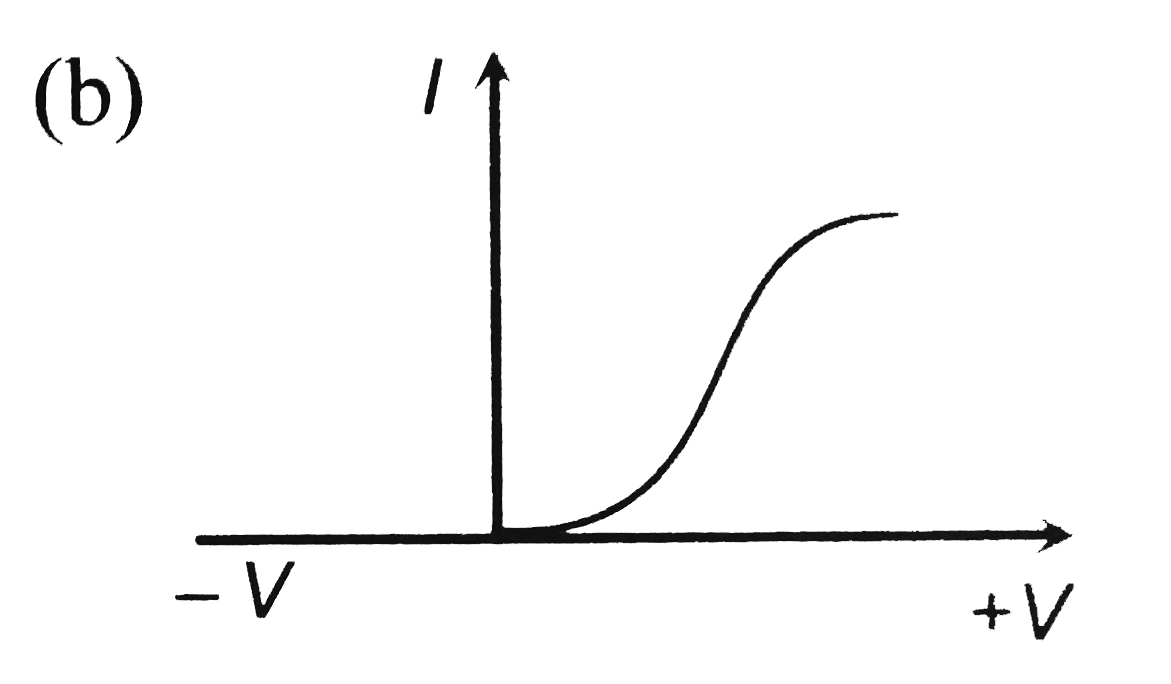 C
C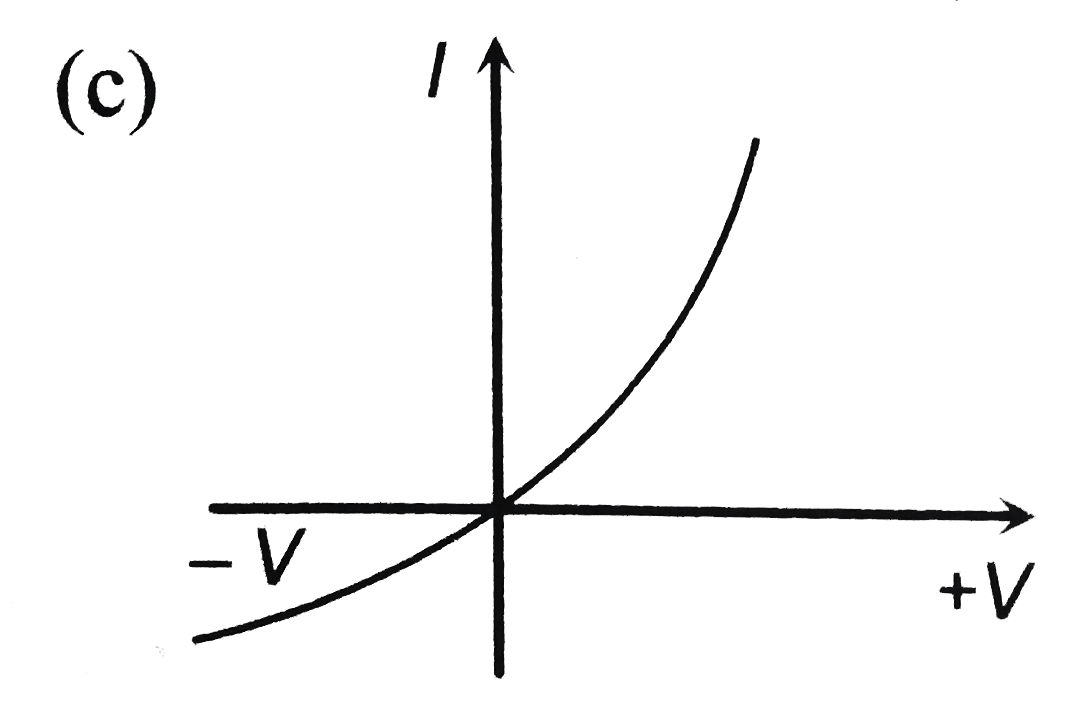 D
D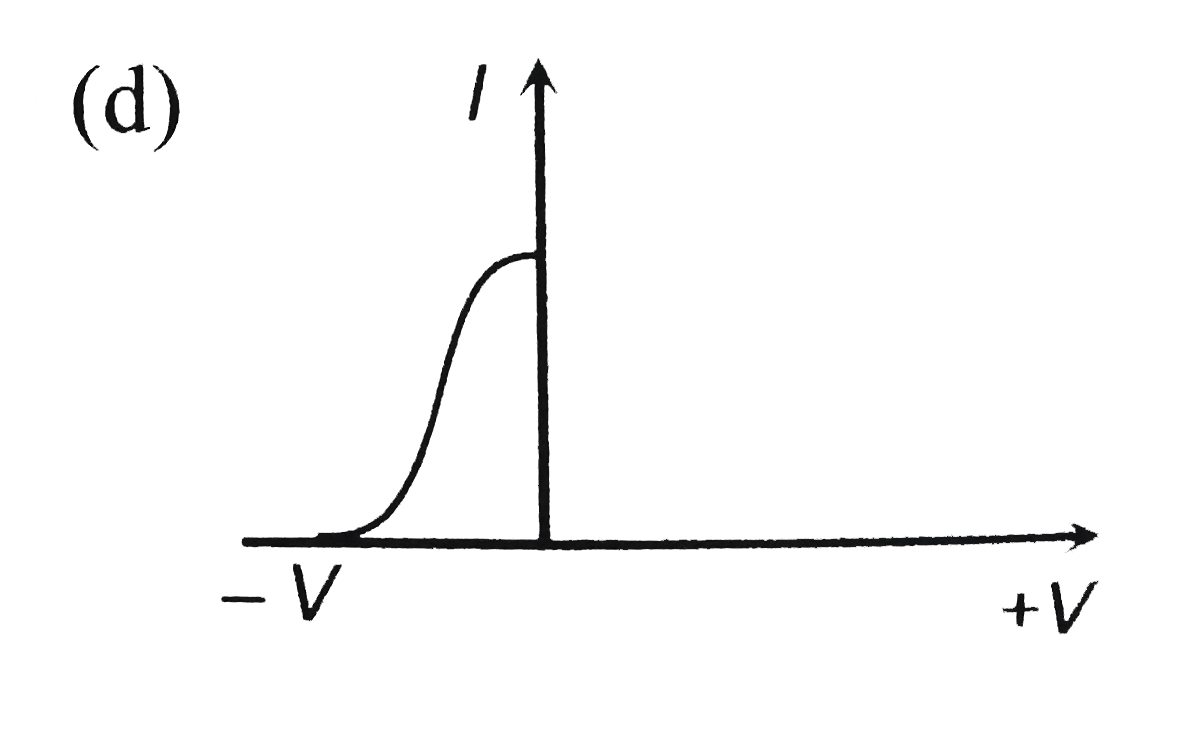
The circuit of a carbon are lamp is shown in the figure (to ignite the lamp the carbon electrodes are touched together, then they are slowly drawn apart). The voltage across the gap between the carbon rods as a function of the current can be given by the following formula : V=A+B/I , where A and B are constants.
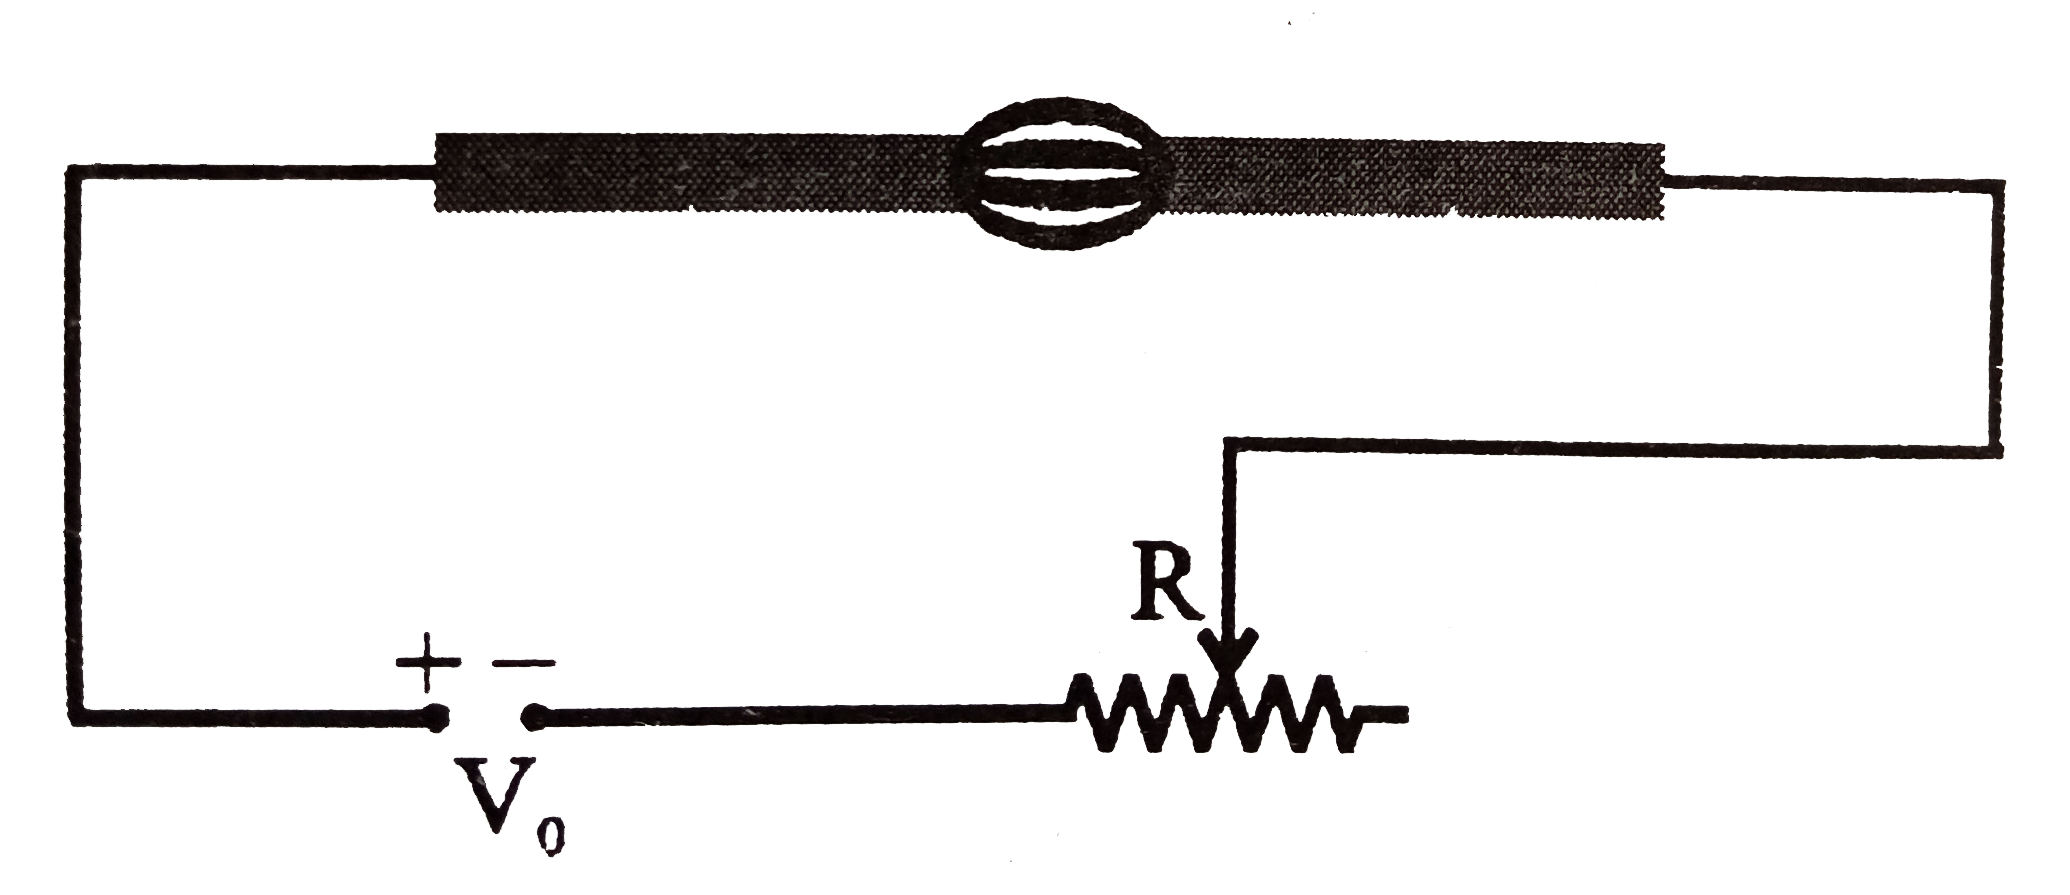
If the voltage of the battery V0 can be considered constant what is the maximum resistance of the rheostat Rmax, that should be connected in series to ignite the lamp. Data: A=40V,B=20W,V0=100V
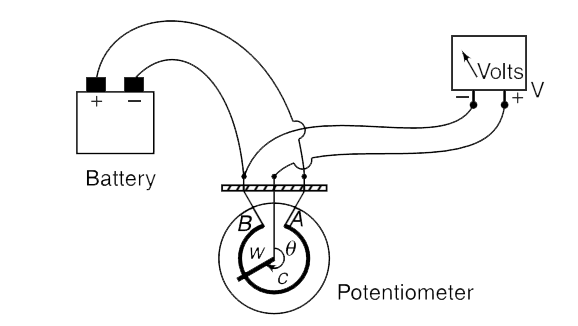
View SolutionA rotary potentiometer has a circular resistance (C) and a conducting wiper (W) can rotate over it. An ideal battery and an ideal voltmeter are connected to it as shown in the figure. As the wiper is rotated on the circular resistance the reading of the voltmeter changes from zero to 20V. What is reading of the voltmeter when wiper is at angular position θ=120∘ ? Assume that resistance C is almost a complete circle and resistance of all connecting wires and knobs in the circuit is zero.
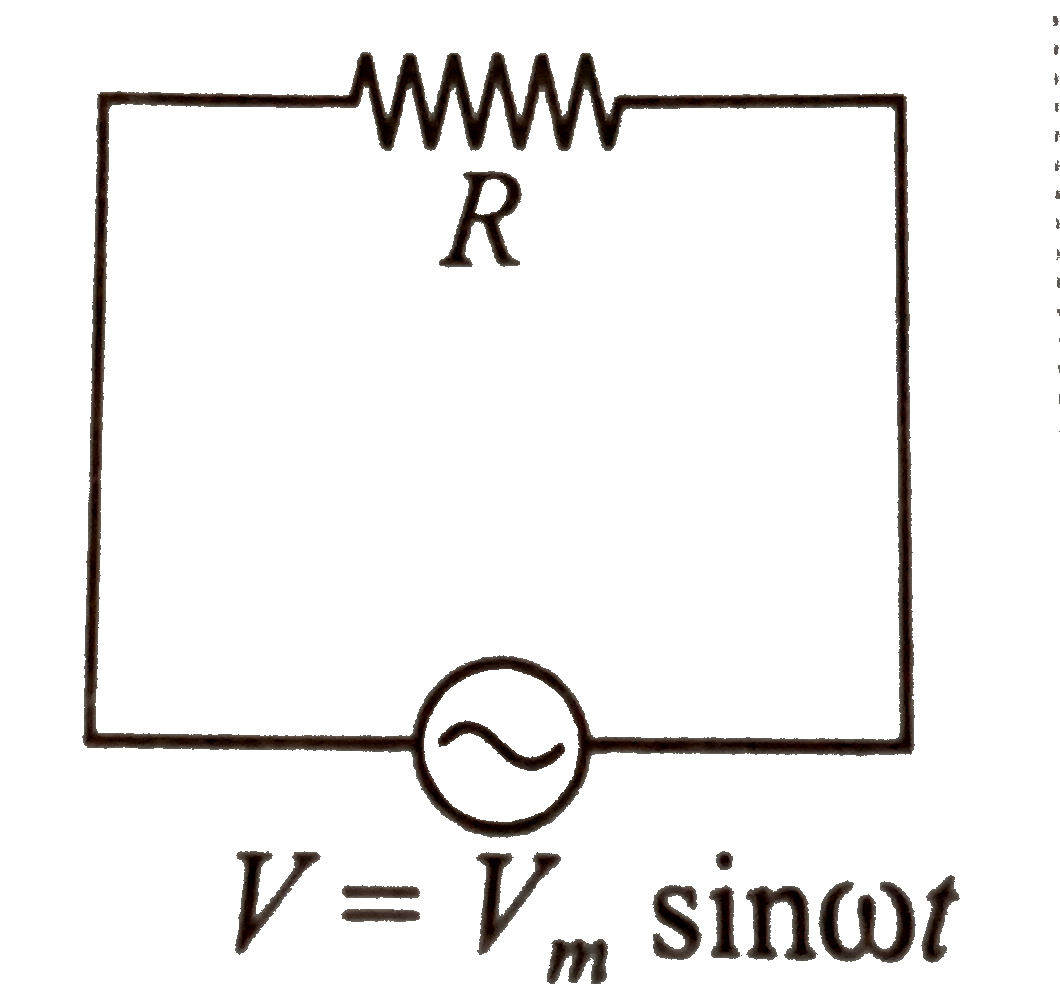
View SolutionAn ac source of voltage V=Vmsinωt is connected across the resistance R as shown in figure. The phase relation between current and voltage for this circuit is
View SolutionA students connects an ammeter A and a voltmeter V to measure a resistancer as shown in figure. If the voltmeter reads 20V and the ammeter reads 4A, then R is

View SolutionThe variation of current (I) and voltage (V) is as shown in figure A. The variation of power P with current I is best shown by which of the following graph
View Solution
