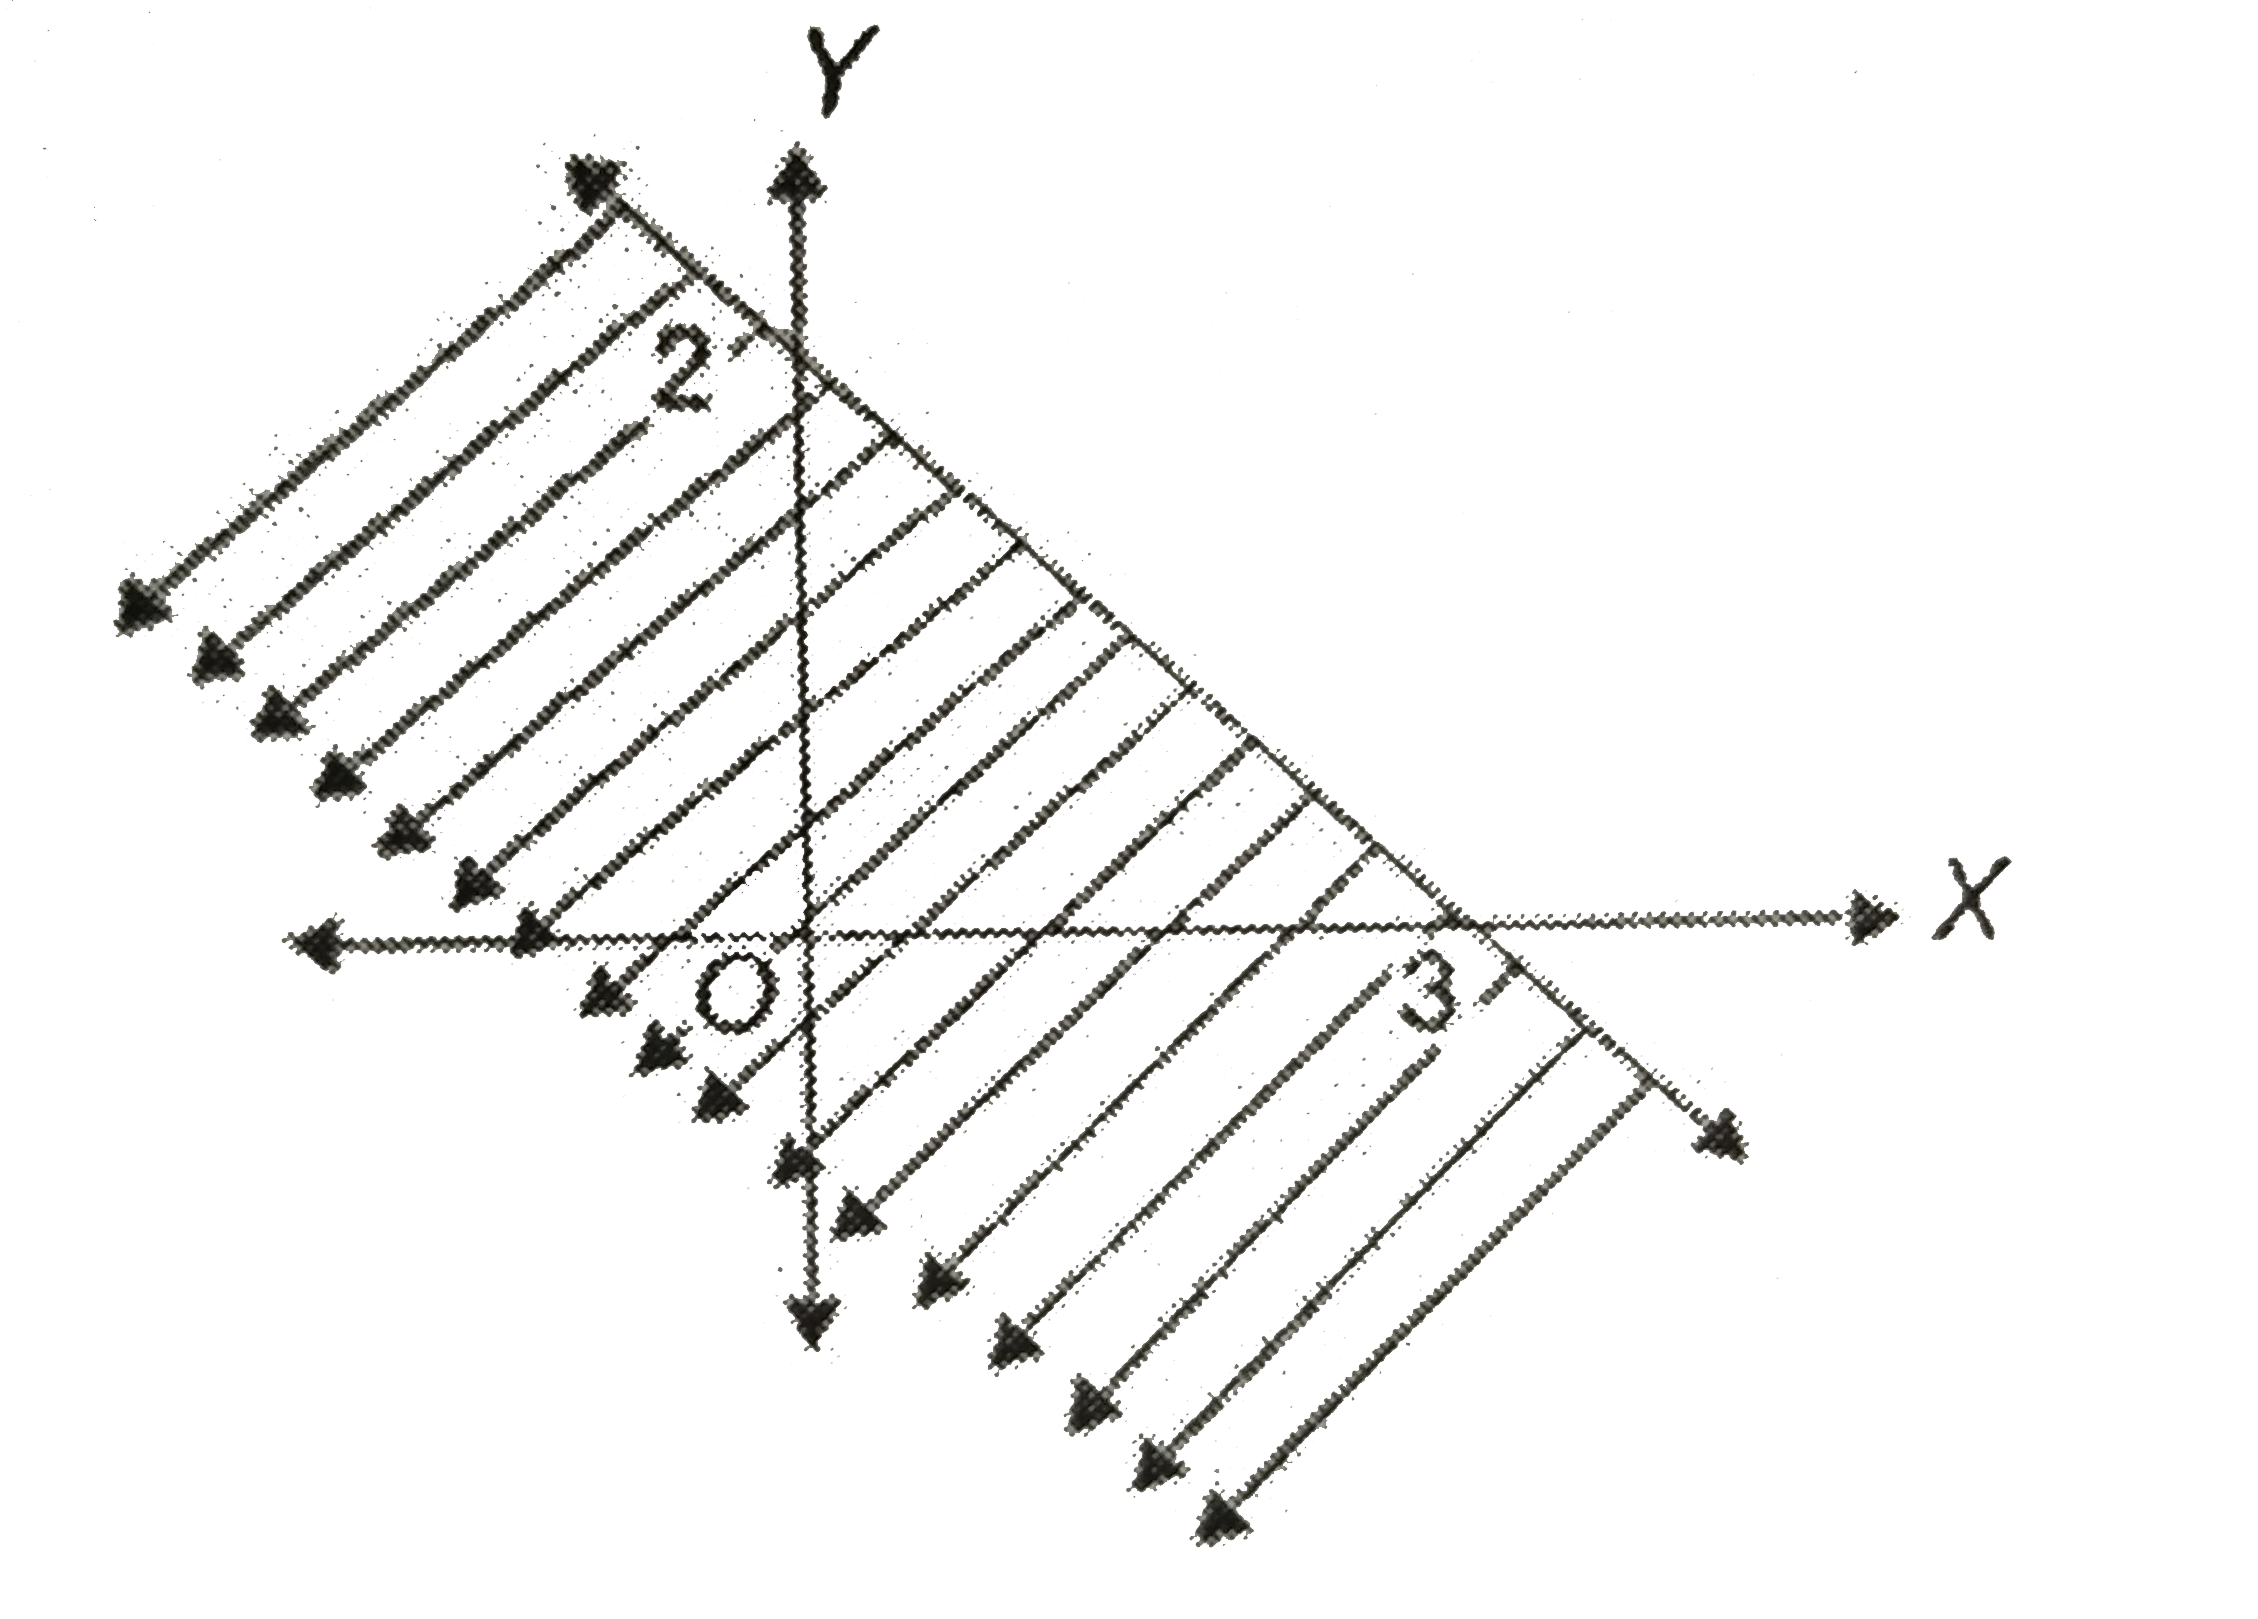
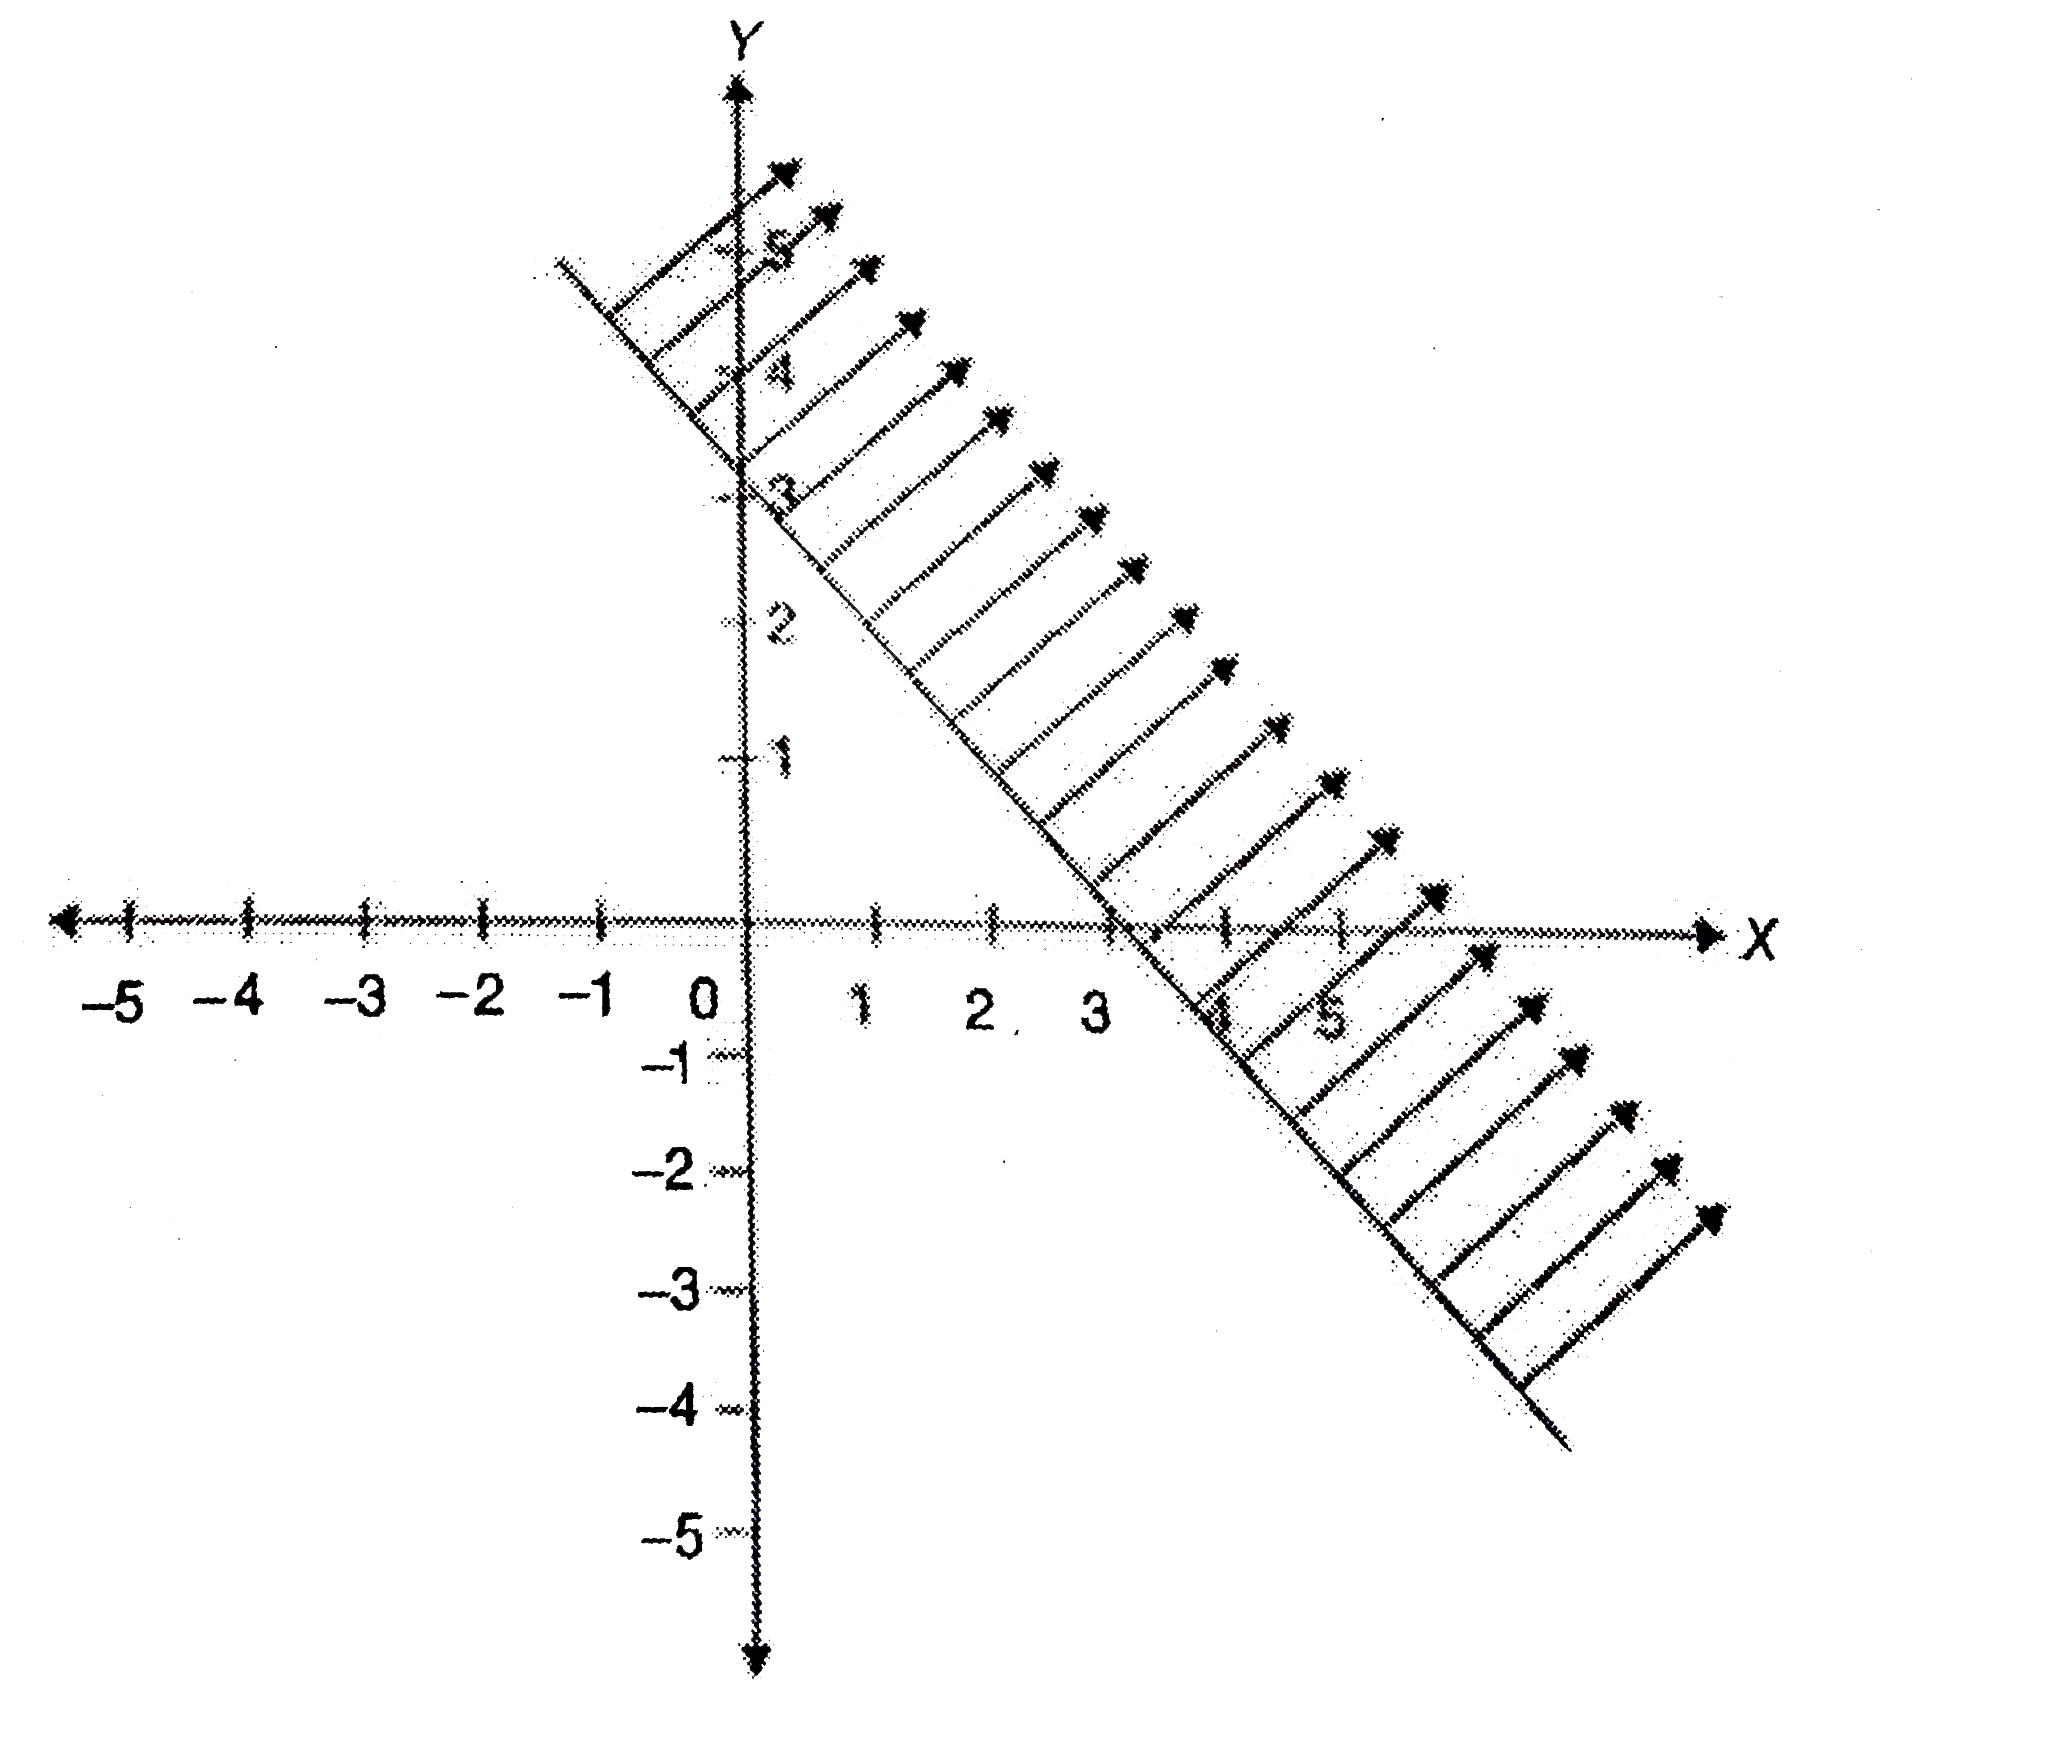
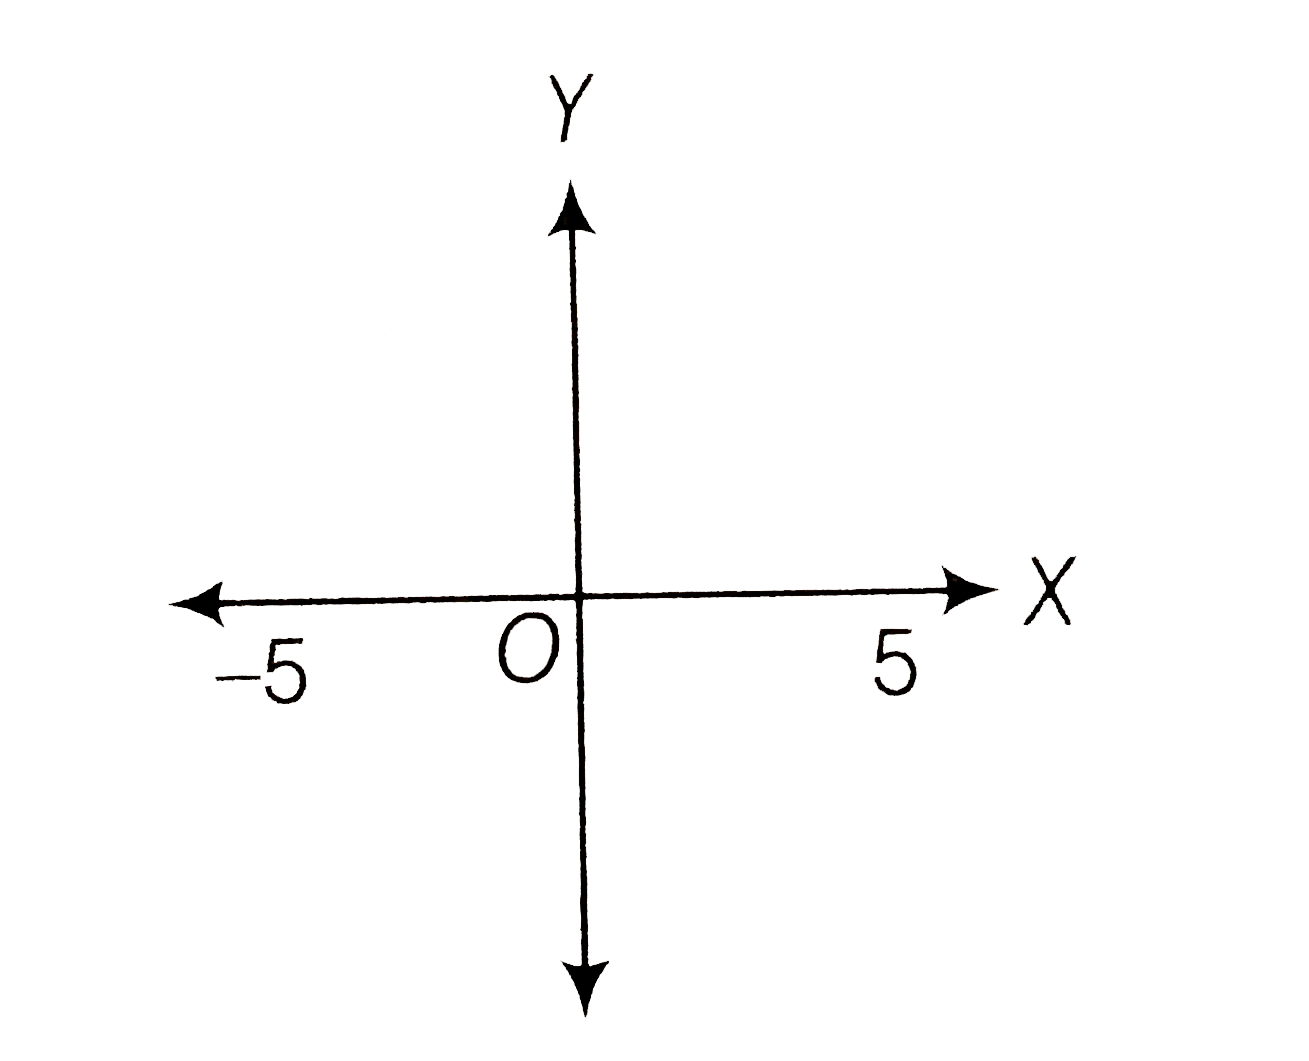
The inequality representing the following graph is
A
|x|<5
B
|x|≤5
C
|x|>5
D
|x|≥5
Video Solution
Text Solution
The correct Answer is:A
|
Answer
Step by step video & text solution for The inequality representing the following graph is by Maths experts to help you in doubts & scoring excellent marks in Class 11 exams.
Updated on:21/07/2023Similar Questions
Knowledge Check
The function represented by the following graph is
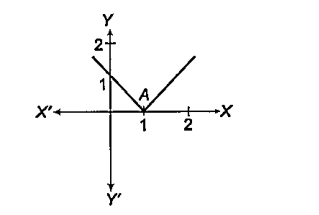 Acontinuous but not differentiable at x=1Bdifferentiable but not continuous at x=1Ccontinuous and differentiable at x=1Dneither continuous nor differentiable at x=1
Which of the following graph represents e−x?
A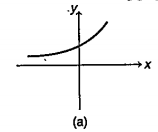 B
B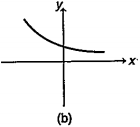 C
C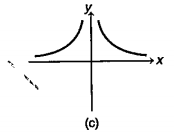 D
D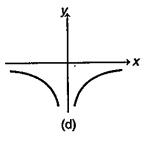
The solution of the inequality 3x+2y>6in the graph is represented by shading the
AHalf plane, which contains origin including the points on the lineBHalf plane , which does not contain origin excluding the points on the lineCHalf plane, which does not contain origin including the point on the lineDHalf plane, which contain origin excluding the points on the line
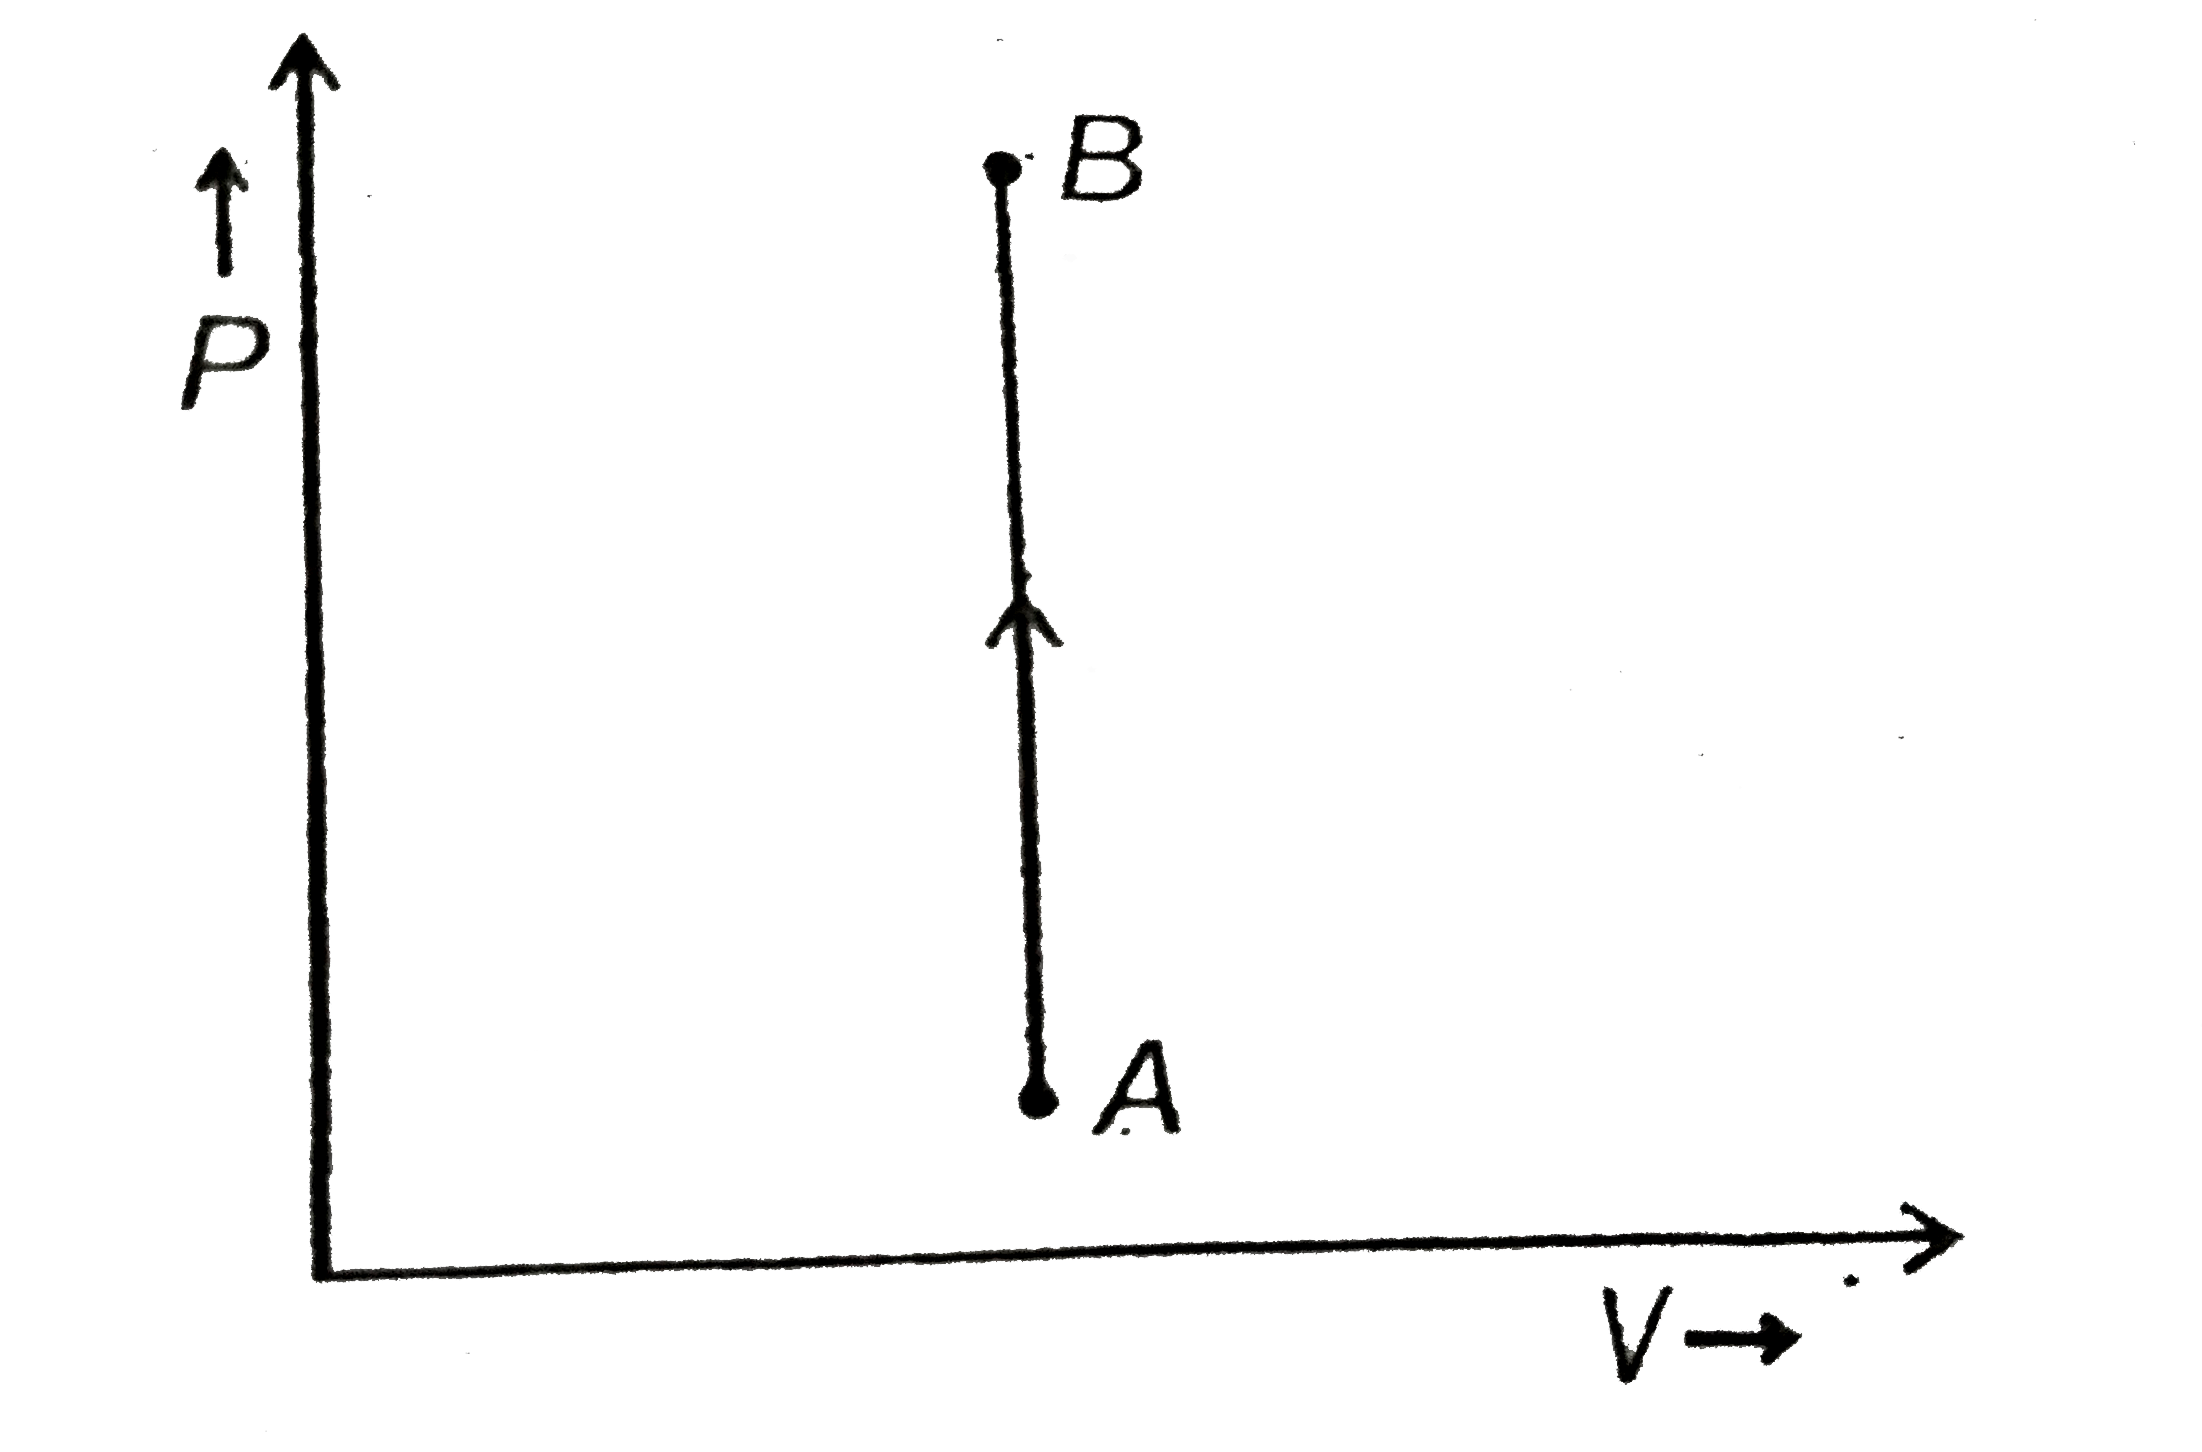
The following graph represents
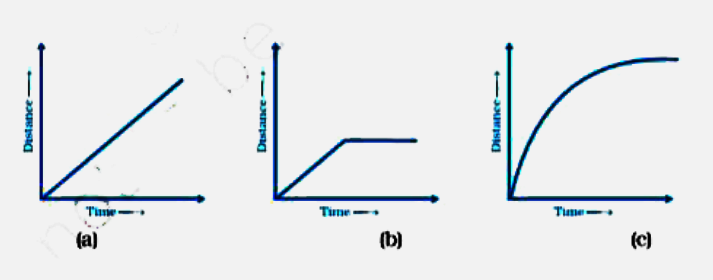
View SolutionExplain the situations represented by the following distance-time graphs :

View SolutionExplain the situations represented by the following distance-time graphs.
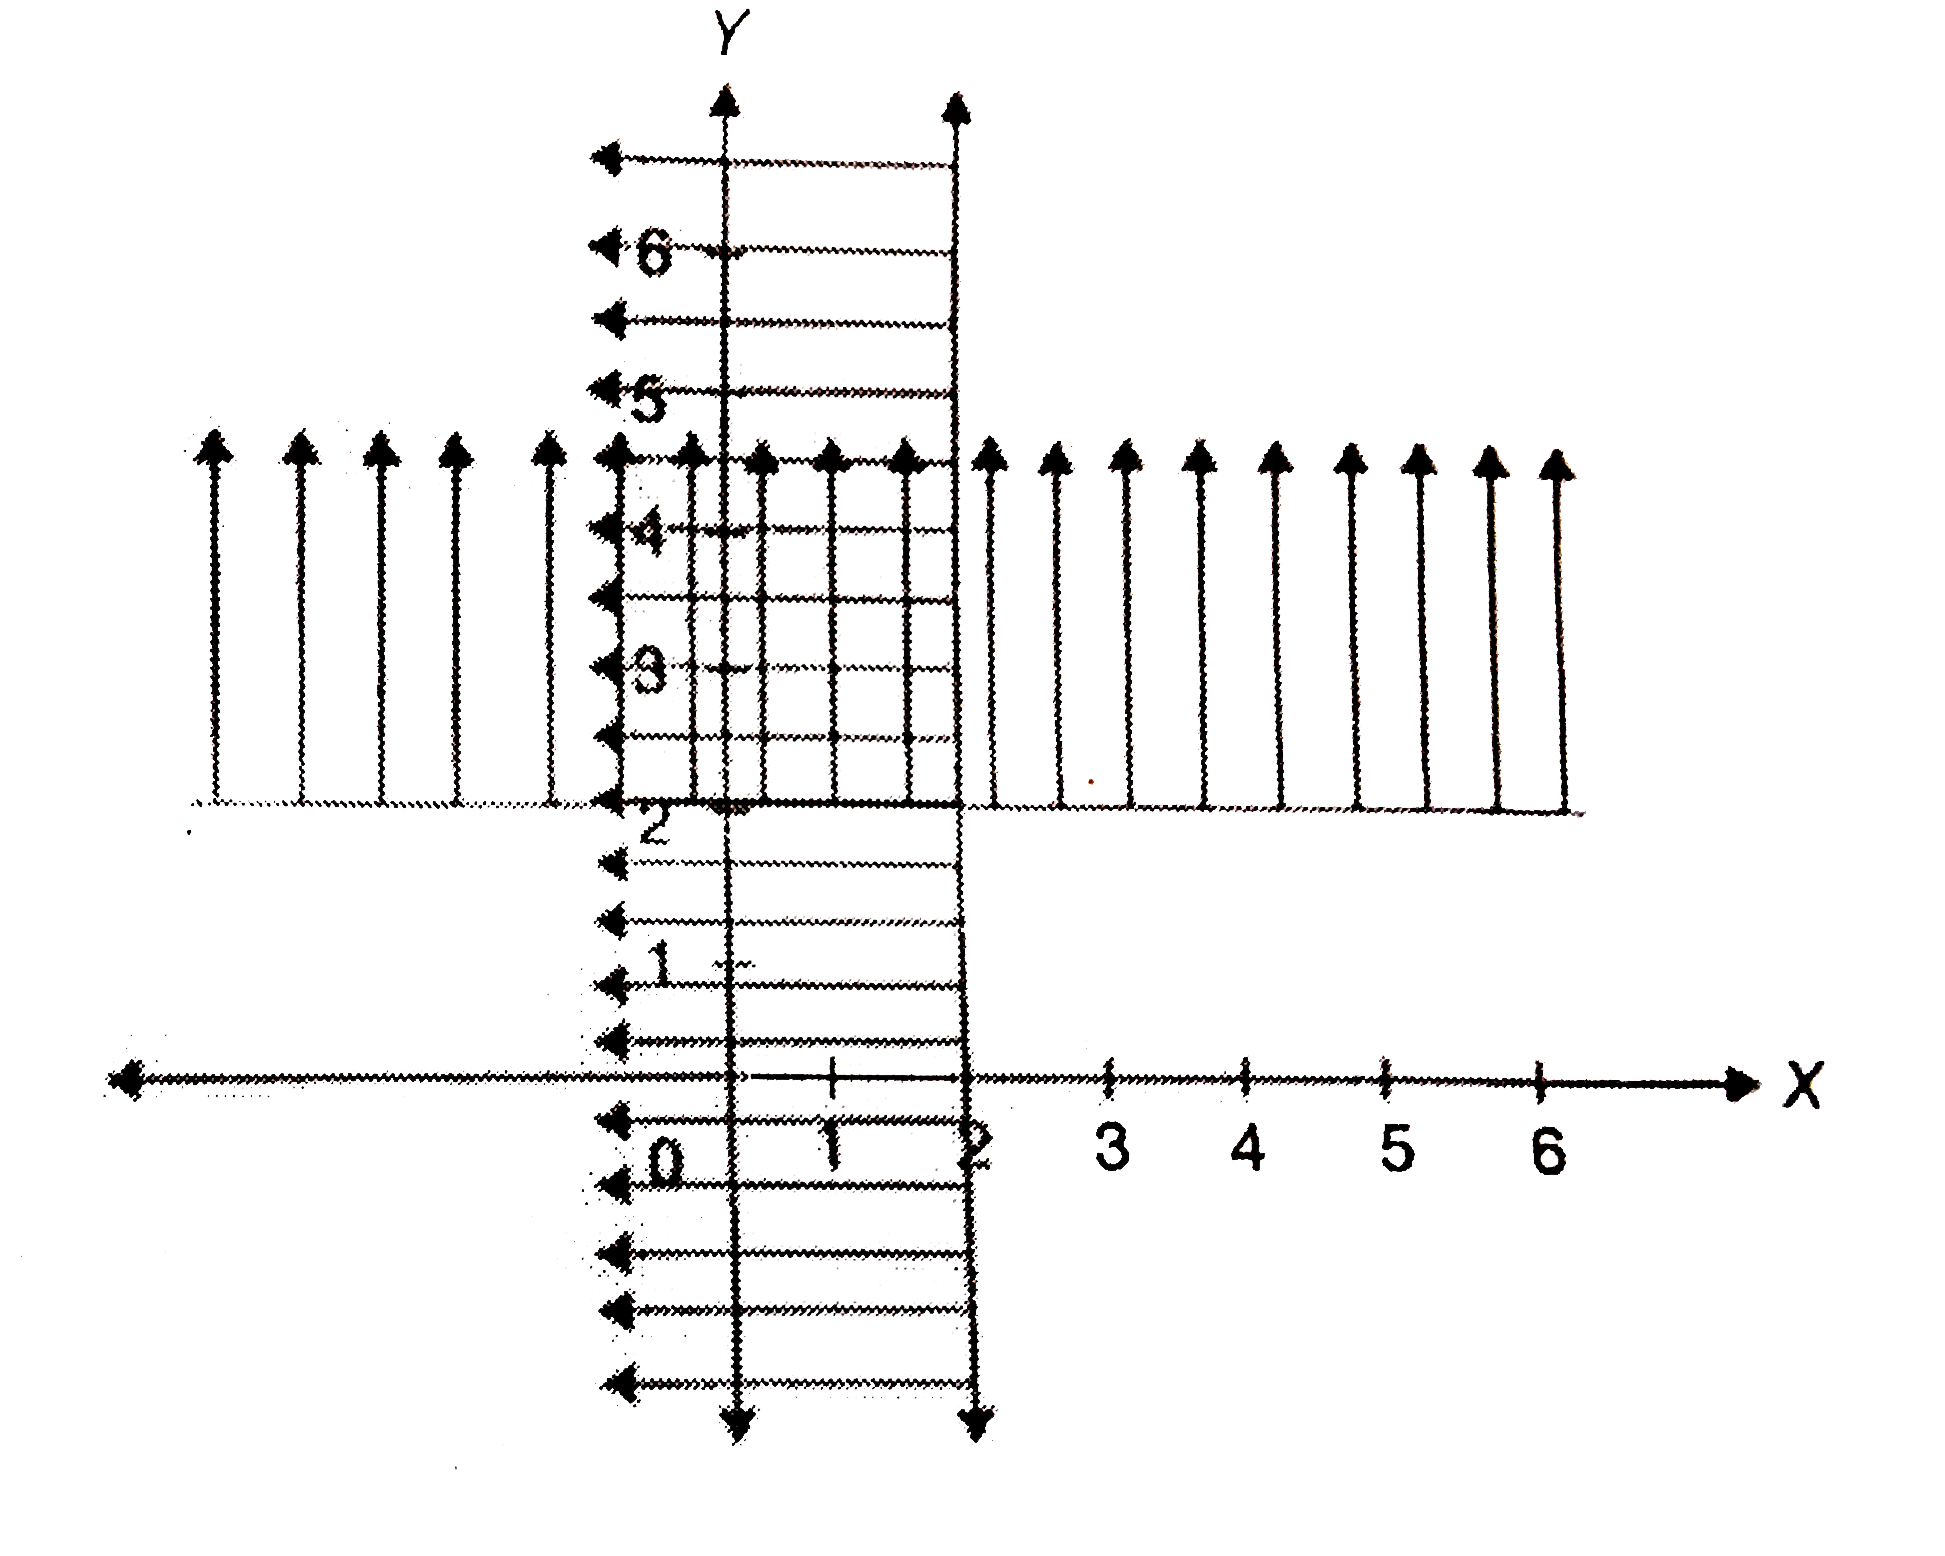
View SolutionInequations that represents the shaded region of the following graph is ____
View SolutionRepresent the following inequations graphically
View Solution

