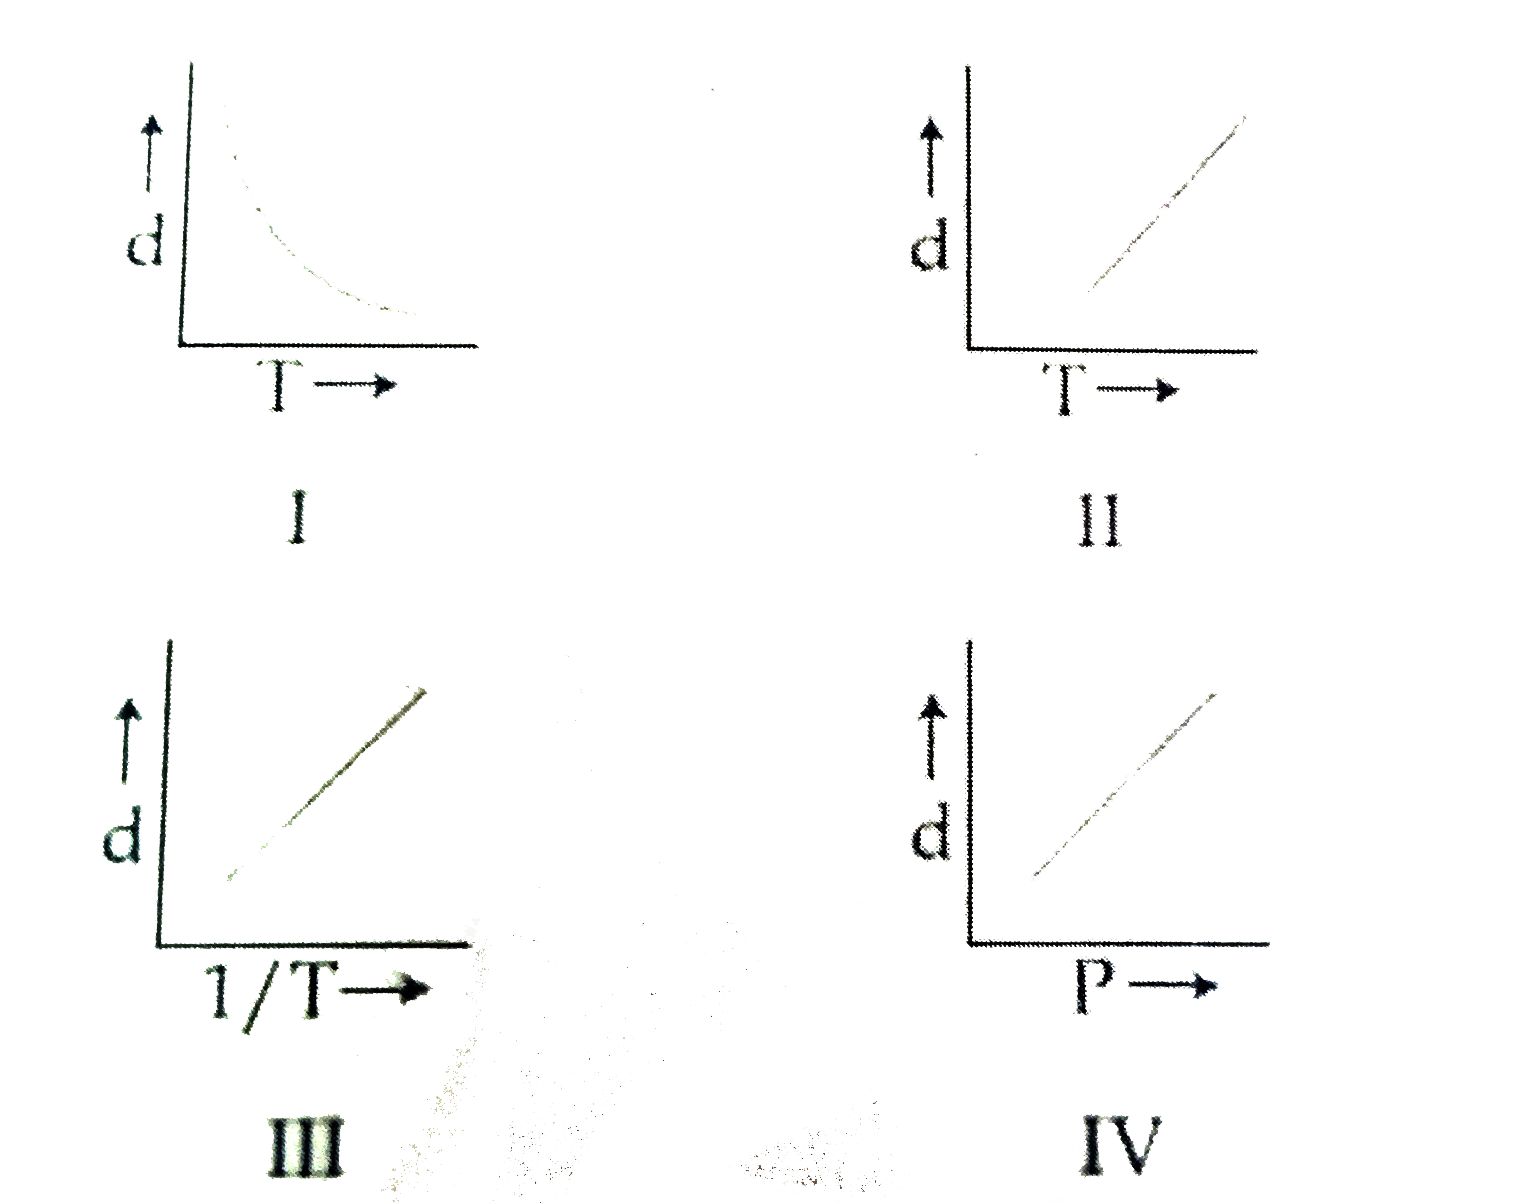
Which one of the following is the correct PV vs P plot at constant temperature for an ideal gas ? (P and V stand for pressure and volume of the gas respectively)
A

B

C

D

Video Solution
Text Solution
The correct Answer is:A
According to Boyle.s law P∝1V (at const ,n ,T)
PV = constant
∴

|
Similar Questions
Knowledge Check
Which of the following is a correct plot of the volume of fixed amount of ideal gas as a function of temperature (at constant pressure)
A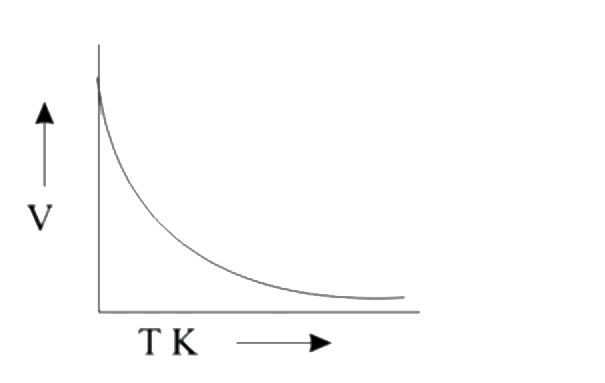 B
B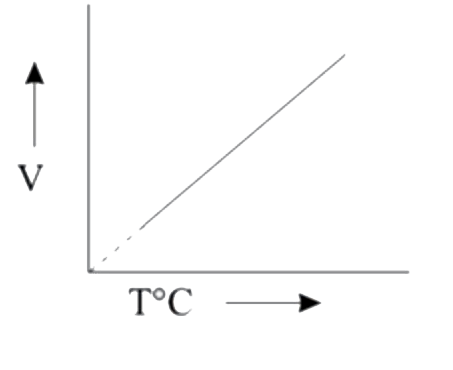 C
C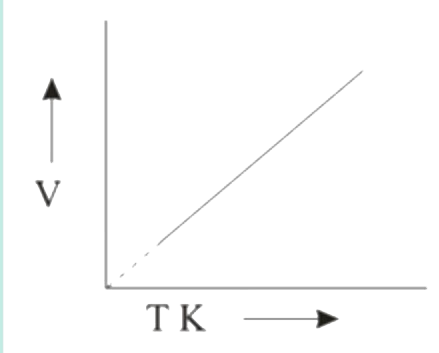 D
D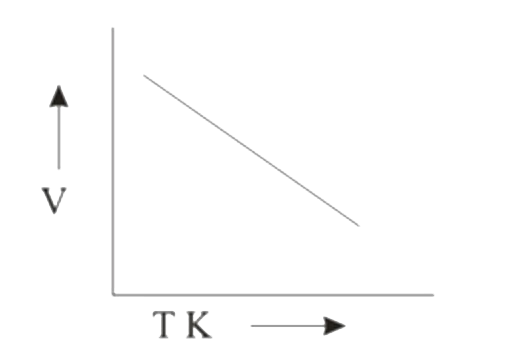
Which one of the following volume (V)- temperature (T) plots represents the behaviour of one mole of an ideal gas at one atmosphere?
A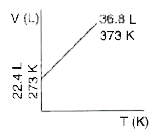 B
B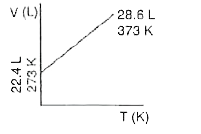 C
C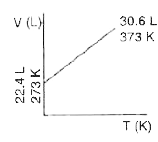 D
D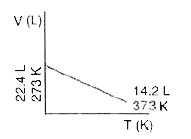
Which of the following volume-temperature (V−I) plots represents the behaviour of 1mole of an ideal gas at the atmospheric pressure?
A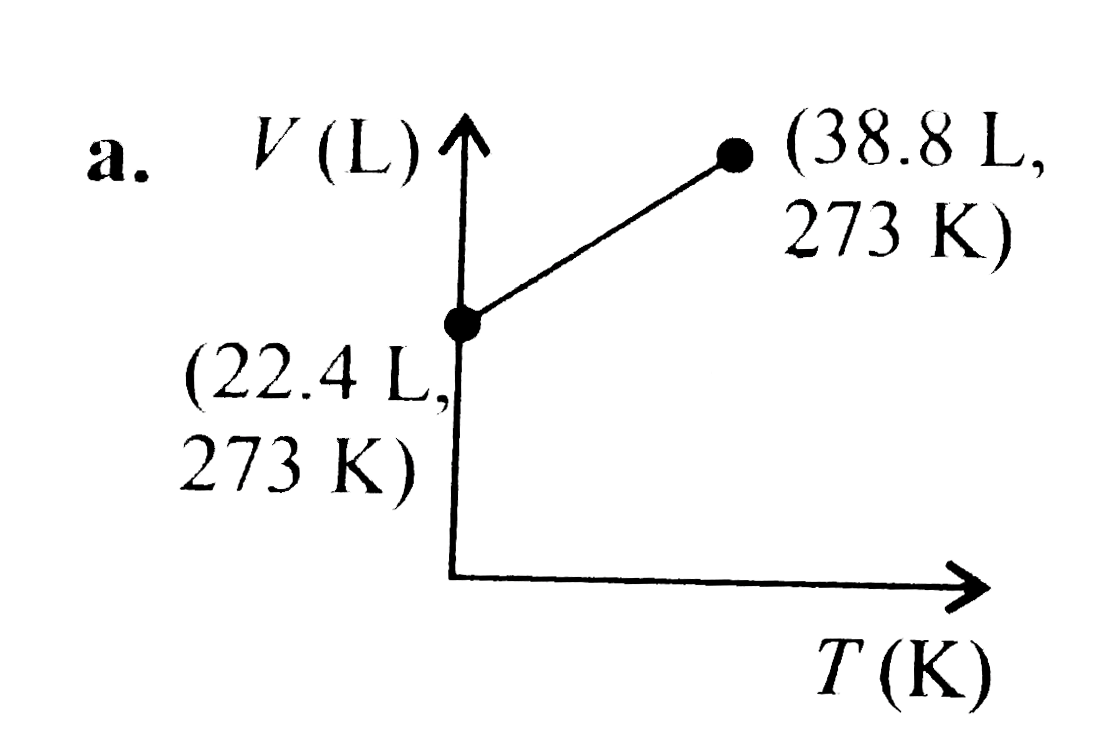 B
B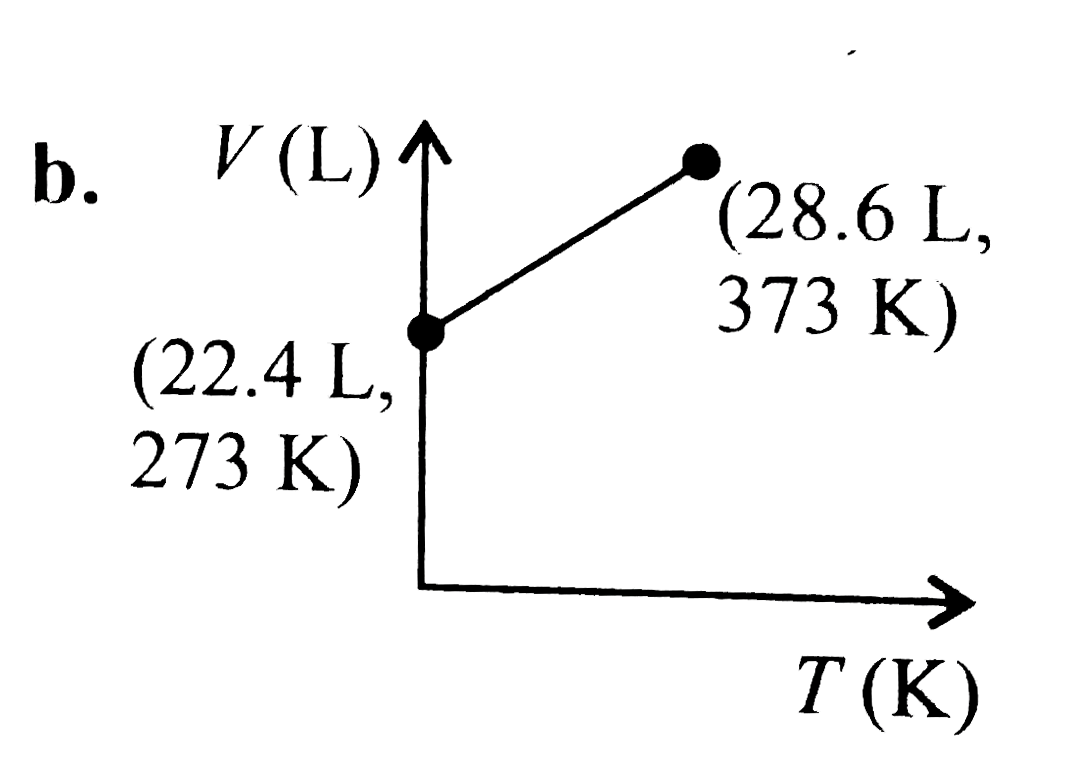 C
C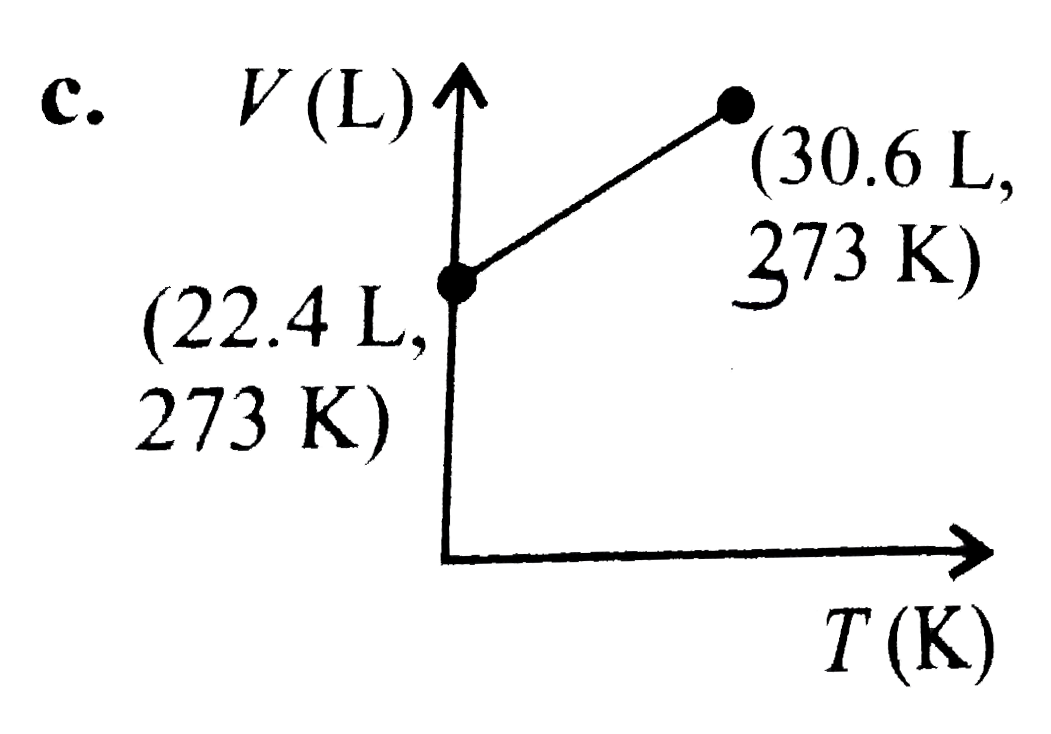 D
D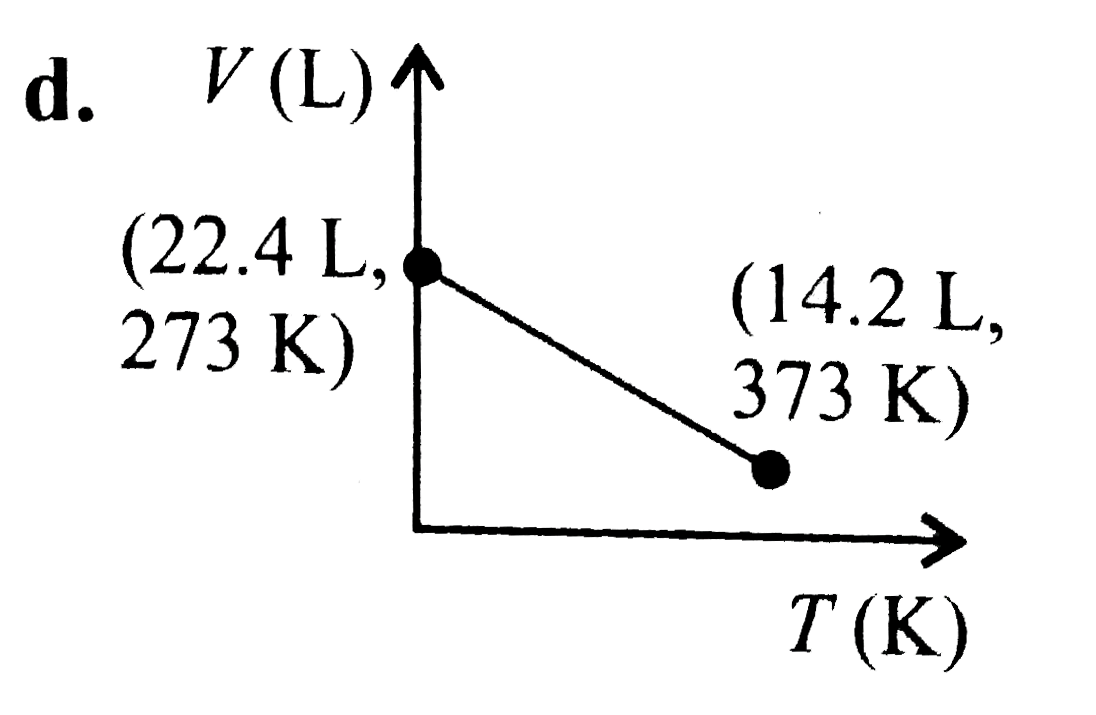
The plot of PV vs P at particular temperature is called isovbar.
View SolutionWhat is the nature of curve by plotting P against PV at constant temperature for a gas ? What is the name assigned to this curve ?
View SolutionAt low pressure, the graph of PVvs1V for a given amount at a constant temperature for a real gas is:
View SolutionWhich of the following volume-temperature (V−I) plots represents the behaviour of 1mole of an ideal gas at the atmospheric pressure?
View SolutionWhich one of the following volume (V)- temperature (T) plots represents the behaviour of one mole of an ideal gas at one atmosphere?
View Solution

