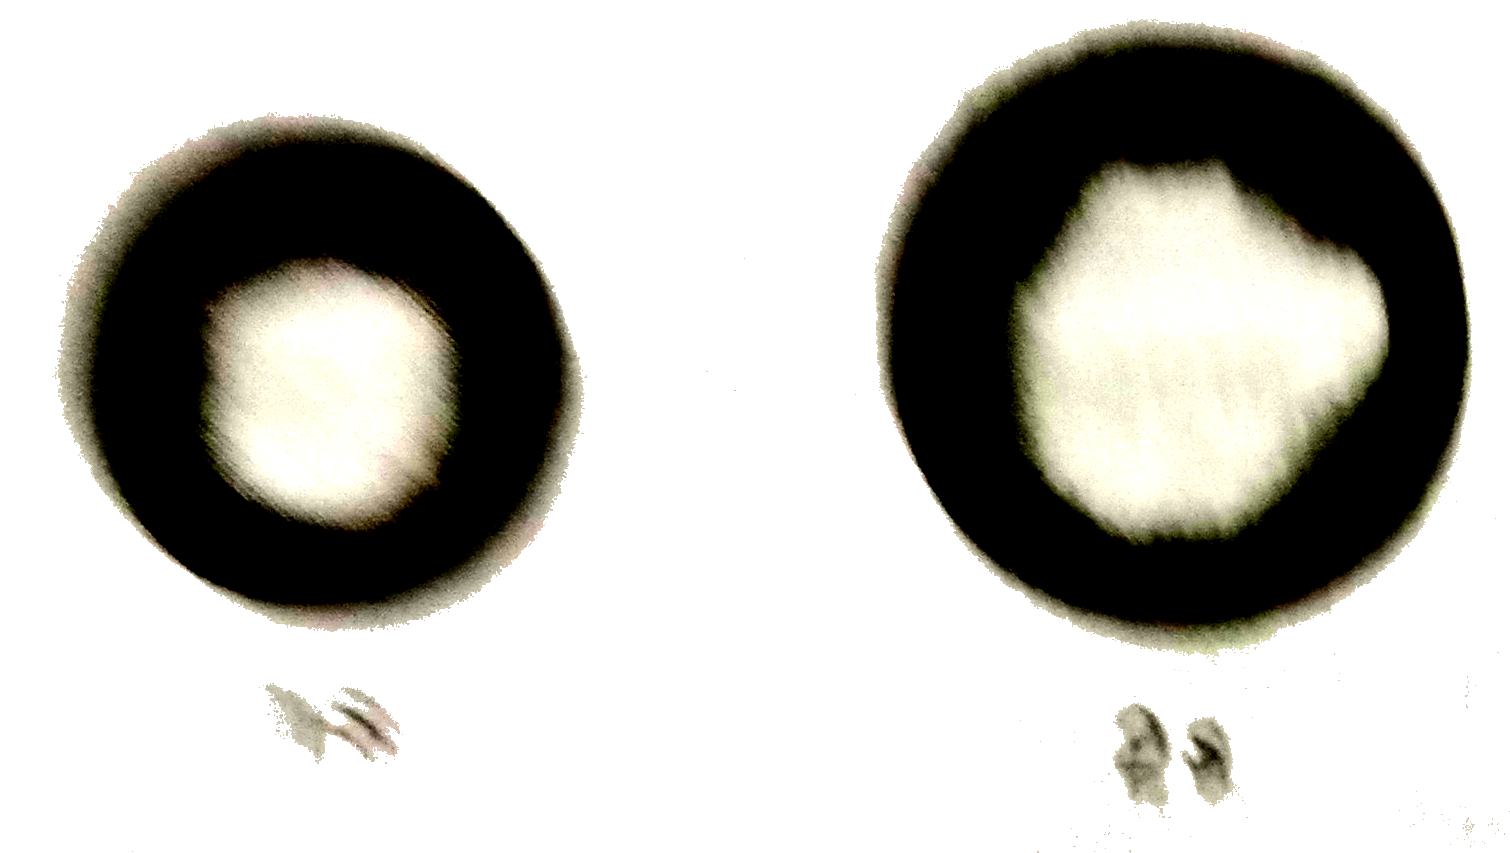
The probability density plots of 1 s and 2s orbitals are given in figure.

The density of dots in a region represetns the probability density of finding electrons in the region. On the basis of above diagram which of the following statements is incorrect?
A
1s and 2s orbitals are spherical in shape
B
The probability of finding the electron is maximum near the nucleus
C
The probability of finding the electron at a given distance is equal in all directions
D
The probability density of electrons for 2s orbital decreases uniformly as distance from the nucleus increases
Video Solution
Text Solution
The correct Answer is:D
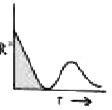
The probability density of electrons in 2s orbital first increases then decreases and after that it begins to increases again as distance increases from nucleus.
|
Similar Questions
Knowledge Check
The probability density curve for 2s electron appears like
A B
B C
C D
D
The probability density curve for 2s electron appears like
A B
B C
C D
D
The density of water is 1000kg/m3 and the density of copper is 8900kg/m3. Which of the following statements is incorrect ?
A(a)=The density of a certain volume of copperThe density of the same volume of water=8.9B(a)=The density of a certain volume of copperThe density of the same volume of water=8.9C(a)=The density of a certain volume of copperThe density of the same volume of water=8.9D(a)=The density of a certain volume of copperThe density of the same volume of water=8.9
Probability density curve for 3s orbital
View SolutionWhich of the following orbitals will have zero probability of finding the electron in the yz plane ?
View SolutionThe region where probability density function reduces to zero is called
View SolutionThe electron density between 1s and 2s is
View SolutionWhich of the following statements is wrong? The probability of finding the electron in px orbital is
View Solution
