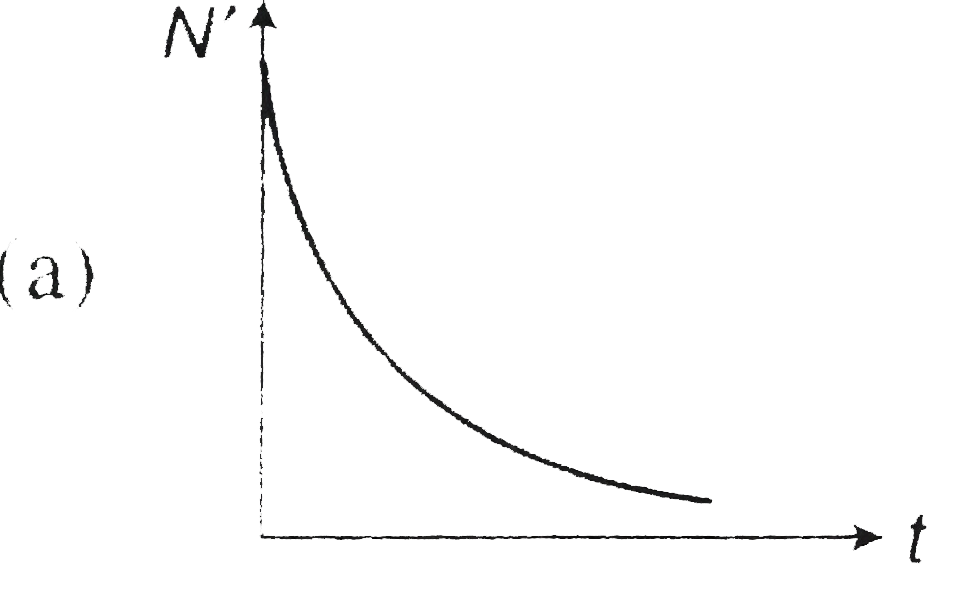
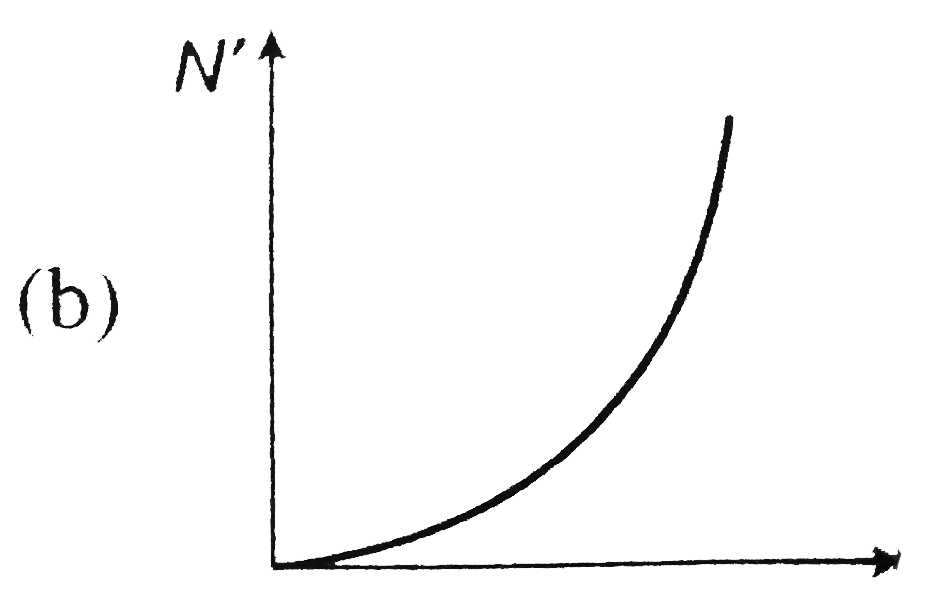
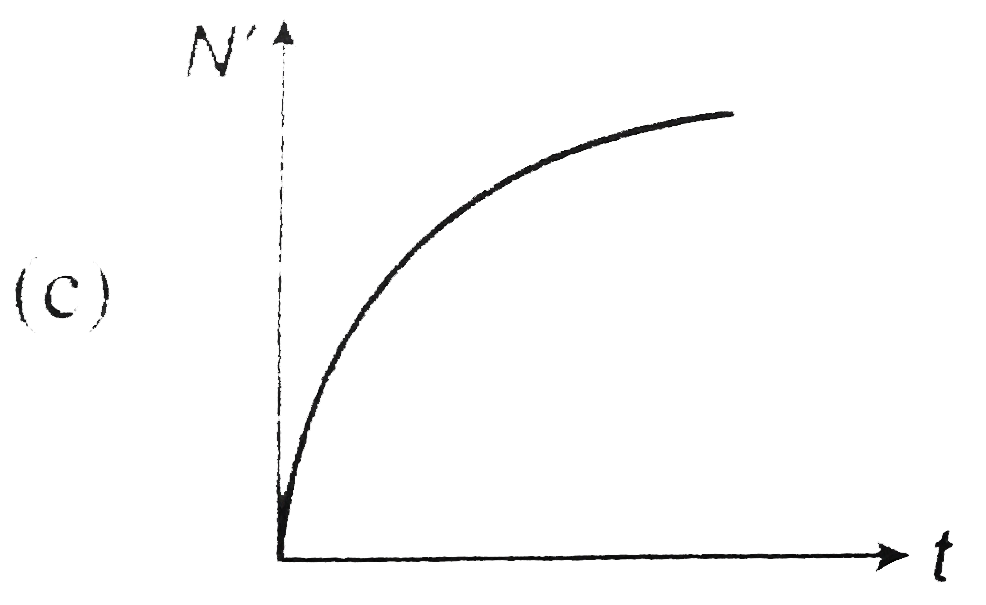
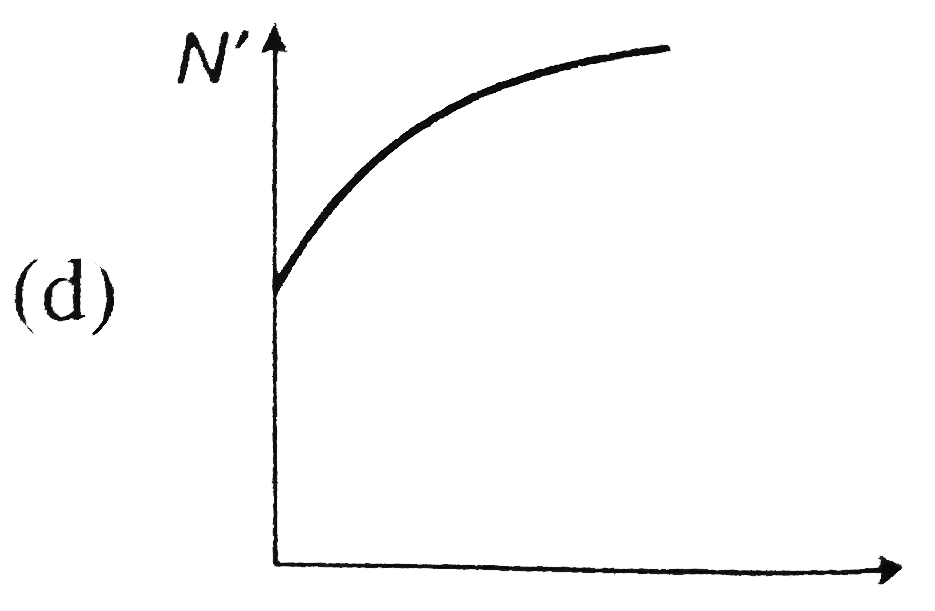
The plot of the number (N) of decayed atoms versus activity (R) of a radioactive substance is


The correct Answer is:D
Ndecayed=N0−N=N0−Aλ
Similar Questions
Knowledge Check
- Question 1 - Select One
99% quantity of a radioactive substance decays between
A8 and 9 half livesB7 and 8 half livesC9 and 10 half livesD6 and 7 half lives - Question 2 - Select One
The graph between number of decayed atoms N' of a radioactive element and time t is.
A .B
.B .C
.C .D
.D .
. - Question 3 - Select One
The relationship between decay constant λ and half-life T of a radioactive substance is
Aλ=log102TBλ=loge2TCλ=log210TDλ=log2eT
State the law of radioactive decay.
Plot a graph showing the number (N) of undecayed nuclei as a function of time (t) for a given radioactive sample having half-life T12.
Depict in the plot the number of undecayed nuclei at (i) t=T12 and (ii) t=5T12.View SolutionState the law of radioactive decay. Plot a graph showing the number (N) of undecayed nuclei as a function of time (t) for a given radioactive sample having half life T1/2
Depict in the plot the number of undecayed nuclei at
(i) t=3T1/2 and (ii) t=5T1/2.View SolutionHalf-life of a radioactive substance is T. At time t_1 activity of a radioactive substance is R1 and at time t2 it is R2. Find the number of nuclei decayed in this interval of time.
View SolutionState the laws of radioactive decay. Define the term 'decay constant' for a radioactive substance.
View SolutionThe half-life of a radioactive substance is 30 minutes, The time (in minutes) taken between 40% decay and 85% decay of the same radioactive substance is.
View Solution
