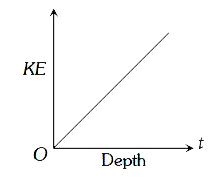
Which of the diagrams in figure, correctly shows the change in kinetic energy of an iron sphere falling freely in a lake having sufficient depth to impart if a terminal velocity ?


The correct Answer is:B
First velocity of the iron sphere increases and after sometime becomes constant, called terminal velocity. Hence, accordingly first KE increases and then becomes constant which is best represented by (b).
Similar Questions
. A raindrop falling from a height .h. above ground, attains a near terminal velocity when it has fallen through a height (3/4)h. Which of the diagrams shown below correctly shows the change in kinetic and potential energy of the drop during its fall up to the ground?
View Solution40. Which of the diagrams correctly shows the change in kinetic energy of an iron sphere falling freely in a lake having sufficient depth to impart it a terminal velocity ?
View SolutionA raindrop falling from a height h above ground , attains a near terminal velocity when it has fallen through a height (3/4) h . Which f the diagrams shown in figure correctly shows the change in kinetic and potential energy of the drop during its fall up to the ground ?
View SolutionWhich of the diagrams in figure correctly shows the change in kinetic energy of an iron sphere falling freely in a lake having sufficient depth to impart it a terminal velocity ?
View SolutionA raindrop falling from a height h above ground, attains a near terminal velocity when it has fallen through a height (3//4)h . Which of the diagrams shown in figure correctly shows the change in kinetic and potential energy of the drop during its fall up to the ground ?
View SolutionWhich of the diagrams in figure, correctly shows the change in kinetic energy of an iron sphere falling freely in a lake having sufficient depth to impart if a terminal velocity ?
View SolutionA raindrop falling from a height 'h' above ground, attains a near terminal velocity when it has fallen through a height (3/4)h. Which of the diagrams shown below correctly shows the change in kinetic and potential energy of the drop during it fall up the ground ?
View SolutionWhich of the diagrams correctly shows the change in kinetic energy of an iron sphere falling freely in a lake having sufficient depth to impart it a terminal velocity ?
View Solution
