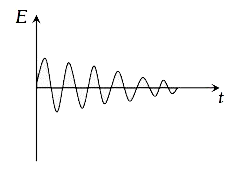
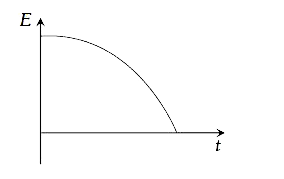
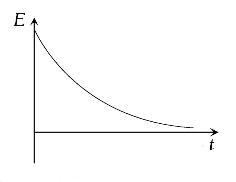
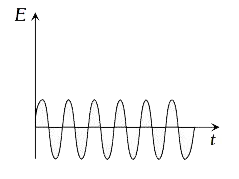
Which of the diagram shown in figures respresents variation of total mechanical energy of a pendulam oscillation in air as function of time?


The correct Answer is:C
When a pendulum oscillates in air, it will lose energy continuously in overcoming resistance due to air. Therefore, total mechanical energy of the pendulum decreases continuously with time.
The variation is correctly represented by curve (c).
Similar Questions
चित्र में दर्शाए गए आरेखों में से कौन-सा आरेख वायु में दोलन करते हुए किसी लोलक की कुल यांत्रिक ऊर्जा में समय के साथ होने वाले परिवर्तन का सही निरुपण करता है?
View SolutionWhich of the diagram shown in figure represents variation of total mechanical energy of a pendulum oscillating in air as function of time?
View SolutionWhich of the diagram shown in figures respresents variation of total mechanical energy of a pendulam oscillation in air as function of time?
View Solutionचित्र में दर्शाए गए आरेखों में से कौन-सा आरेख वायु में दोलन करते हुए किसी लोलक की कुल यांत्रिक ऊर्जा में समय के साथ होने वाले परिवर्तन का सही निरूपण करता है?
View SolutionThe velocity-time diagram of a harmonic oscillator is shown in the adjoining figure . The frequency of oscillation is
View SolutionThe velocity-time diagram of a harmonic oscillator is shown in the adjoining figure. The frequency of oscillation is
View SolutionThe variation of potential energy of harmonic oscillator is as shown in figure. The spring constant is
View SolutionDraw a diagram to show the energy changes in an oscillating simple pendulum. Indicate in your diagram how the total mechanical energy in it remains constant during the oscillation.
View Solution
