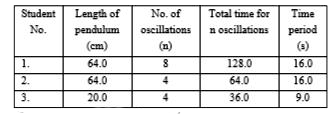
Three students perform an experiment for determining the acceleration due to gravity (g) using a simple pendulum. They use different lengths of pendulum and record time for different number of oscillations. The observations are as shown in the table.

(Least count of length = 0.1 m least count for time = 0.1 s)
If are the percentage errors in 'g' for students 1, 2 and 3 respectively, then the minimum percentage error is obtained by student no._____.
The correct Answer is:1
Similar Questions
A student uses a simple pendulum of exactly 1 m length to determine g, the acceleration due to gravity. He uses a stop watch with the least count of 1 s for this and records 40 s for 20 oscillations. For this observation, which of the following statements is true?
View SolutionStudent I,II,andIII perform an experiment for measuring the acceleration due to gravity (g) usinf a simple pendulum. They use lengths of the pendulum and // or record time for different number of oscillations . The observations are shown in the following table . Least count for length =0.1cm
StudentIIIIIILength of Pendulam(cm)64.064.020.0Number ofn Oscillation(n)844TimePeriod(s)16.016.09.0
Least count for time =0.1s.
If EI,EII , and EIII are the percentage errors in g , i.,e., (Δgg×100) for students I,II , and III, respectively , then04:41View SolutionStudent I,II and III perform an experiment for measuring the acceleration due to gravity (g) using a simple pendulum. They use different lengths of the pendulum and /or record time for different number of oscillations. The observation are shown in the table. Least count for length =0.1 cm. least count for time =0.1s If E_(1) and E_(II) and E_(III) are the percentage errors in g, i.e. ((Deltag)/gxx100) for students I,II and III respectively.
View SolutionStudents I_(1),J_(1), J_(3) and I_(2) perform an experiment for measuring the acceleration due to gravity (g) using a simple predulum, they use different lengths of the pendulum and record time for different number of oscillations. The observations are shown in the table. Least count for length = 0.1 cm , least count for time = 1s {:("Students",underset("pendulum (cm)")("Length of the"),underset("oscillations(n)")("No.of"),underset("of pendulum (s)")("Time period")),(I_(1),100.0,20,20),(J_(1),400.0,10,40),(J_(1),100.0,10,20),(I_(1),400.0,20,40):} If P_(1),P_(2),P_(3) and P_(4) are the % error in g for students I_(1),J_(1),J_(3) and I_(2) respectively then -
05:19View SolutionIn an experiment to determine acceleration due to gravity, the length of the pendulum is measured as 98 cm be a scale of least count of 1 cm. The period of swing/oscillations is measured with the help of a stop watch having a least count of 1s. The time period of 50 oscillation is found to be 98 s. Express value of g with proper error limits.
06:27View SolutionStudents J_(1) , J_(2) , J_(3) and J_(4) perform an experiment for measuring the acceleration due to gravity (g) using a simple pendulum, they use different lengths of the pendulum and record time for different number of oscillations. The observations are shown in the table. Least count for length = 0.1 cm , least count for time = 1s {:("Students",underset("pendulum (cm)")("Length of the"),underset("oscillations(n)")("No.of"),underset("of pendulum (s)")("Time period")),(I_(1),100.0,20,20),(J_(1),400.0,10,40),(J_(1),100.0,10,20),(I_(1),400.0,20,40):} If P_(1),P_(2),P_(3) and P_(4) are the % error in g for students J_(1) , J_(2) , J_(3) and J_(4) respectively then -
03:48View SolutionIn an experiment to determine acceleration due to gravity, the length of the pendulum is measured as 98 cm be a scale of least count of 1 cm. The period of swing/oscillations is measured with the help of a stop watch having a least count of 1s. The time period of 50 oscillation is found to be 98 s. Express value of g with proper error limits.
05:09View SolutionThree students S1,S2andS3 perform an experiment for determining the acceleration due to gravity (g) using a simple pendulum. They use different lengths of pendulum and record time for different number of oscillations. The observations are as shown in the table.

(Least count of length = 0.1 m least count for time = 0.1 s)
If E1,E2andE3 are the percentage errors in 'g' for students 1, 2 and 3 respectively, then the minimum percentage error is obtained by student no._____.03:46View Solution

