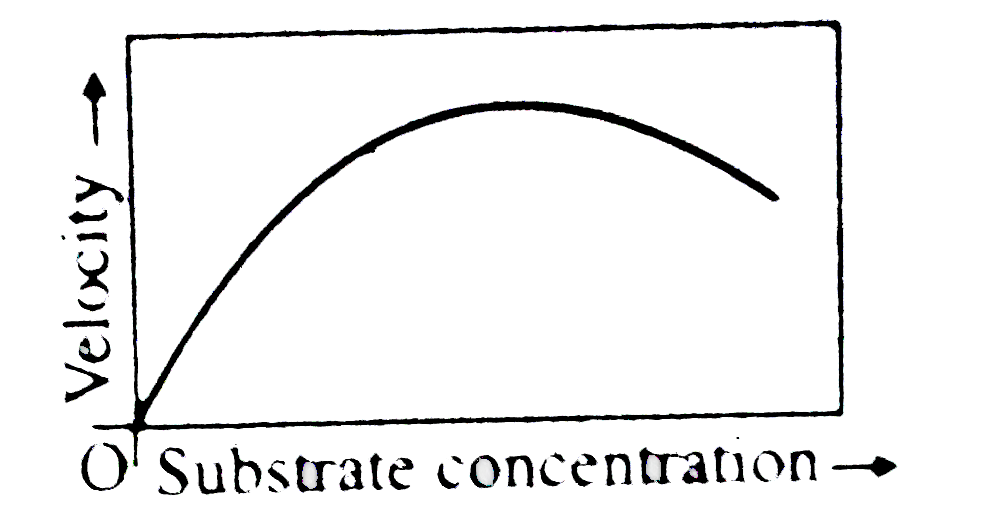
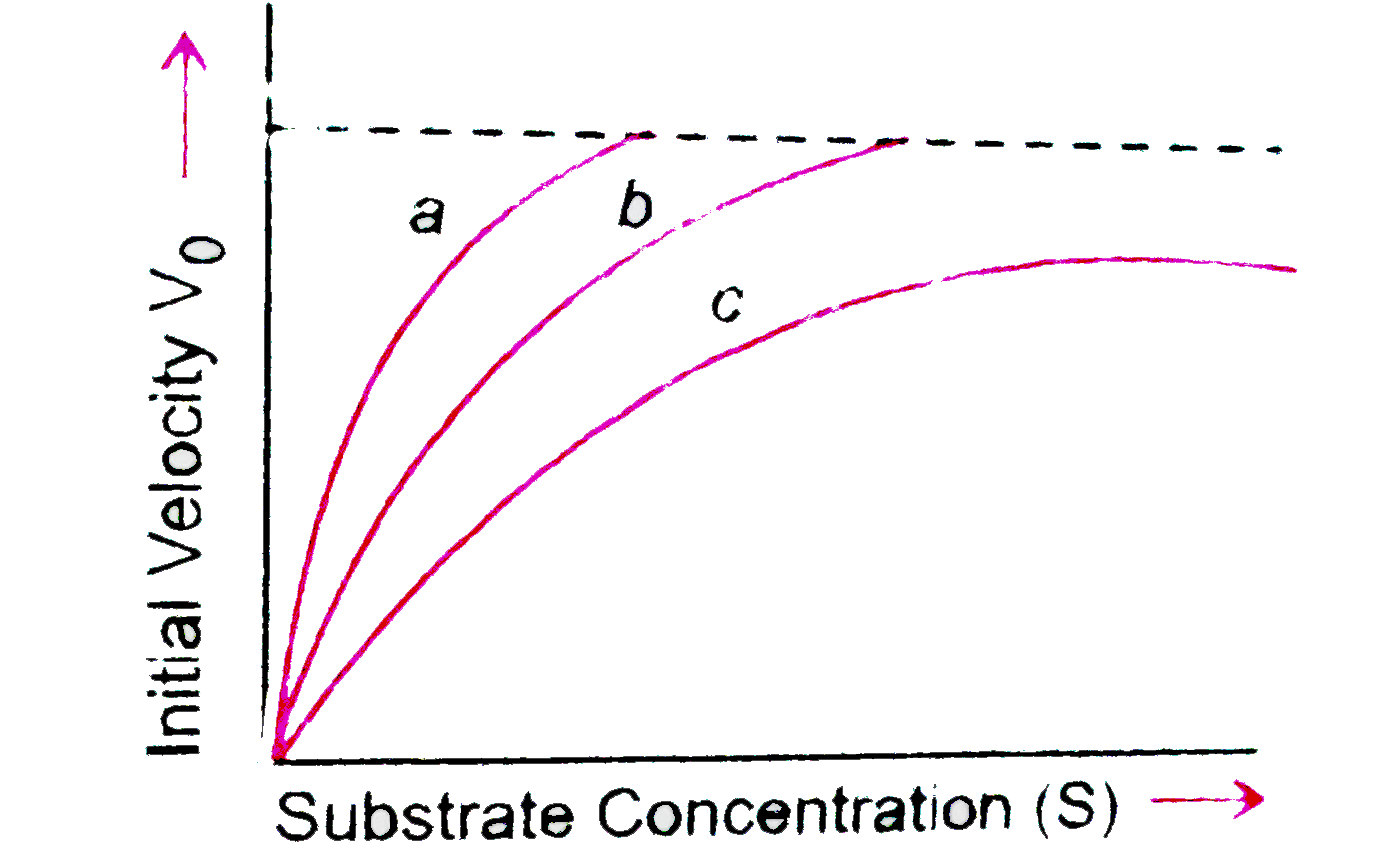
The given graph shows the effect of substrate concentration on the rate of reaction of the enzyme green gram-phosphatase

What dose the graph indicate
The rate of the enzyme reaction is directly proportional to the substrate concentration
Presence of an enzyme inhibitor in the reaction mixture
Formation of an enzyme-substrate complex
At higher substrate concentration the pH increase
The correct Answer is:B
Presence of inhibitor slows down the enzymatic activity in the response to competitive inhibition
Similar Questions
The given graph shows the effect of substrate concentration on the rate of reaction of the enzyme green-gram-phosphatase What does the graph indicate?
View SolutionThe given graph shows the effect of substrate concentration on the rate of reaction of the enzymes green gram-phosphatase. What does the graph indicate ?
View SolutionThe graph given below shows the effect of substrate concentration on the rate of reaction of the enzyme green-gram-phosphatase What does the graph indicates?
View Solutionthe graph given in Fig.9.36 shows the effect of substrate concentration on the rate of reaction of the enzyme green-gram -phosphatase . What does the graph indicates ?
View SolutionExplain the effect of substrate concentration on enzyme activity
View SolutionDiscuss the effect of concentration and temperature on the rate of reaction.
View SolutionThe given graph indicates :
View SolutionWhich one of the given graphs shows the effect of temperature on the velocity of a typical enzymatic reaction ?
View SolutionFigure given below shows three velocity-substrate concentration curves for an enzyme reaxtion. What do the curves for an enzyme reaction. What do the curves depict
View SolutionWhich one of the graphs show the effect of temperature on the velocity of a typical enzymatic reaction?
View Solution
