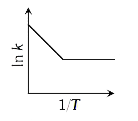
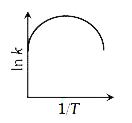
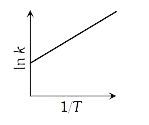
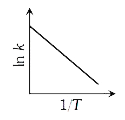
Among the following graphs showing variation of rate (k) with temperature (T) for a recation, the one that exhibits arrhenius behaviour over the entire temperature range is
The correct Answer is:D
To determine which graph exhibits Arrhenius behavior over the entire temperature range, we can follow these steps:
Step 1: Understand the Arrhenius Equation
The Arrhenius equation is given by:
k=Ae−EaRT
Where:
- k is the rate constant,
- A is the pre-exponential factor,
- Ea is the activation energy,
- R is the universal gas constant,
- T is the temperature in Kelvin.
Step 2: Take the Natural Logarithm
Taking the natural logarithm of both sides, we get:
lnk=lnA−EaR⋅1T
This can be rearranged to the linear form:
lnk=−EaR⋅1T+lnA
Step 3: Identify the Linear Relationship
From the equation, we can see that if we plot lnk (y-axis) against 1T (x-axis), we should get a straight line with:
- Slope = −EaR (which is negative),
- Y-intercept = lnA.
Step 4: Analyze the Graphs
Now, we need to analyze the provided graphs to find which one shows a straight line with a negative slope over the entire temperature range.
1. Graph A: Check if it is linear and has a negative slope.
2. Graph B: Check if it is linear and has a negative slope.
3. Graph C: Check if it is linear and has a negative slope.
4. Graph D: Check if it is linear and has a negative slope.
Step 5: Determine the Correct Graph
The graph that maintains a straight line with a consistent negative slope across the entire temperature range represents the Arrhenius behavior.
Conclusion
After analyzing the graphs, you will identify the one that fits the criteria of exhibiting Arrhenius behavior over the entire temperature range.
The Arrhenius equation is given by:
k=Ae−EaRT
Where:
- k is the rate constant,
- A is the pre-exponential factor,
- Ea is the activation energy,
- R is the universal gas constant,
- T is the temperature in Kelvin.
Taking the natural logarithm of both sides, we get:
lnk=lnA−EaR⋅1T
This can be rearranged to the linear form:
lnk=−EaR⋅1T+lnA
From the equation, we can see that if we plot lnk (y-axis) against 1T (x-axis), we should get a straight line with:
- Slope = −EaR (which is negative),
- Y-intercept = lnA.
Now, we need to analyze the provided graphs to find which one shows a straight line with a negative slope over the entire temperature range.
2. Graph B: Check if it is linear and has a negative slope.
3. Graph C: Check if it is linear and has a negative slope.
4. Graph D: Check if it is linear and has a negative slope.
The graph that maintains a straight line with a consistent negative slope across the entire temperature range represents the Arrhenius behavior.
After analyzing the graphs, you will identify the one that fits the criteria of exhibiting Arrhenius behavior over the entire temperature range.
Topper's Solved these Questions
- CHEMICAL KINETICSBOOK - ERRORLESSCHAPTER - CHEMICAL KINETICSEXERCISE - NCERT BASED QUESTIONS (Collision Theory, Energy of Activation and Arrhenius Equation)
54 Videos
- CHEMICAL KINETICSBOOK - ERRORLESSCHAPTER - CHEMICAL KINETICSEXERCISE - NCERT BASED QUESTIONS (Photochemical Reaction)
4 Videos
- CHEMICAL KINETICSBOOK - ERRORLESSCHAPTER - CHEMICAL KINETICSEXERCISE - Assertion & Reason
6 Videos
- CARBOXYLIC ACIDSBOOK - ERRORLESSCHAPTER - CARBOXYLIC ACIDSEXERCISE - Assertion & Reason
5 Videos
- CHEMISTRY IN EVERYDAY LIFE BOOK - ERRORLESSCHAPTER - CHEMISTRY IN EVERYDAY LIFE EXERCISE - Assertion & Reason
4 Videos
Similar Questions
Knowledge Check
Which of the following graph is incorrect for variation of rate constant (K) with temperature for a reaction obeying Arrhenius equation ?
A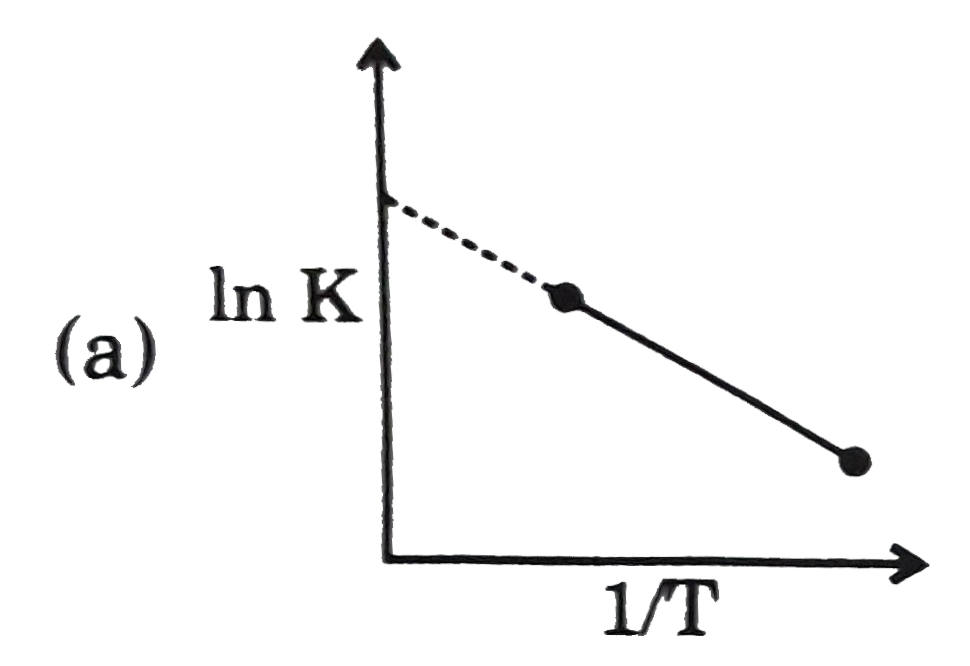 B
B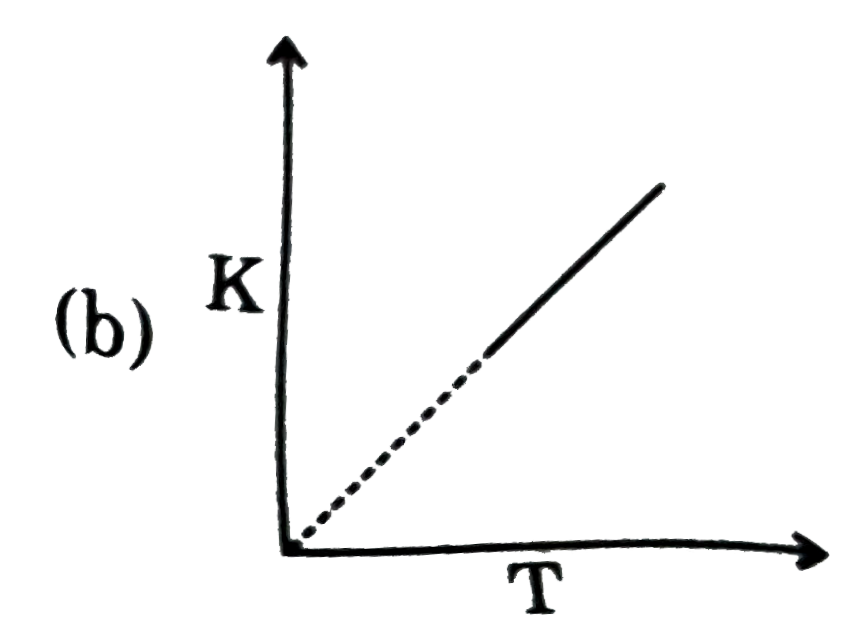 C
C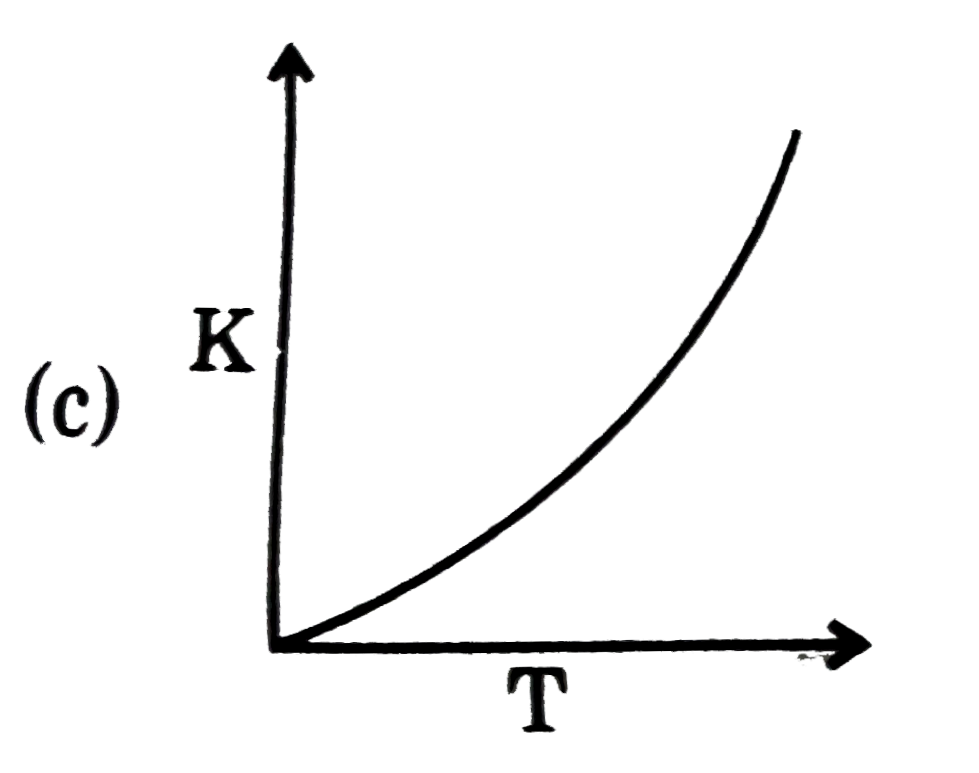 D
D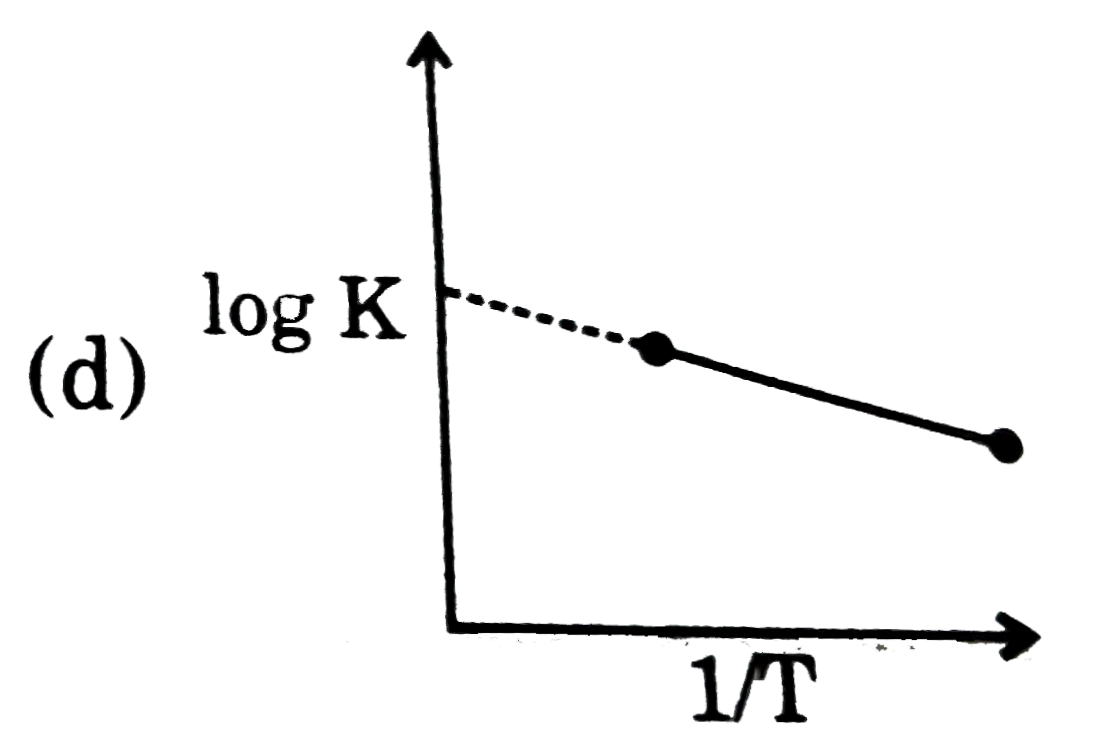
which of the following graph represents the variation of resistivity (ρ) with temperature (T) for copper?
A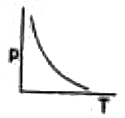 B
B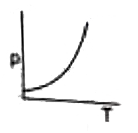 C
C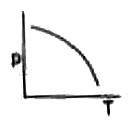 D
D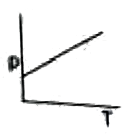
Which of the following graphs shows variation between density of water and temperature?
A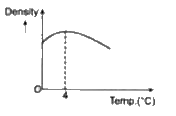 B
B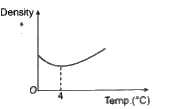 C
C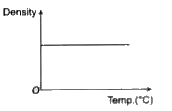 D
D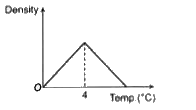
Which one of the following given graphs represents the variation of rate constant (k) with temperature (t) for an endothermic reaction ?
View SolutionWhich one of the following given graphs represents the variation of rate constant (k) with temperature (f) for an endothermic reaction ?
View SolutionShow on a graph the variation of resistivity with temperature for a typical semiconductor
View SolutionPlots showing the variation of the rate constant (k) with temperature (T) are given below. The plot that follows the Arrhenius equation is
View SolutionPlots showing the variation of the rate constant (k) with temperature (T) are given below. The plot that follows the Arrhenius equation is
View Solution
