The graph that depicts Einstein photoelectric effect for a monochromatic source of frequency above that theshold frequency is
A
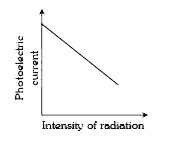
B
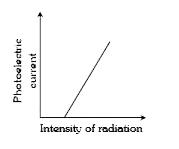
C
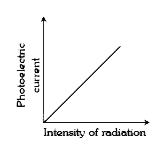
D
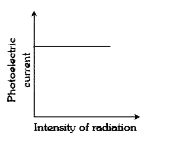
Video Solution
Text Solution
The correct Answer is:C
On increasing intensity of radiation, value of photo electric current increases because no. of photon incident increases.
|
Topper's Solved these Questions
- STRUCTURE OF ATOMBOOK - ERRORLESSCHAPTER - STRUCTURE OF ATOMEXERCISE - NCERT BASED QUESTIONS (Dual Nature of Electron)
16 Videos
- STRUCTURE OF ATOMBOOK - ERRORLESSCHAPTER - STRUCTURE OF ATOMEXERCISE - NCERT BASED QUESTIONS (Uncertainty Principle and Schrodinger Wave Equation)
13 Videos
- STRUCTURE OF ATOMBOOK - ERRORLESSCHAPTER - STRUCTURE OF ATOMEXERCISE - NCERT BASED QUESTIONS (Atomic Number, Mass Number, Atomic Species)
27 Videos
- STATES OF MATTER BOOK - ERRORLESSCHAPTER - STATES OF MATTER EXERCISE - ASSERTION AND REASON
11 Videos
- THE P-BLOCK ELEMENTS (BORON AND CARBON FAMILY)BOOK - ERRORLESSCHAPTER - THE P-BLOCK ELEMENTS (BORON AND CARBON FAMILY)EXERCISE - Assertion & Reason
10 Videos
Similar Questions
Knowledge Check
Which is the graph with respect to photoelectric effect?
A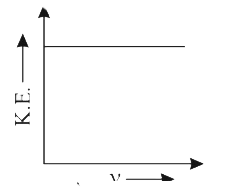 B
B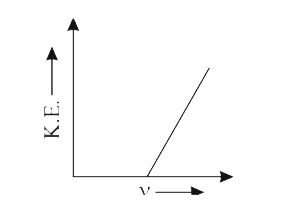 C
C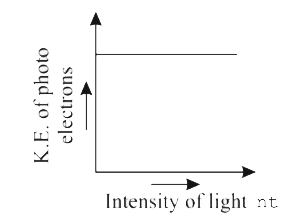 D
D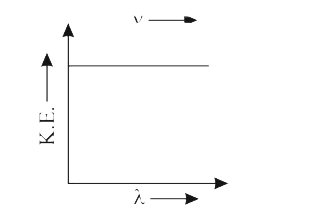
By photoelectric effect, Einstein, proved
AE=hvBK.E.=12mv2CE=mc2DE=Rhc2n2Einstein's work on photoelectric effect gives support to
AMass energy relationBBohr's theoryCPlanck's equation E=hvDde Broglie's hypothesis
Einstein's work on photoelectric effect gives support to
View SolutionIn the experiment on photoelectric effect using light having frequency greater than the threshold frequency, the photocurrent will certainly increase when
View SolutionIn photoelectric effect , if a week intensity radiation instead of strong intensity of suitable frequency is used then
View SolutionIn photoelectric effect , if a week intensity radiation instead of strong intensity of suitable frequency is used then
View SolutionIn photoelectric effect on metals, an increase in the frequency of incident radiation increases:
View Solution
