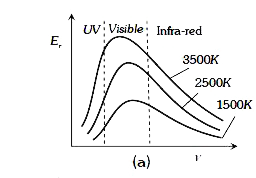
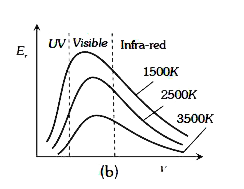
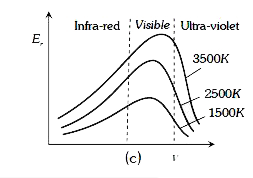
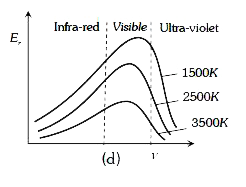
Which of the following graph(s) shows the correct variation in intensity of heat radiation by black body and frequency at a fixed temperature -
A
B
C
D
Video Solution
Text Solution
The correct Answer is:C
λm∝1T⇒fm∝T,
Where,f_m → frequency.
|
Topper's Solved these Questions
- TRANSMISSION OF HEAT BOOK - ERRORLESSCHAPTER - TRANSMISSION OF HEAT EXERCISE - NCERT BASED QUESTIONS (Radiation (Stefan.s law))
25 Videos
- TRANSMISSION OF HEAT BOOK - ERRORLESSCHAPTER - TRANSMISSION OF HEAT EXERCISE - NCERT BASED QUESTIONS (Radiation (Newton.s Law of Cooling))
11 Videos
- TRANSMISSION OF HEAT BOOK - ERRORLESSCHAPTER - TRANSMISSION OF HEAT EXERCISE - NCERT BASED QUESTIONS (Radiation (General,Kirchhoff.s law,Black body))
14 Videos
- THERMOMETRY, THERMAL EXPANSION AND CALORIMETRYBOOK - ERRORLESSCHAPTER - THERMOMETRY, THERMAL EXPANSION AND CALORIMETRYEXERCISE - ASSERTION & REASON
10 Videos
- UNITS, DIMENSIONS AND MEASUREMENTBOOK - ERRORLESSCHAPTER - UNITS, DIMENSIONS AND MEASUREMENTEXERCISE - ASSERTION & REASON
17 Videos
Similar Questions
Knowledge Check
Which of the following graphs shows the correct variation in intensity of heat radiations by black body and frequency at a fixed temperature
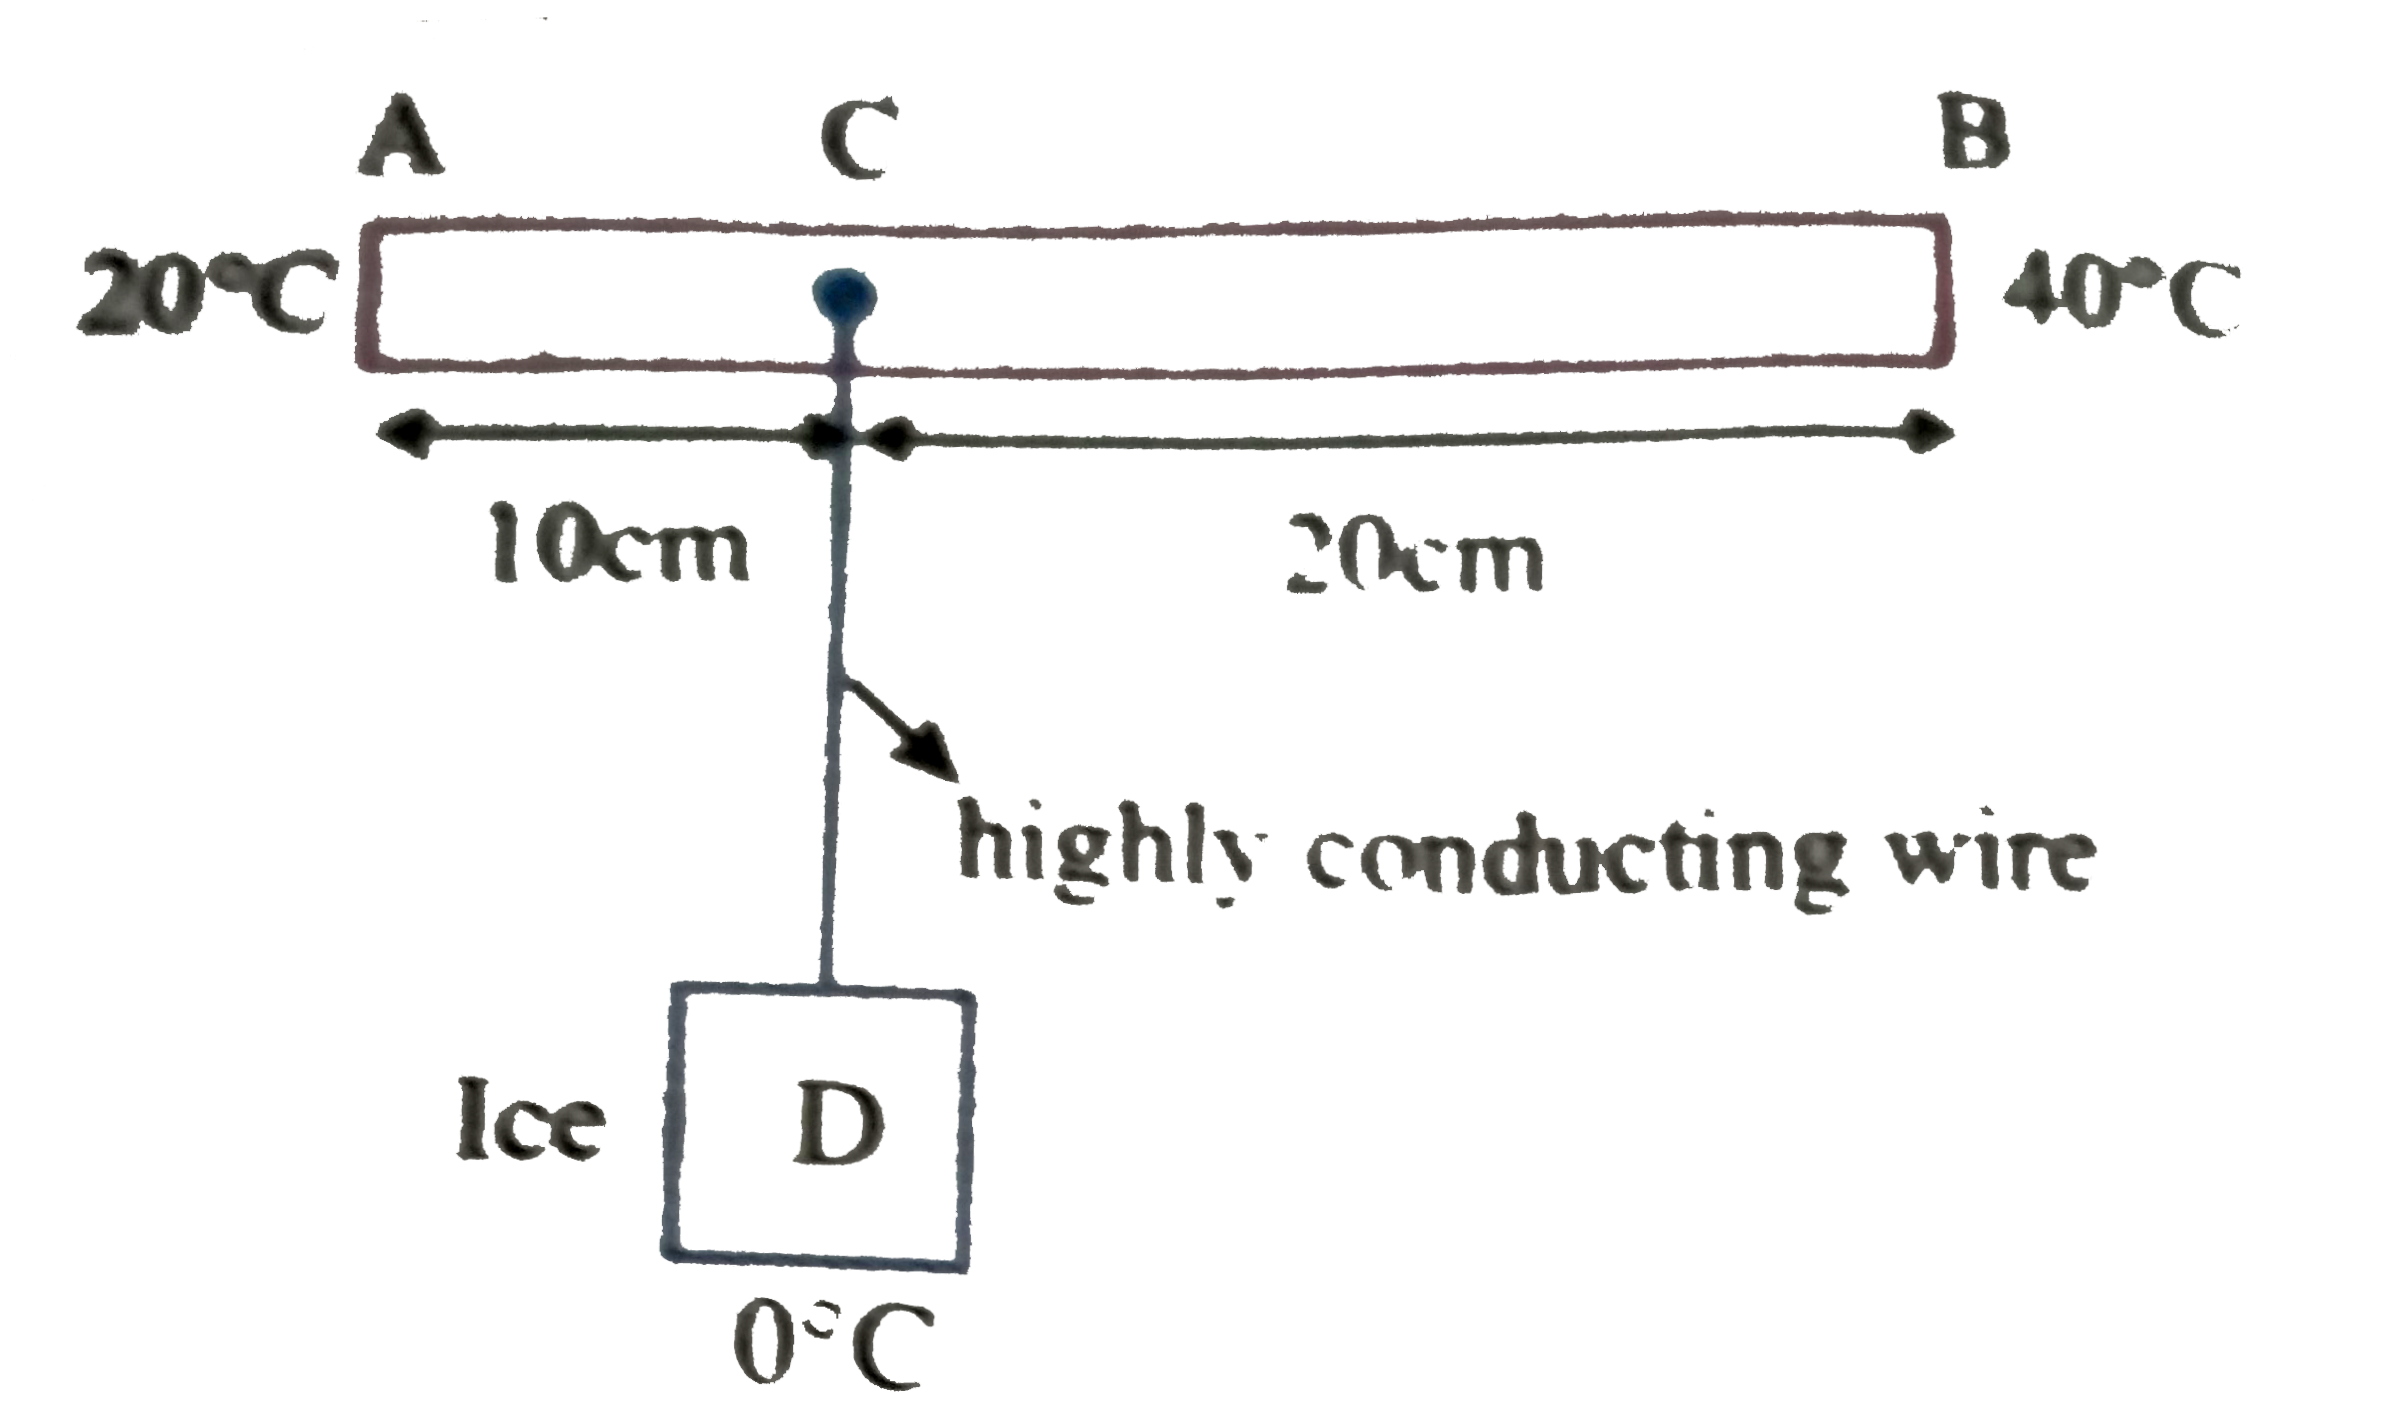 .A
.A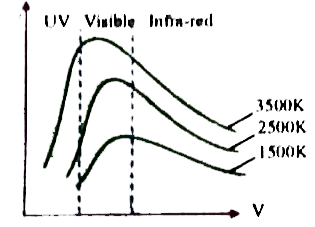 B
B C
C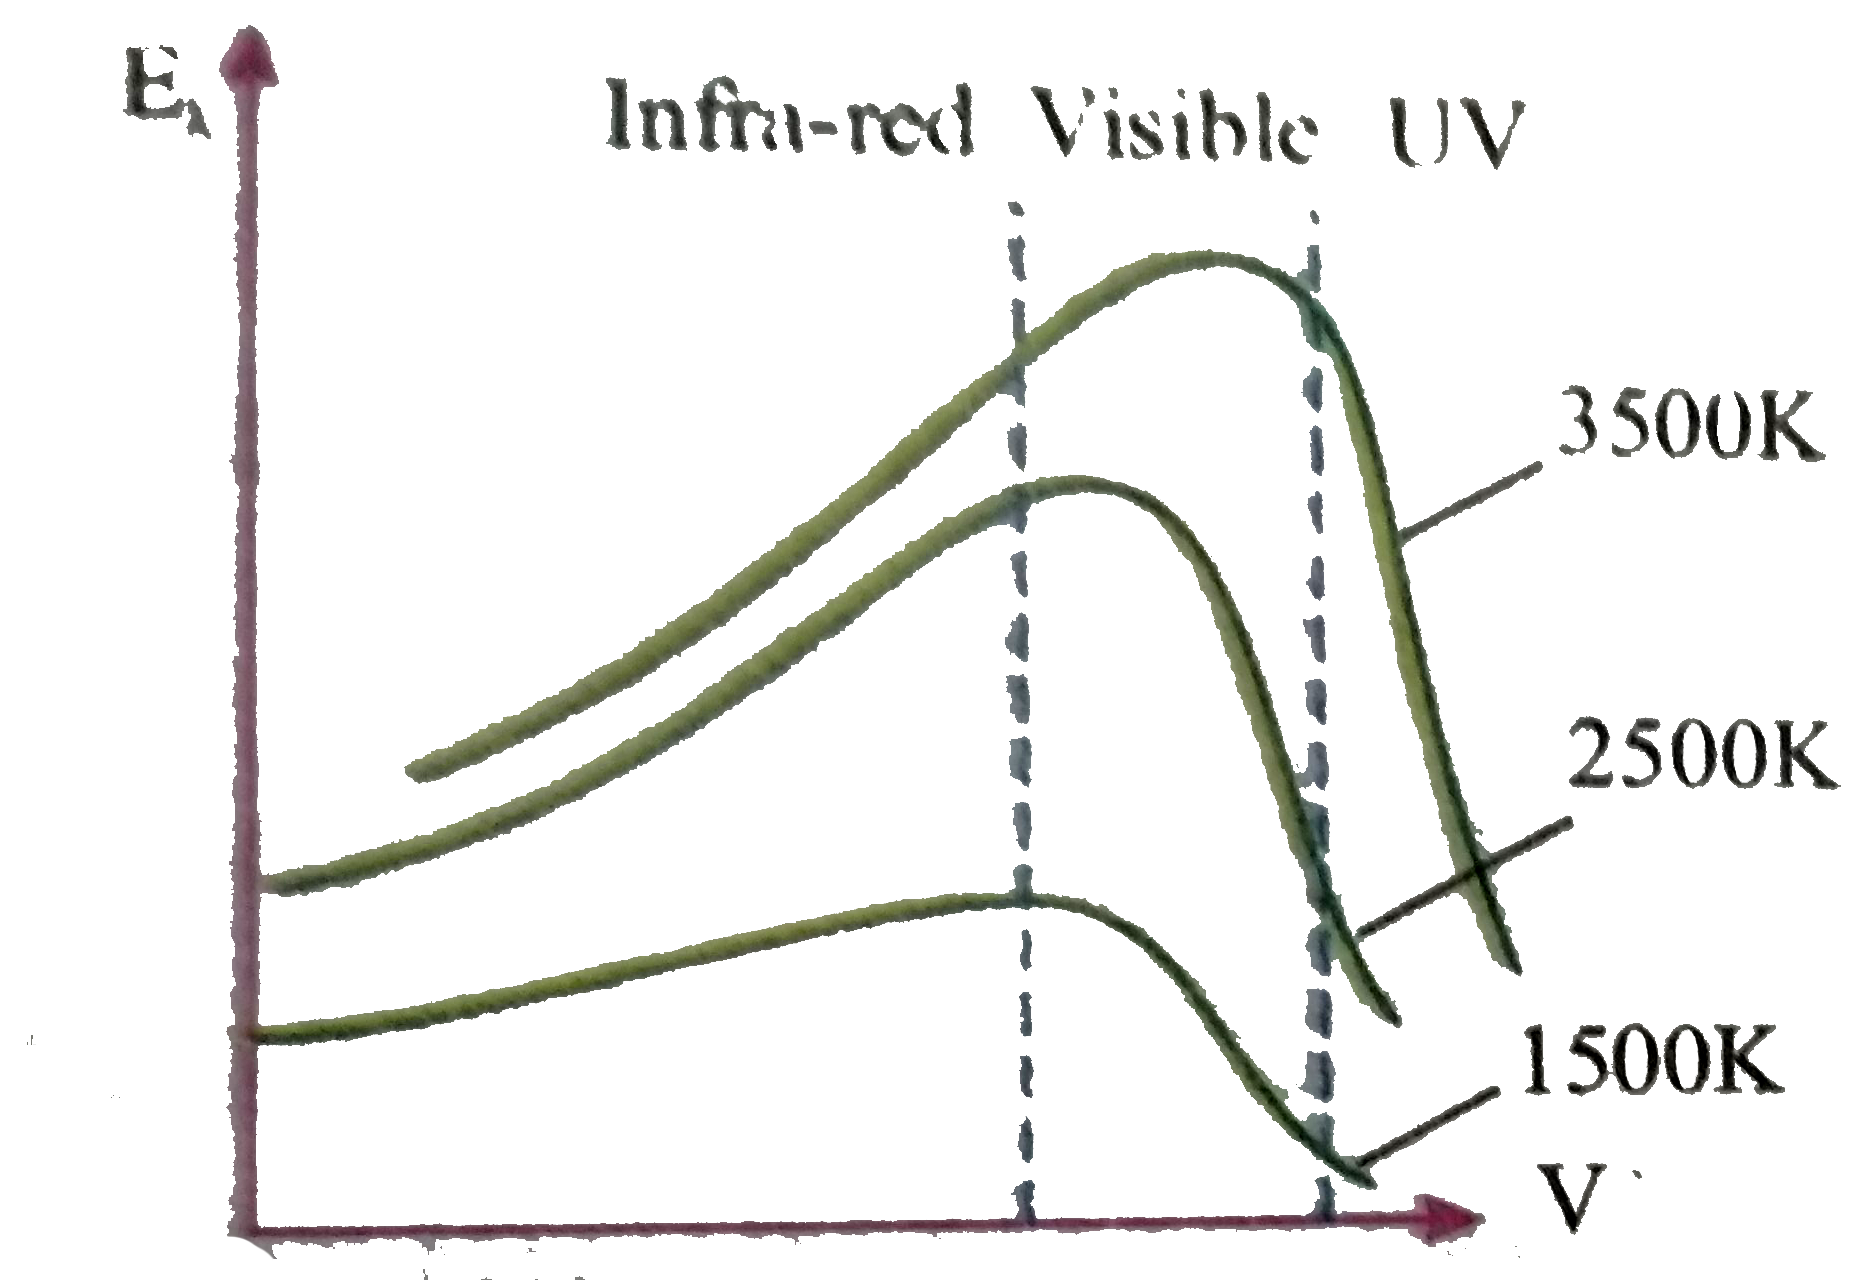 D
D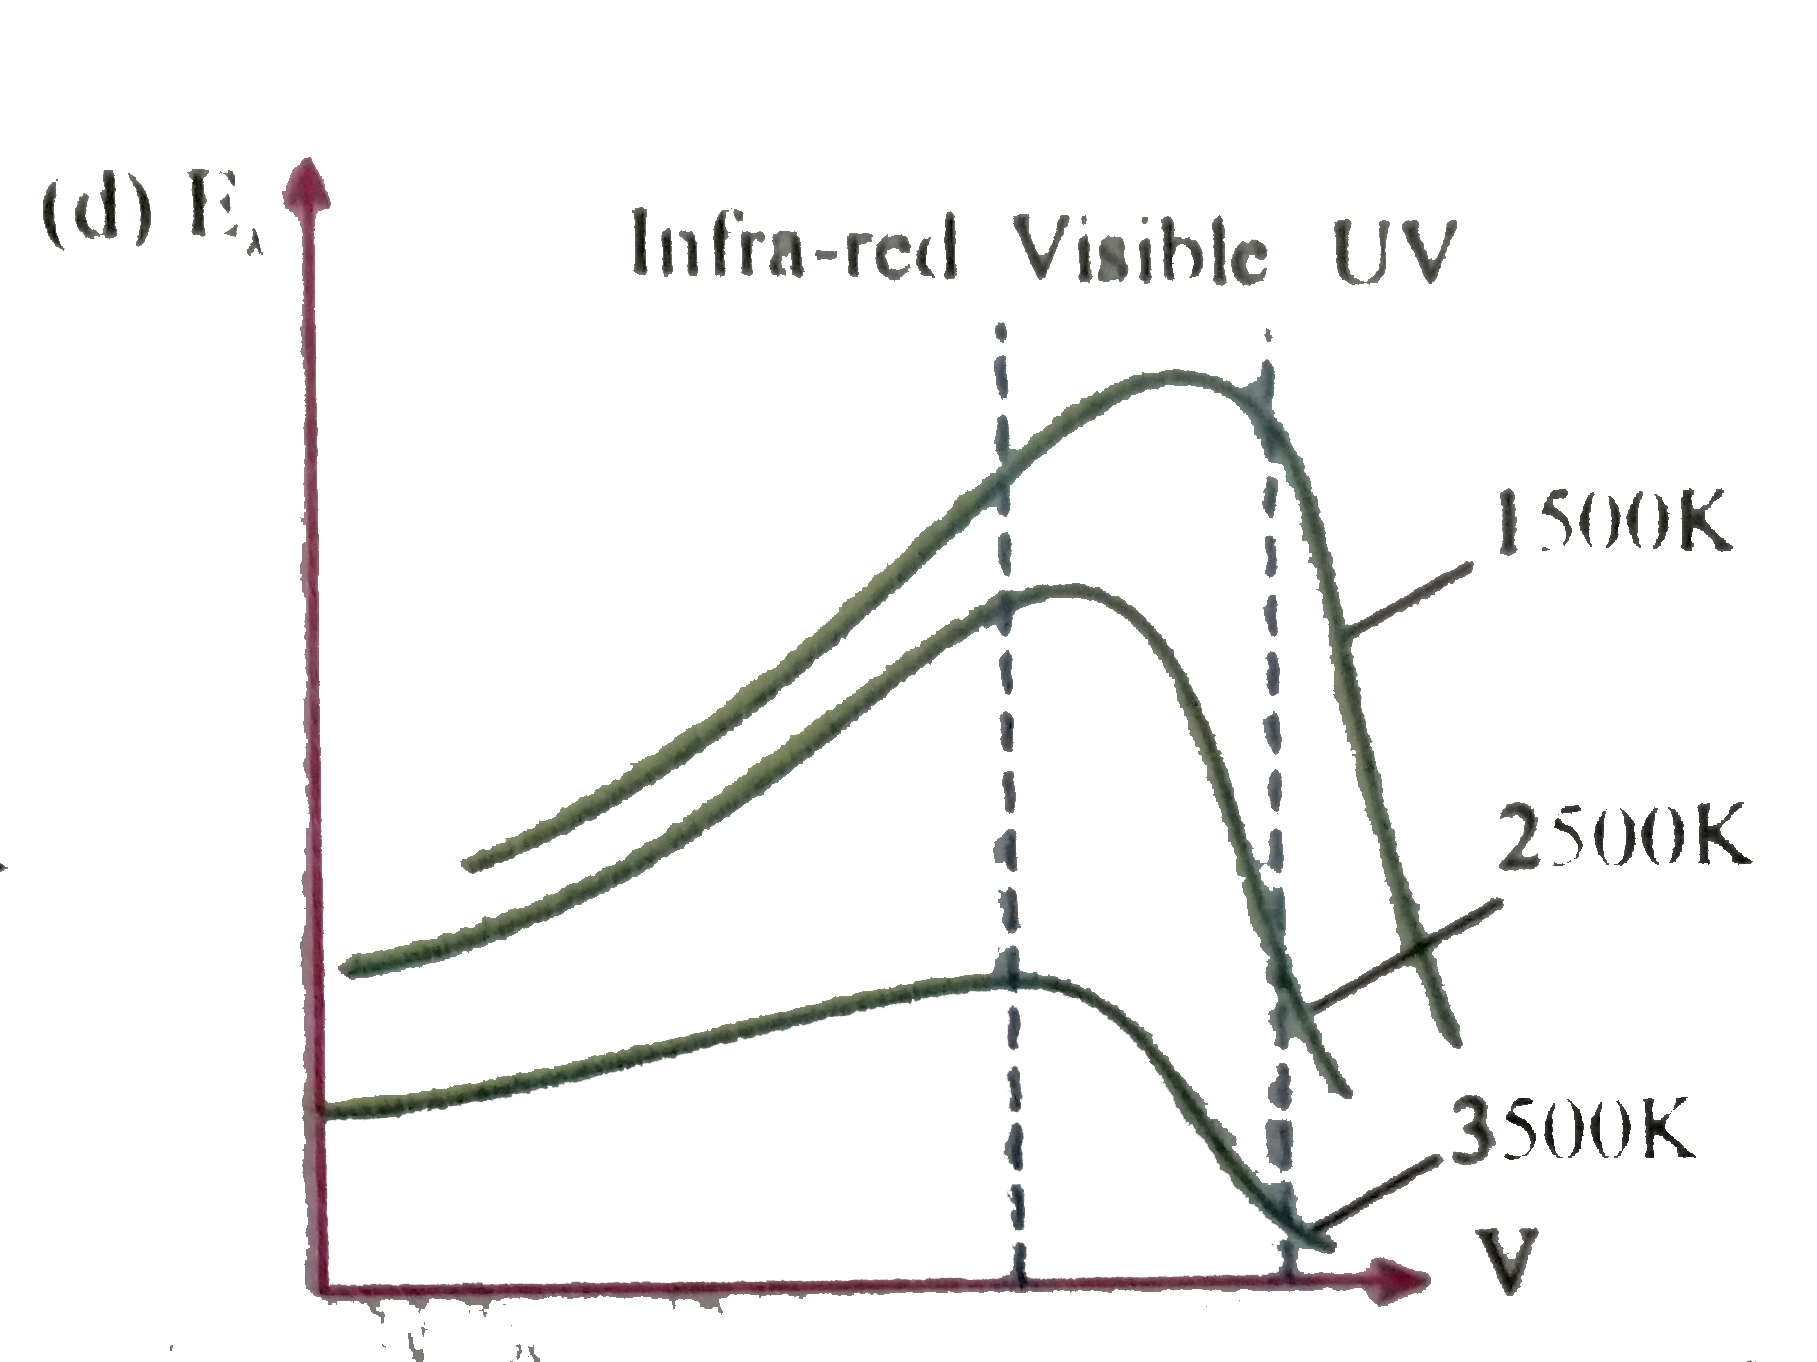
Following graph shows the correct variation in intensity of heat radiations by black body and frequency at a fixed temperature
A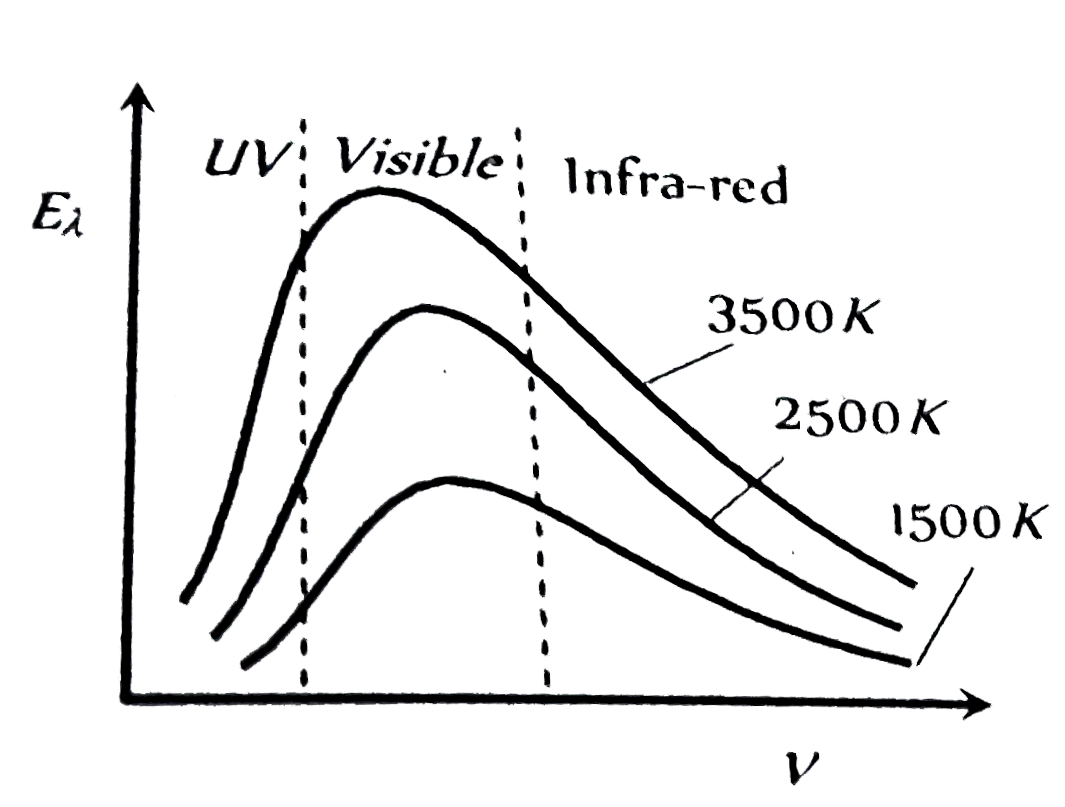 B
B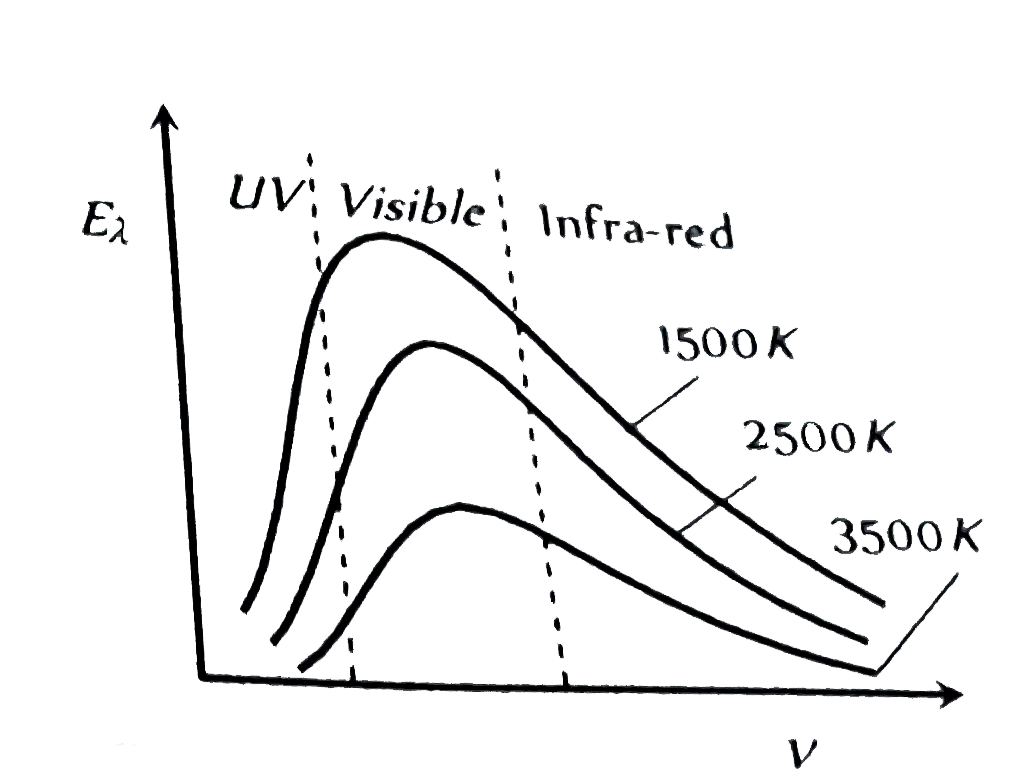 C
C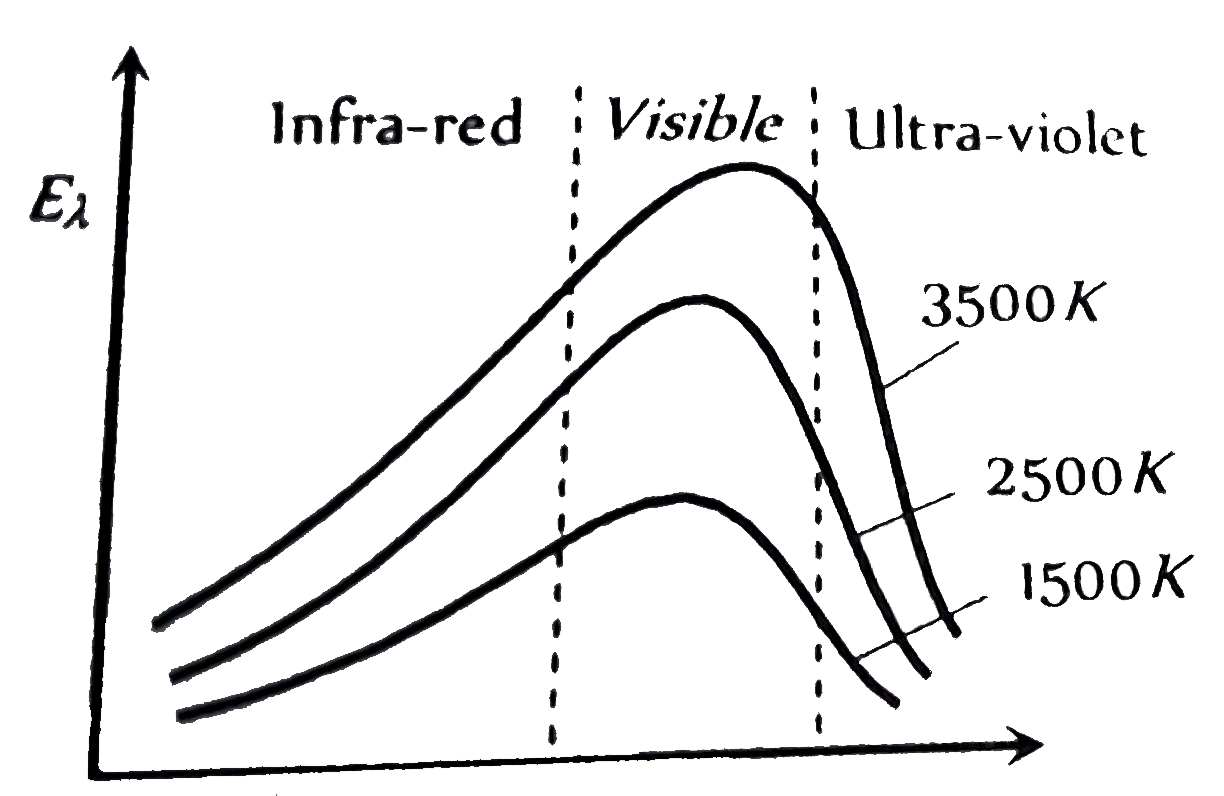 D
D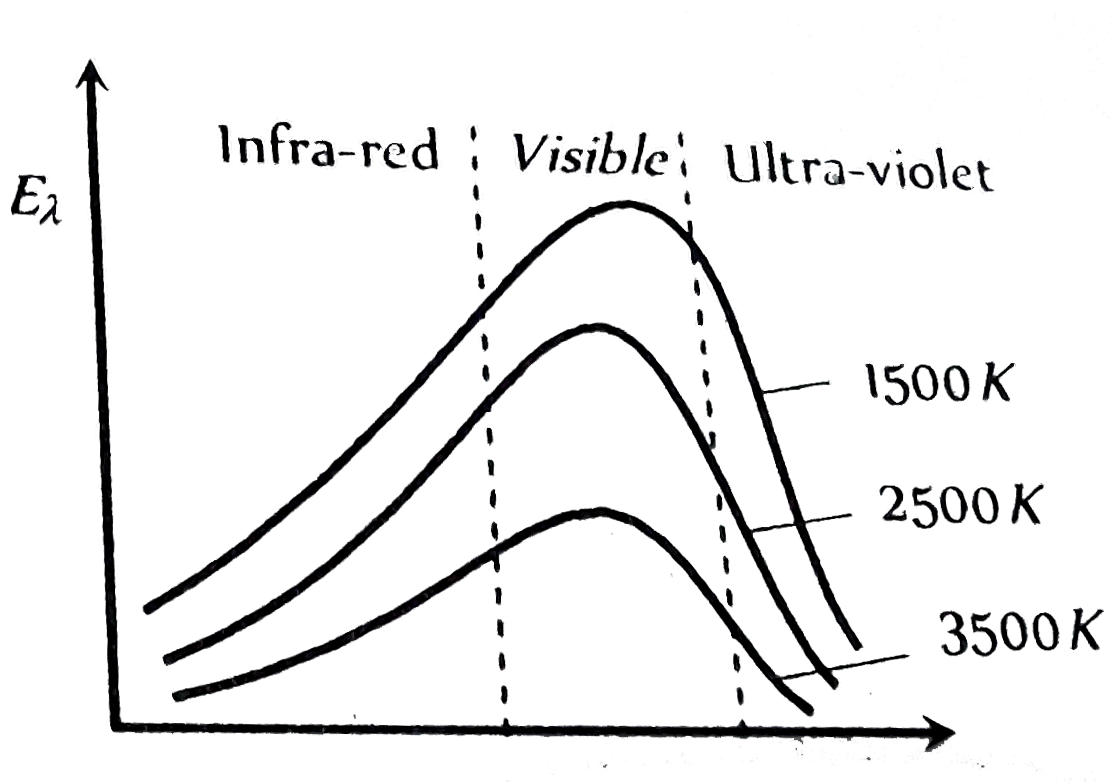
Following graphs shows the variation in the intensity of heat radiations by the the black body and frequency at a fixed temperature . Choose the correct option.
A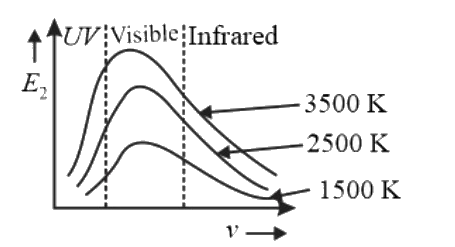 B
B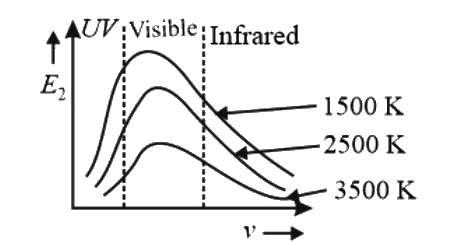 C
C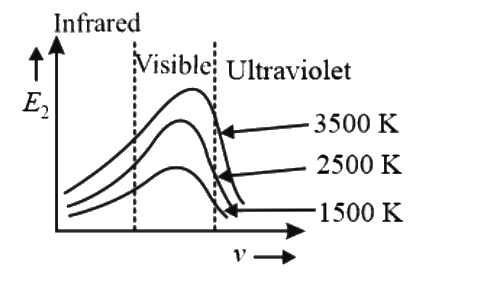 D
D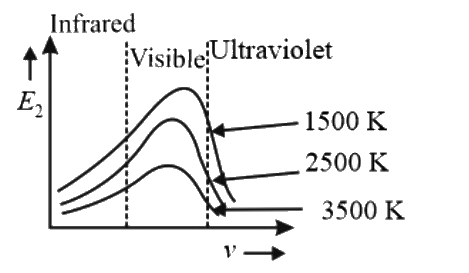
Which one of the following graphs best represents the ways in which the total power P radiated by a black body depends upon the thermodynamic temperature T of the body?
View SolutionWhich of the following graphs represents correctly the variations of 0.5mv2max with the intensity of incident radiations of a constant frequency ?
View Solutionwhich of the following is NOT the property of black body radiations?
View SolutionWhich one of the following graphs represents variation of specific heat capacity of water with temperature?
View SolutionWhich one of the following graphs shows the rate at which heat is emitted from a hot body as a function of its Kelvin temperature T' ?
View Solution
