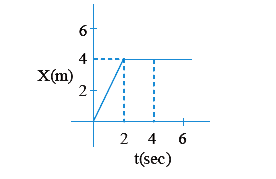
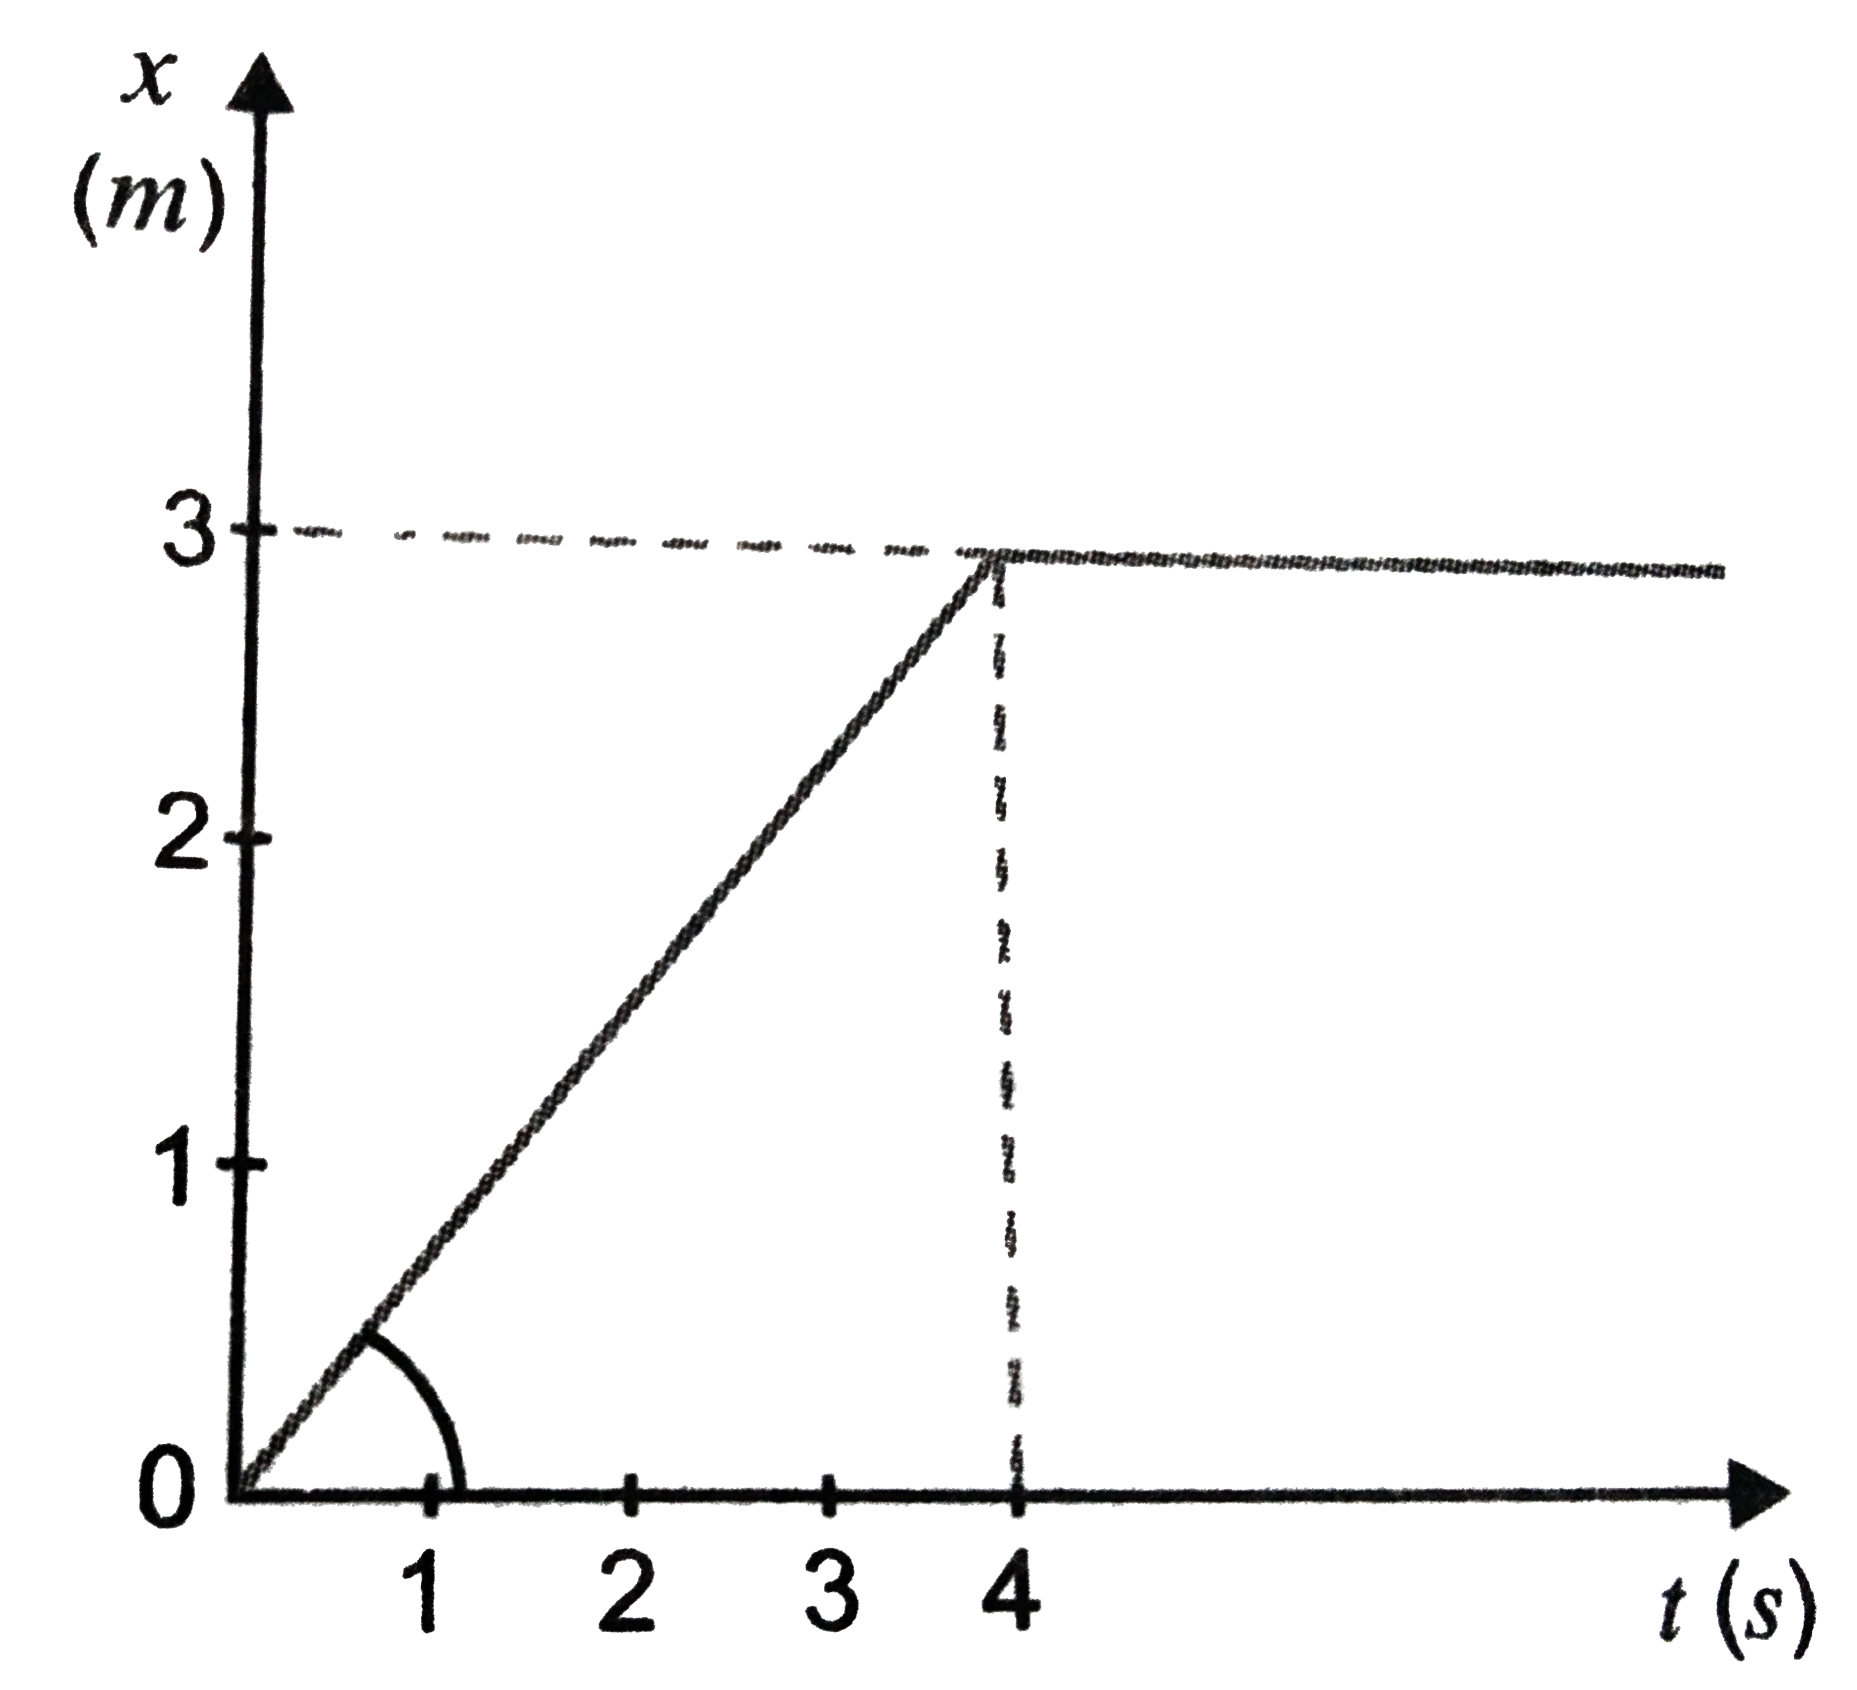
The position-time graph of a particle of mass 4 kg is shown in the figure. Calculate the impulse (in MKS units) at time t = 0 and t=6 second respectively.

A
+.631and−.631
B
+.333and−.333
C
+.525and−.525
D
+.325and−.325
Video Solution
Text Solution
The correct Answer is:B
Impulse (I) = Change in momentum
At t = 0
I=(56−0)×4206=3.33
at t = 6
I=(0−56)×4=−3.33
|
Topper's Solved these Questions
- NEWTON'S LAWS OF MOTIONBOOK - ERRORLESSCHAPTER - NEWTON'S LAWS OF MOTIONEXERCISE - NCERT BASED QUESTION (EQUILIBRIUM OF FORCES)
4 Videos
- NEWTON'S LAWS OF MOTIONBOOK - ERRORLESSCHAPTER - NEWTON'S LAWS OF MOTIONEXERCISE - NCERT BASED QUESTION (MOTION OF CONNECTED BODIES)
22 Videos
- NEWTON'S LAWS OF MOTIONBOOK - ERRORLESSCHAPTER - NEWTON'S LAWS OF MOTIONEXERCISE - NCERT BASED QUESTION (THIRD LAW OF MOTION)
11 Videos
- MOTION IN TWO DIMENSIONBOOK - ERRORLESSCHAPTER - MOTION IN TWO DIMENSIONEXERCISE - ASSERTION & REASON
19 Videos
- ROTATIONAL MOTIONBOOK - ERRORLESSCHAPTER - ROTATIONAL MOTIONEXERCISE - Assertion & Reason
25 Videos
Similar Questions
Knowledge Check
The position-time graph of a particle of mass 0.1 kg is shown. The impulse at t = 2s is :
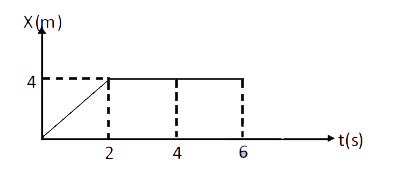 A0.2kgms−1B0.02kgms−1C0.1kgms−1D0.4kgms−1
Position time graph of a particle of mass 2 kg is shown in figrure. Total work done on the particle from t=0 to t=4s is
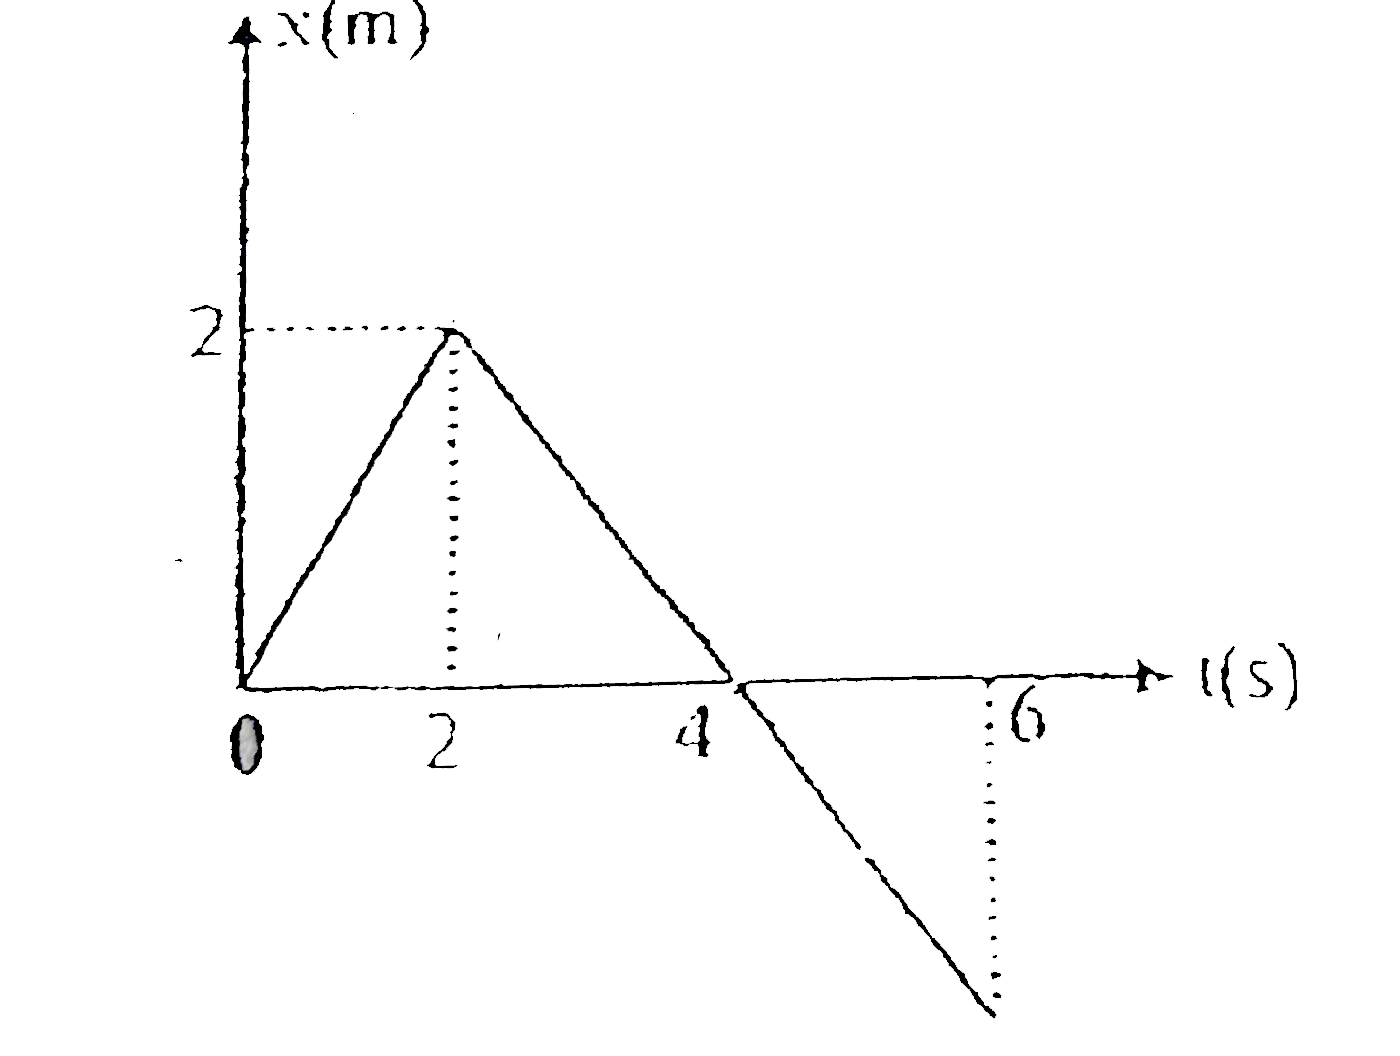 A8 JB4 JC0 JDCan't be determined
In the figure given, the position-time graph of a particle of mass 0.1 kg is shown the impulse at t = 2s is
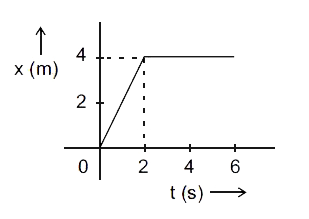 A0.2 kg m/sB−0.2 kg m/sC0.1 kg m/sD−0.4 kg m/s
The position time graph of a body of mass 2kg is as given in What is the impulse on the body at t=0 s and t=4s ?
 .
.
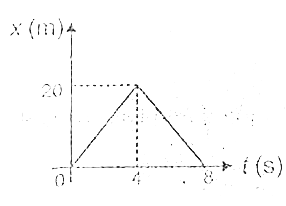
View SolutionThe position (X)-time (t) graph for a particle of mass 1 kg moving along x-axis is shown in figure. Find impulse on particle at t = 4 s.
View SolutionPosition time graph of two particles A and B are as shown in figure. Velocity of A w.r.t. B is
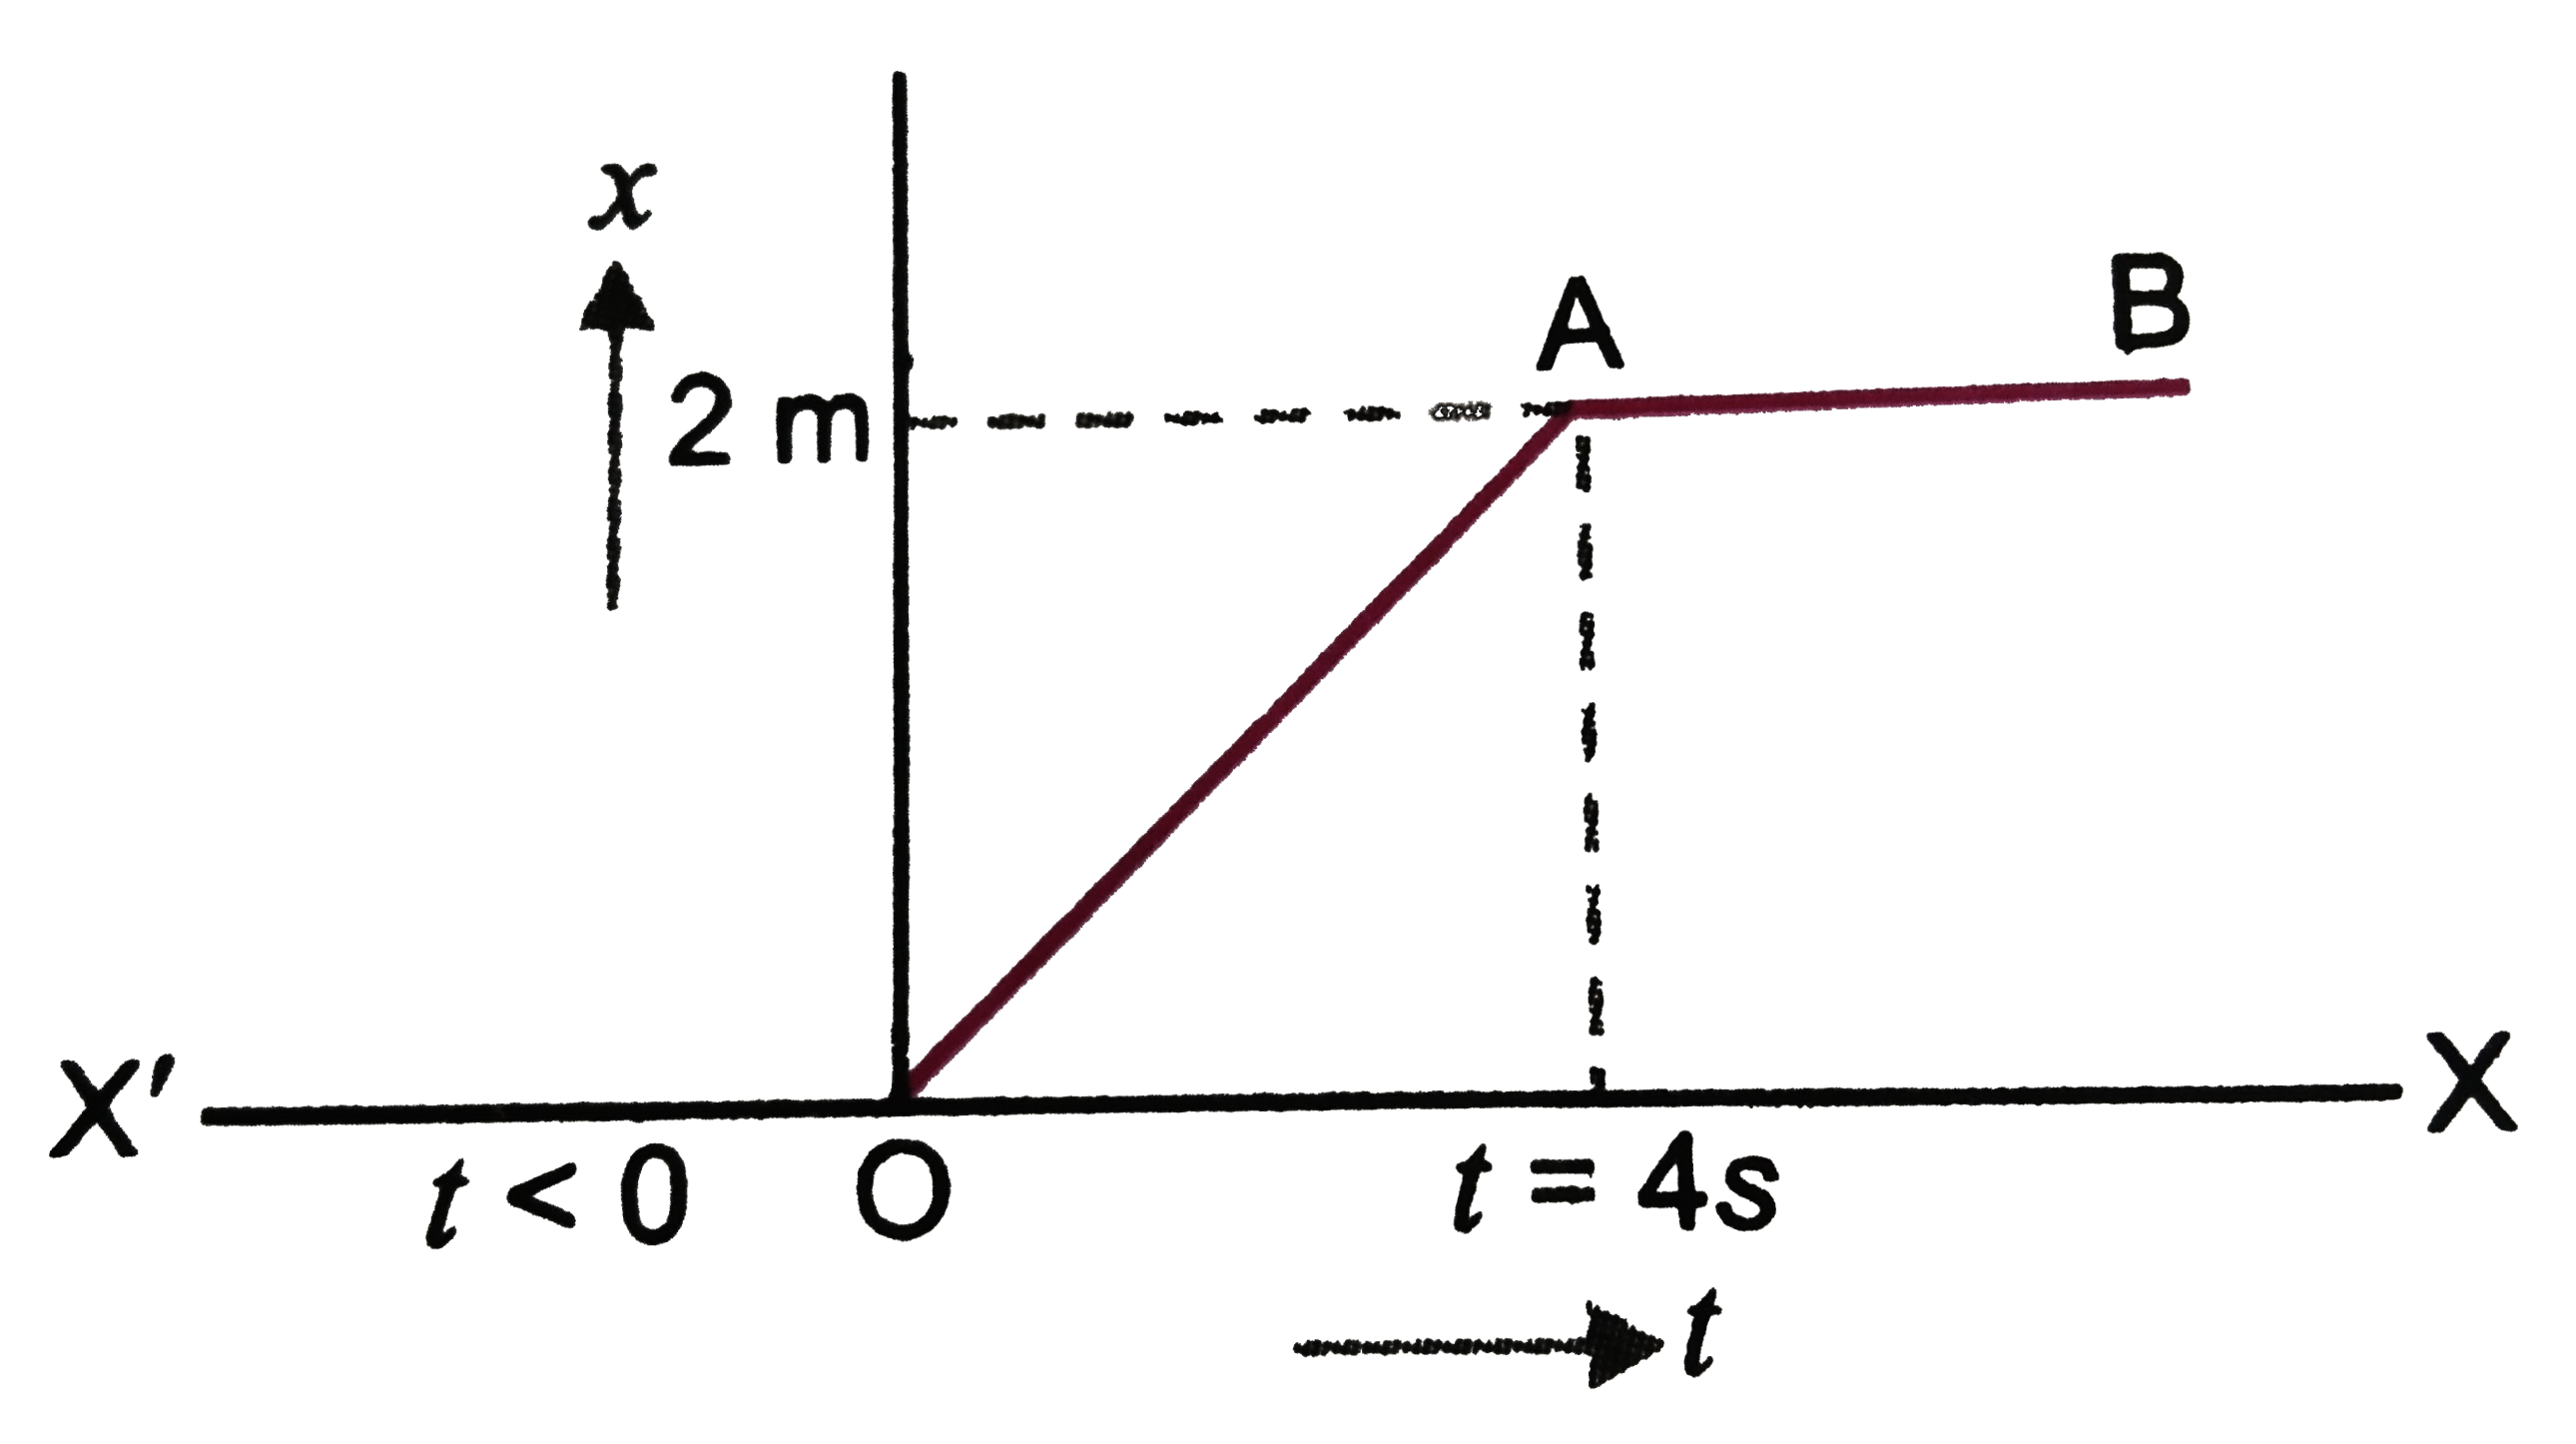
View SolutionShows position time graph of a particle of mass 100g Find the impulse at t=0 and at t=4s
 .
.
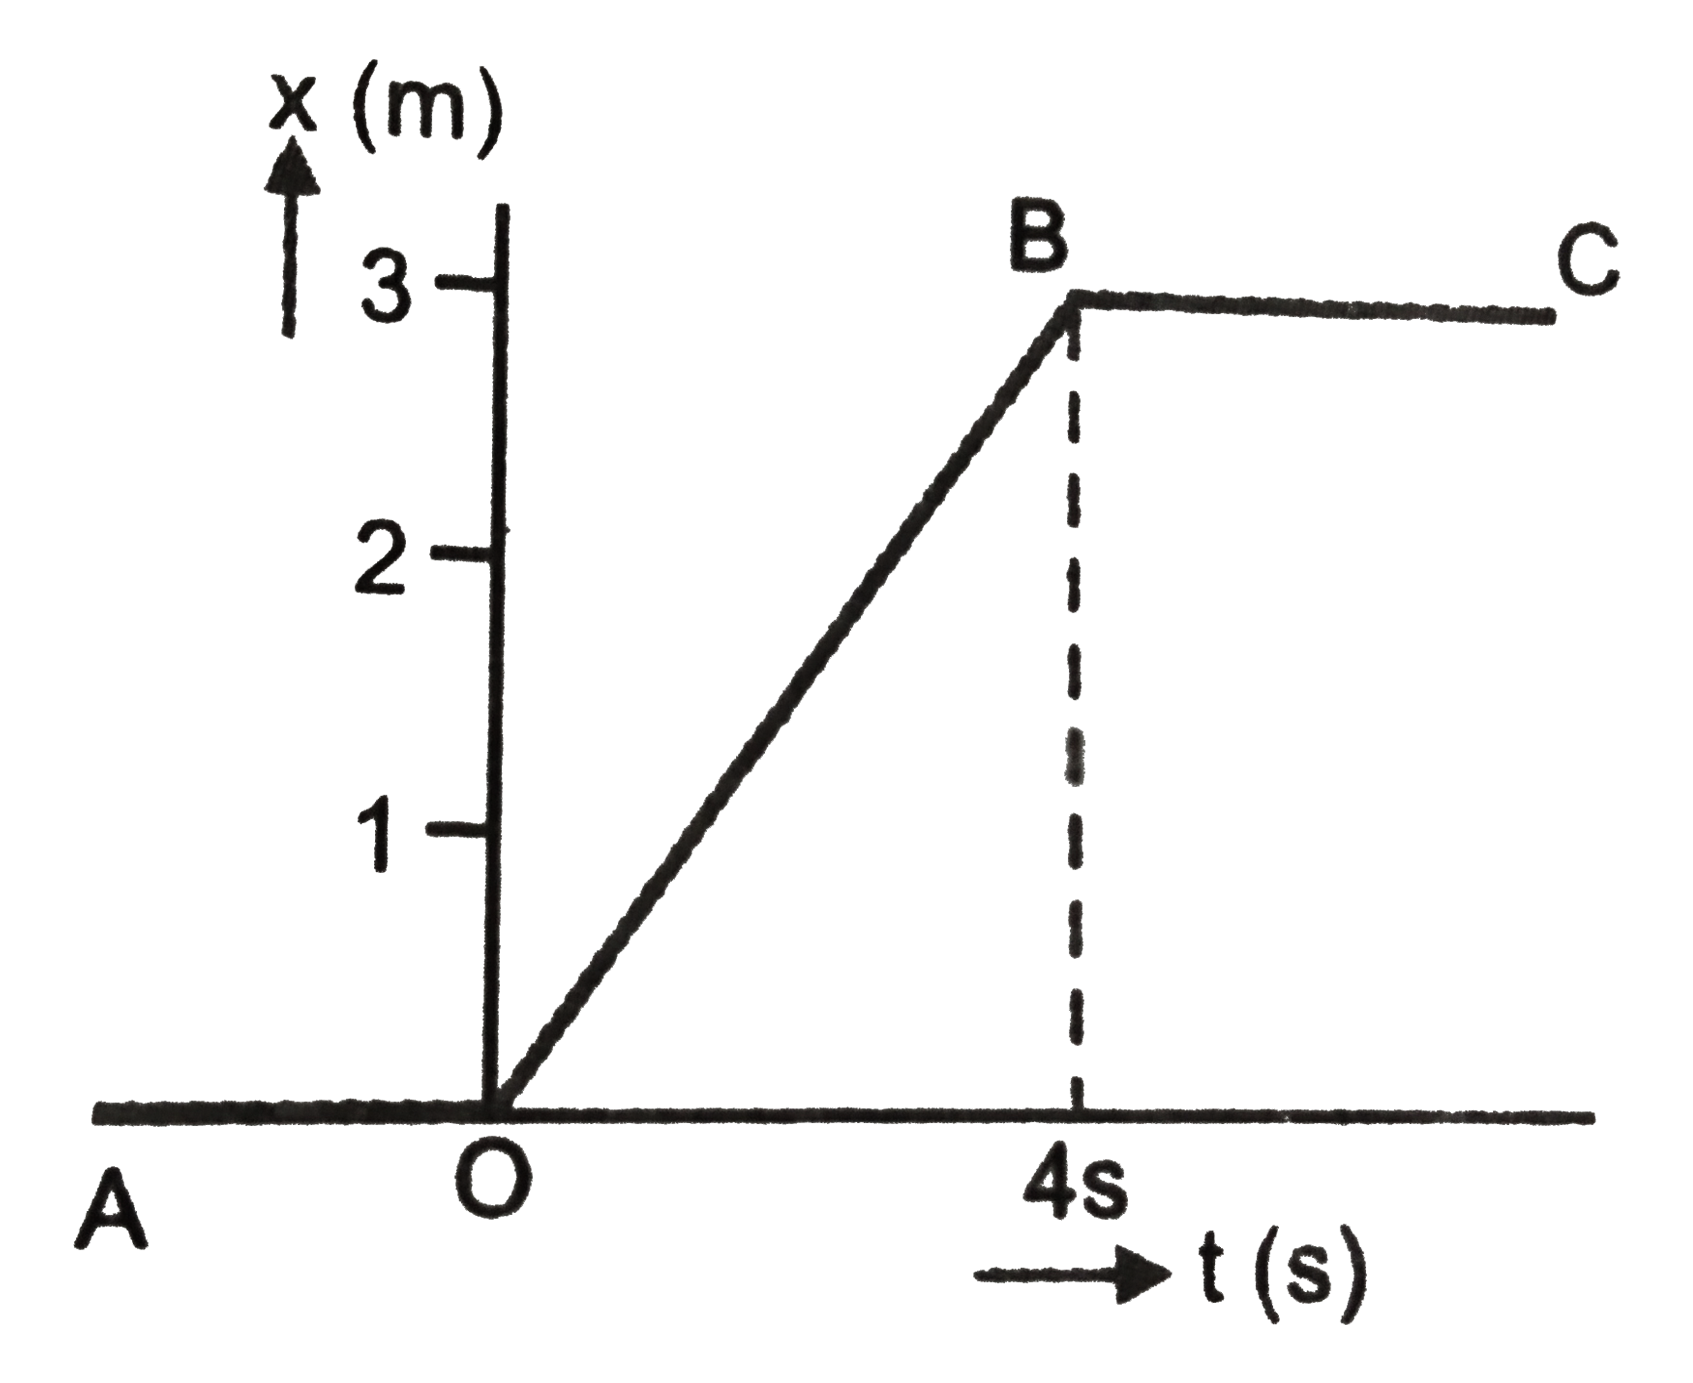
View SolutionShown the position time graph of a particle of mass 4 kg What is the force on the particle for t<0,0<t<4s motion only
 .
.
View Solution

