The graph shows the level of antibody in serum following vaccination and a challenge with the same antigen 28 days later.
Study the graphs below and answer the question:

In reference to the graph above, which graph 1 or 2 represent secondary response?
Video Solution
Text Solution
Graph. During the primary immune response to the first encounter with a specific pathogen, some lymphocytes called memory cells develop with the ability to confer long-lasting immunity to that pathogen, often for life. These memory cells recognize antigens on the pathogens they have encountered before, triggering the immune system to respond faster and more effectively than on the first expsure.
|
Similar Questions
Knowledge Check
Study the graph and answer the questions.
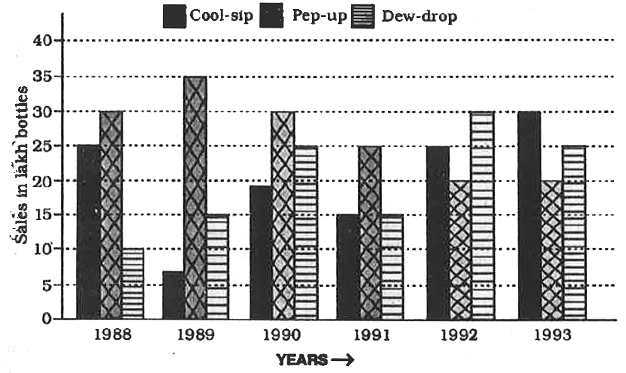
In which year sale of Drew-drop is maximum ?A1998B1992C1989D1993Study the following bar graph and answer the question that follows.

In which year was the maximin percentage increase in diamonds exports compared to the previous year?A2014B2009C2010D2012Study the graph and answer the questions.
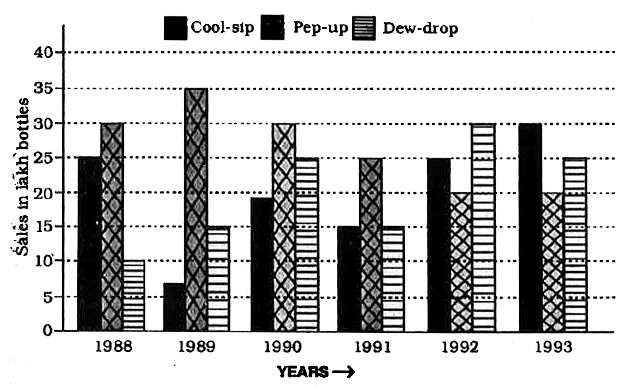
In which year the sale of cool-sip is minimum ?A1990B1992C1993DNone of the above
Study the bar graph and answer the following questions.
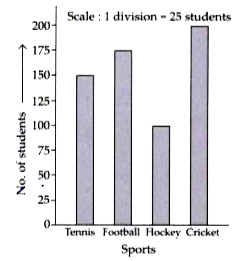
Which sport is preferred least ?
View SolutionStudy the following graph and answer the question based on the graph.
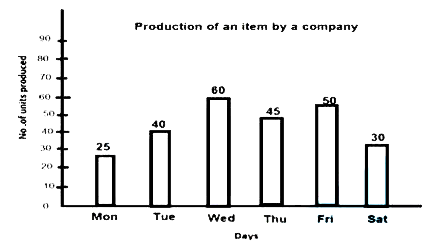
On which day the production was 1/5th of the total production?
View SolutionThe following graph shows the sales of cars (in thousands) in four cities in 4 years. Study the graph and answer the question
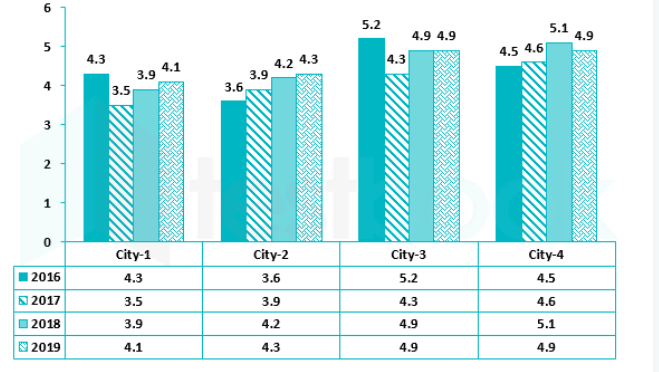
In which year. the sales are highest?
View SolutionRefer to the given graph carefully and answer the following question.
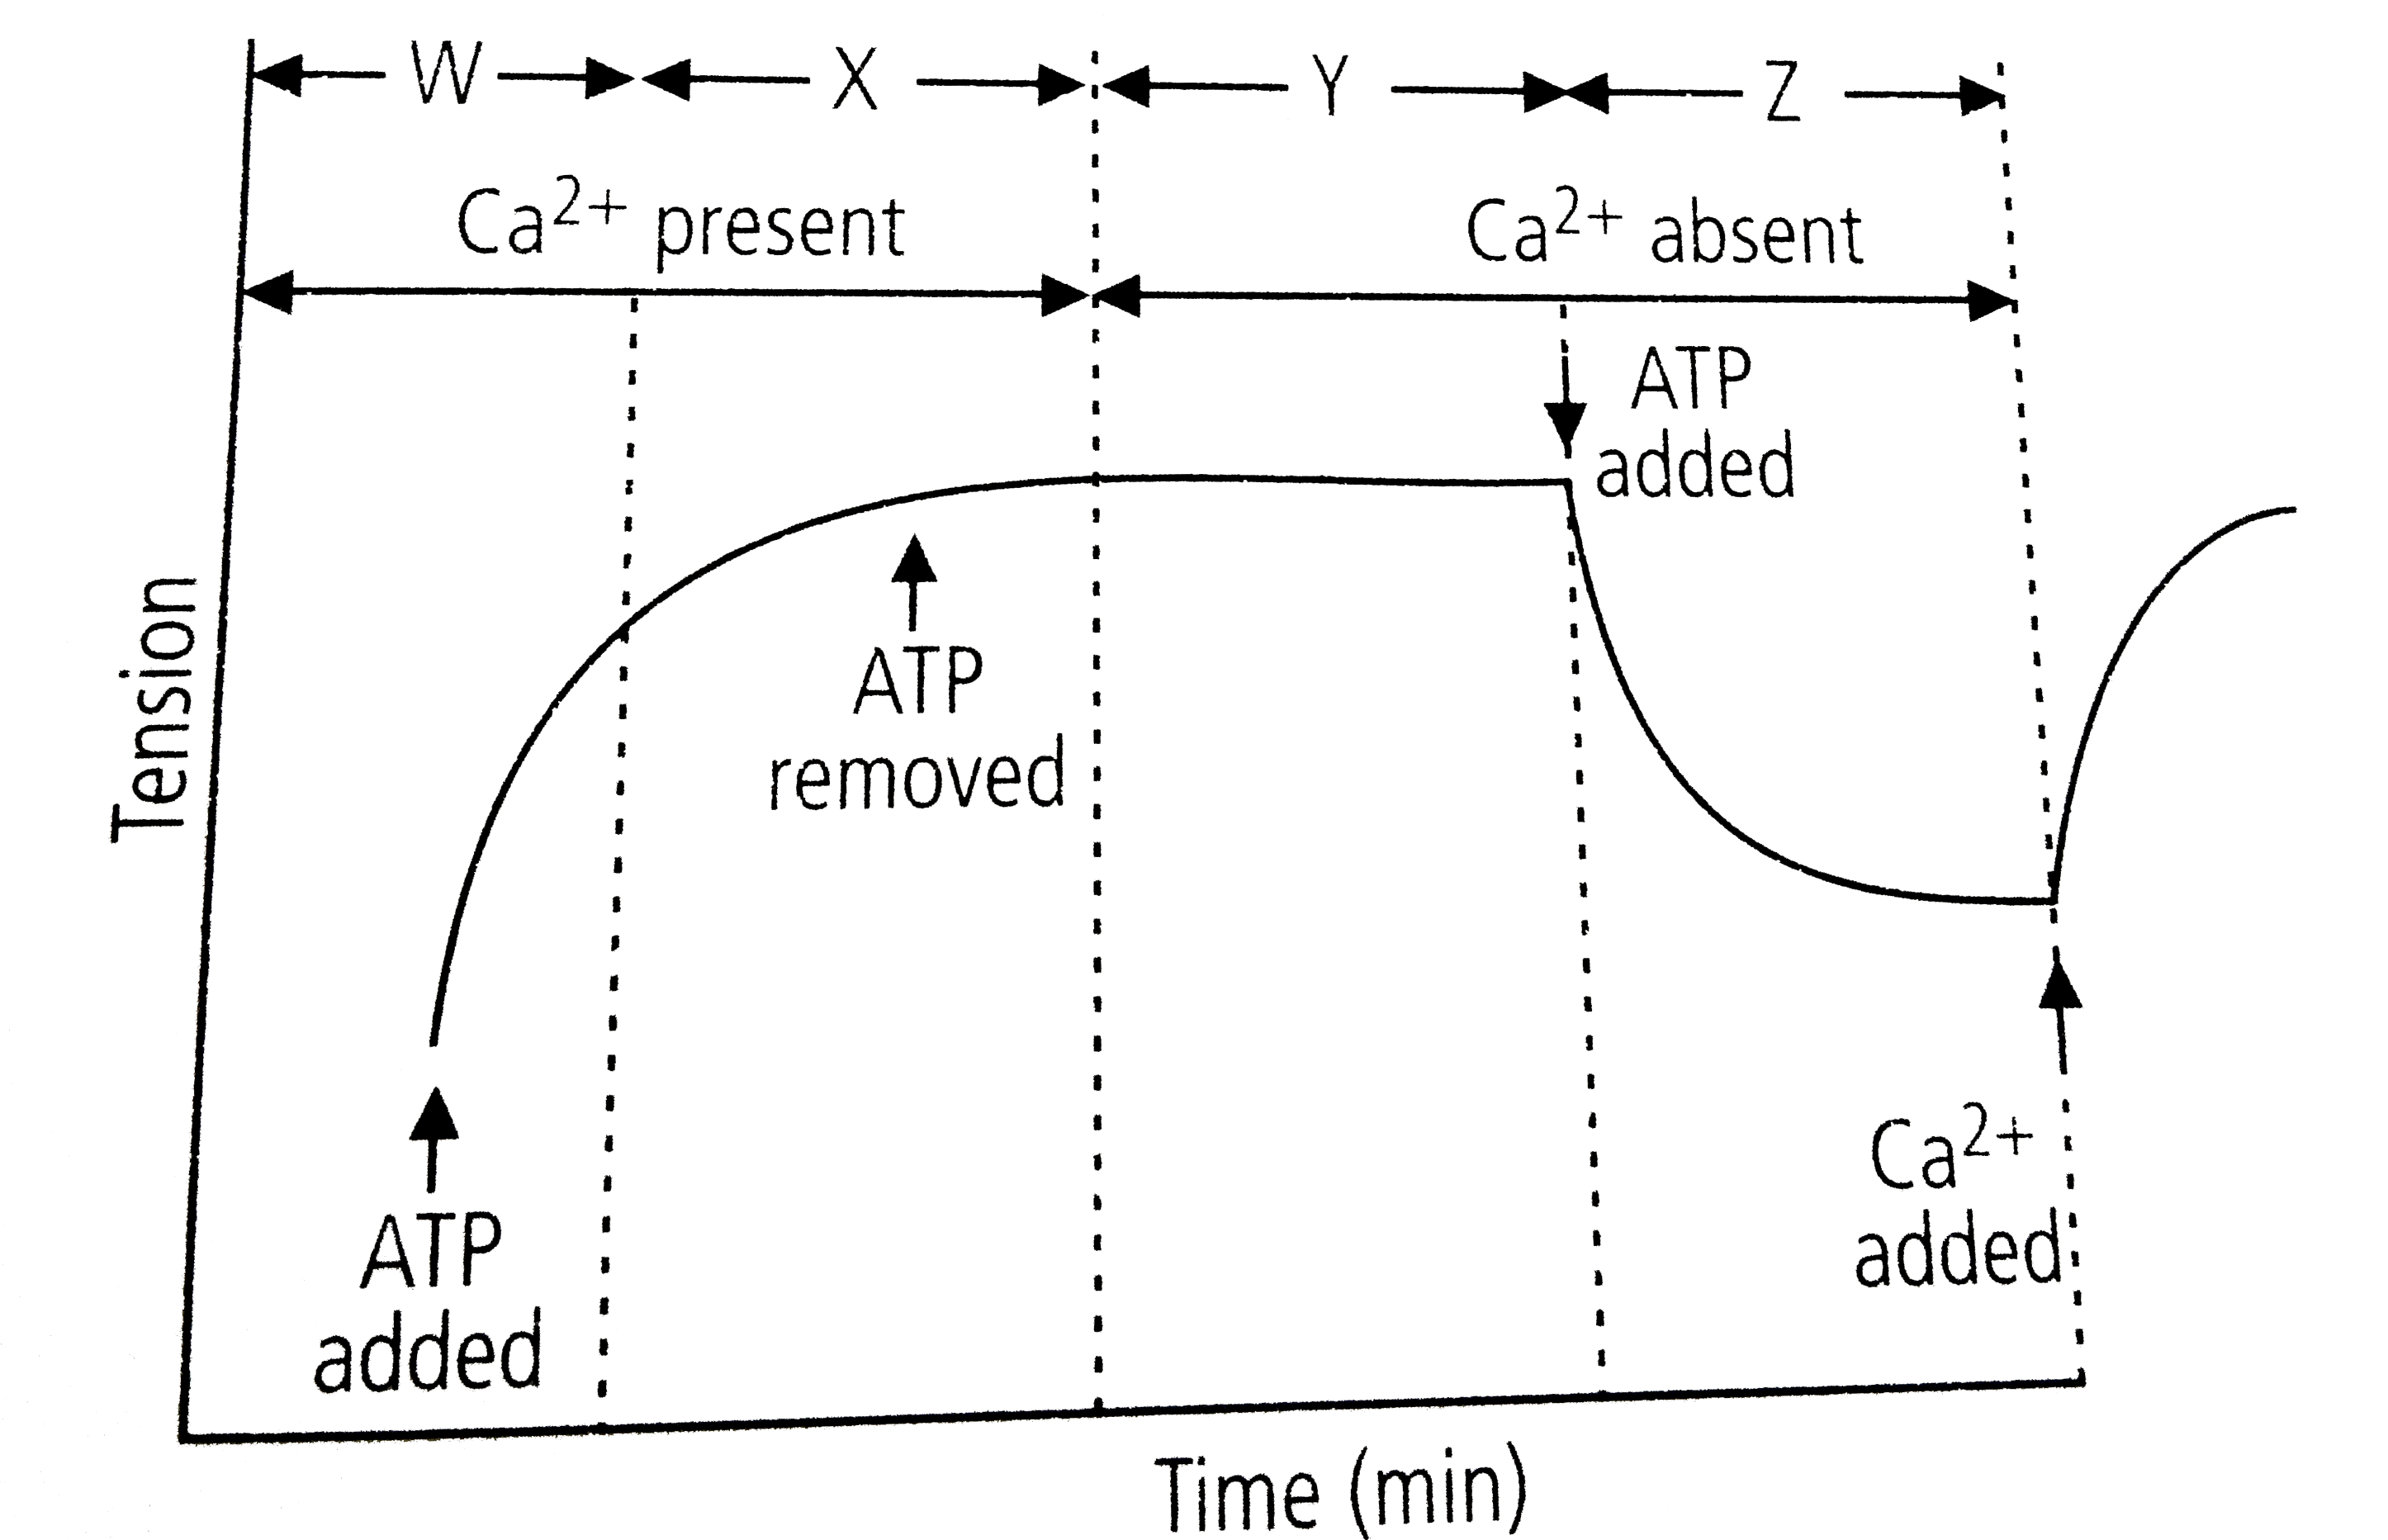
Which of the labelled parts on the graph represents rigor mortis?
View SolutionThe graph given here shows a car following the linear path with uniform speed. Study the graph and answer the questions.
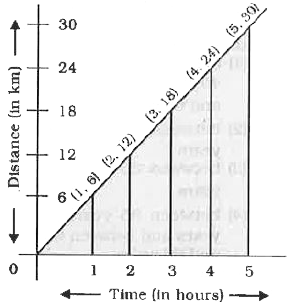
The speed of the car is
View Solution

