The graph shows the level of antibody in serum following vaccination and a challenge with the same antigen 28 days later.
Study the graphs below and answer the question:

What does peak A represents?
Video Solution
Text Solution
Level of IgM only. In a primary immune response, naive B cells are stimulated by antigen, become activated, and differentiate into antibody-secreting cells that produce antibodies specific for the eliciting antigen. A large amount of IgM and a small amount of IgG are produced during the primary immune response.
|
Updated on:21/07/2023
Similar Questions
Knowledge Check
- Question 1 - Select One
Study the following bar graph and answer the question that follows.
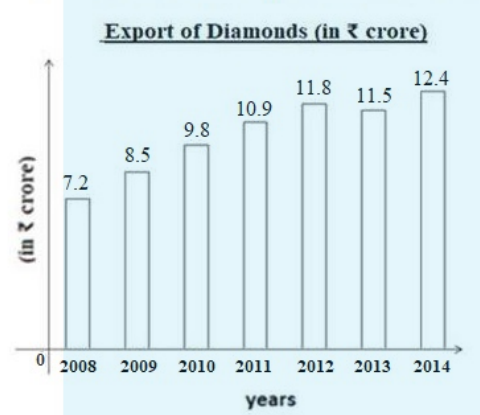
In which year was the maximin percentage increase in diamonds exports compared to the previous year?A2014B2009C2010D2012 - Question 2 - Select One
The following bar graph shows the games played by the students. Study the graph carefully and answer the question given below:
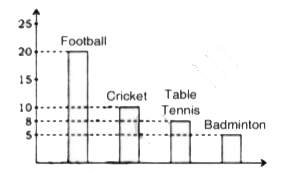
How many students play table tennis?A10B8C18D20 - Question 3 - Select One
The graph given here shows a car following the linear path with uniform speed. Study the graph and answer the questions.
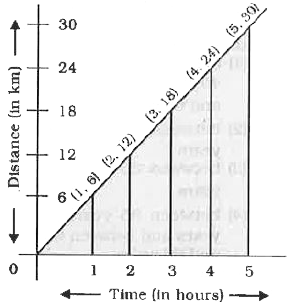
The speed of the car isA12 km/hrB6 km/hrC18 km/hrD24 km/hr
Study the bar graph and answer the following questions.
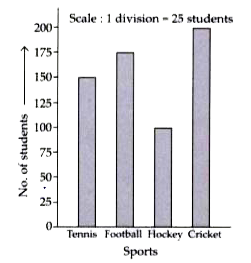
Which is the most popular sport ?View SolutionStudy the bar graph and answer the following questions.
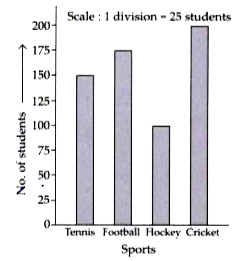
Which sport is preferred least ?View SolutionThe following graph shows the sales of cars (in thousands) in four cities in 4 years. Study the graph and answer the question
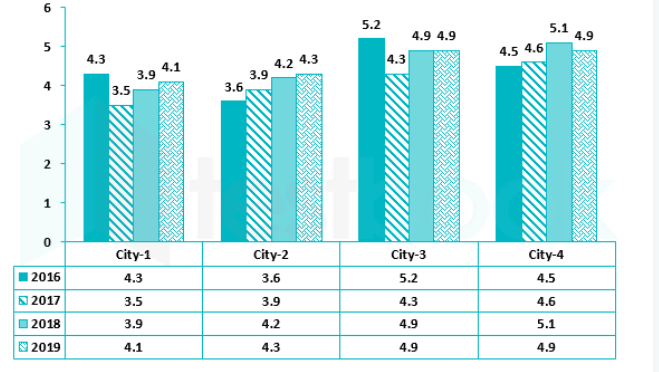
In which year. the sales are highest?View SolutionThe following graph shows the sales of cars (in thousands) in four cities in 4 years. Study the graph and answer the question.
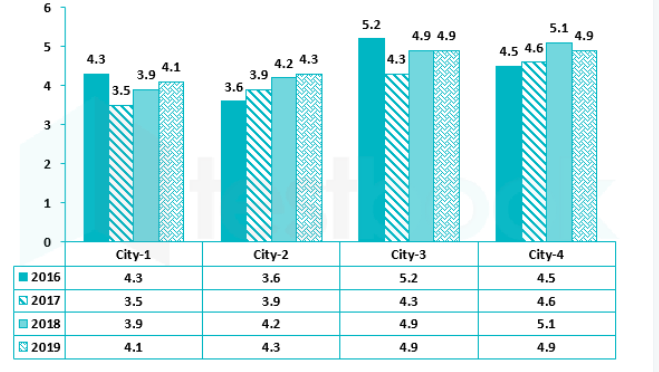
Which city has the highest sales?View SolutionThe following graph represents the transport used by children. Study the graph and answer the given questions.
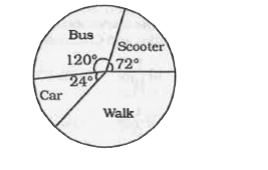
What is the percentage of children using scooter ?View Solution

