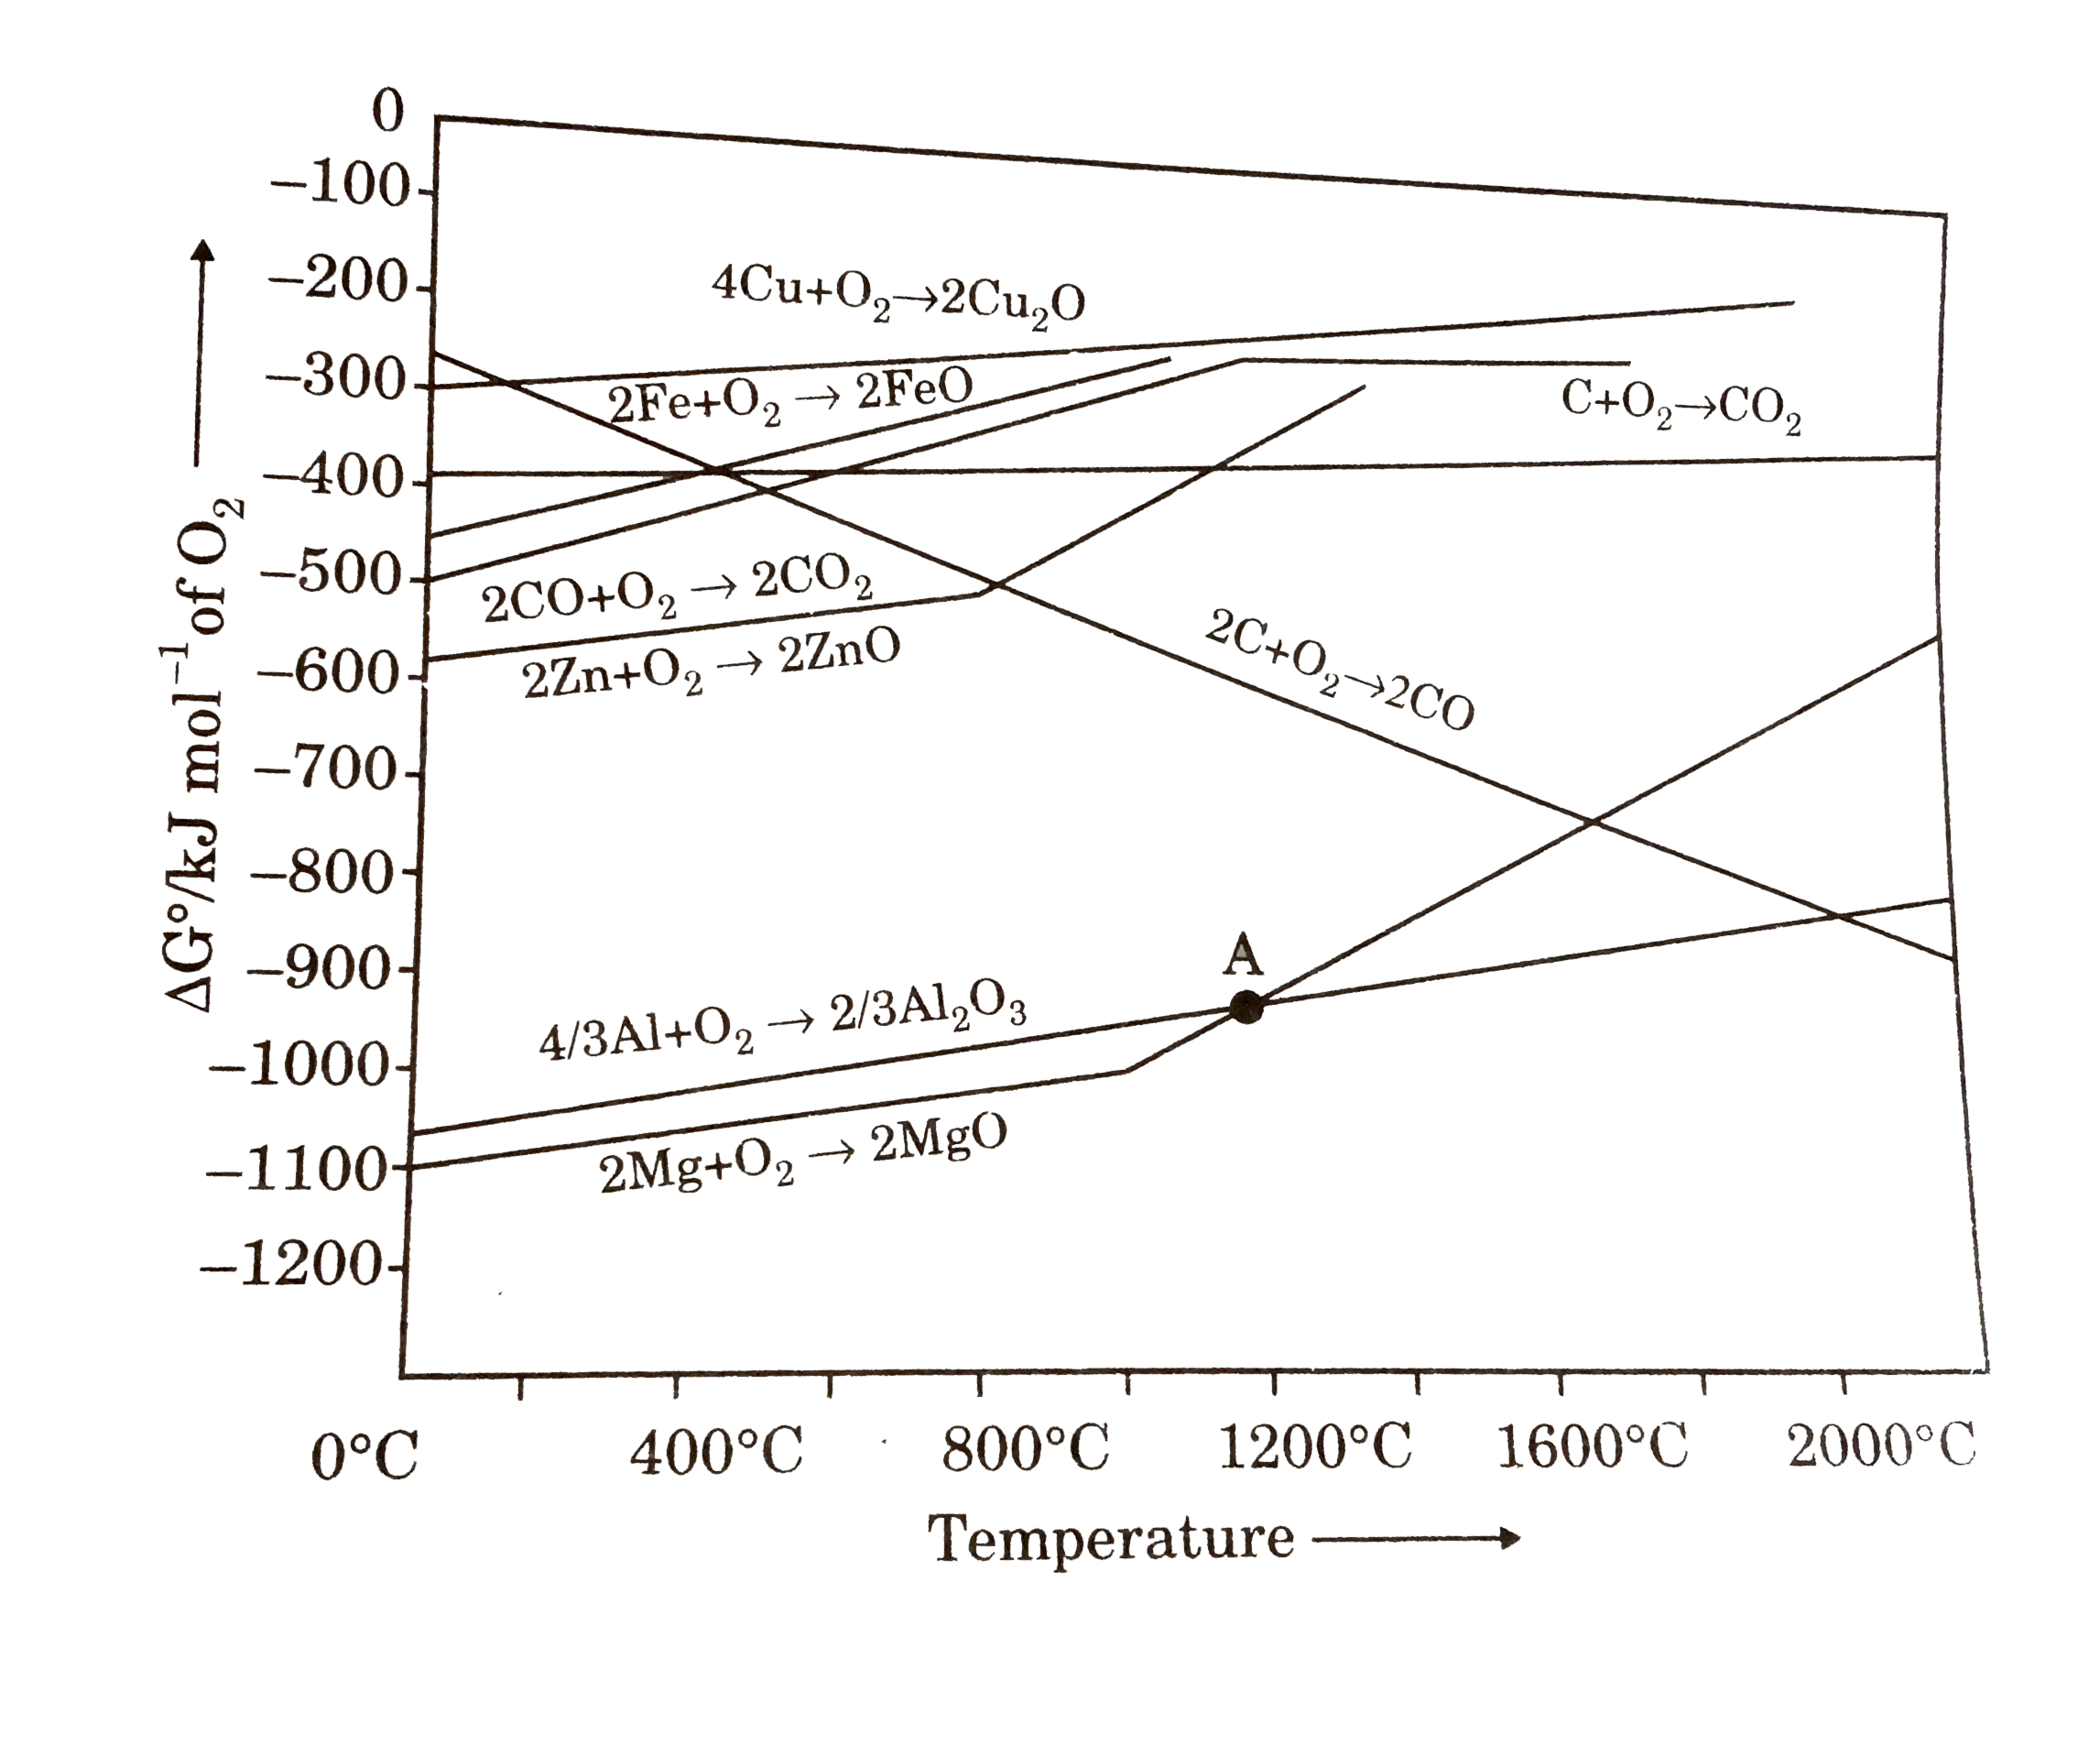
The graph shows the level of antibody in serum following vaccination and a challenge with the same antigen 28 days later.
Study the graphs below and answer the question:

Which of the following graphs depicts primary immune response?
Video Solution
Text Solution
Graph, primary immune response is the reaction of the immune system when it contacts an antigen for the first time.
|
Updated on:21/07/2023
Similar Questions
Knowledge Check
- Question 1 - Select One
Study the graph carefully and answer the following questions.
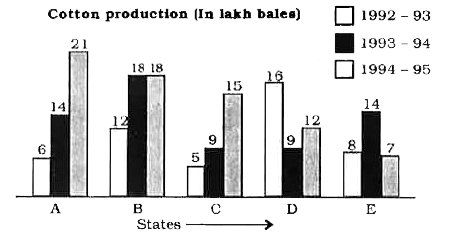
Which of the following statement is false ?AState A and E showed the same production in 1993-94.BThere was no improvement in the production of cotton in state B during 1994-95.CState A has produced maximum cotton during the given period.DProduction of state C and D together is equal to that of state B dring 1993-94. - Question 2 - Select One
Study the following bar graph and answer the question that follows.
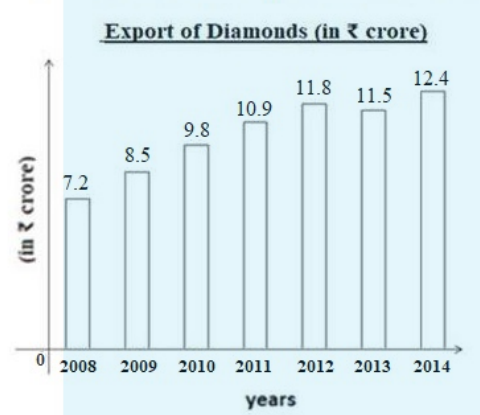
In which year was the maximin percentage increase in diamonds exports compared to the previous year?A2014B2009C2010D2012 - Question 3 - Select One
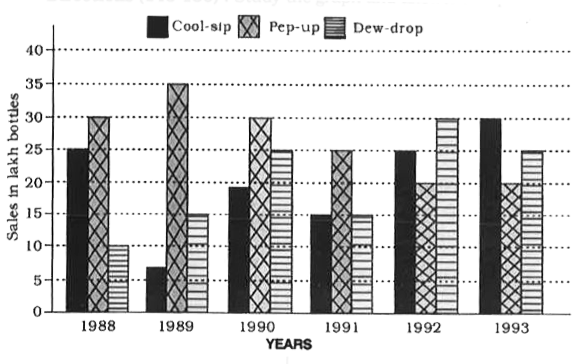
Study the graph and answer the questions.
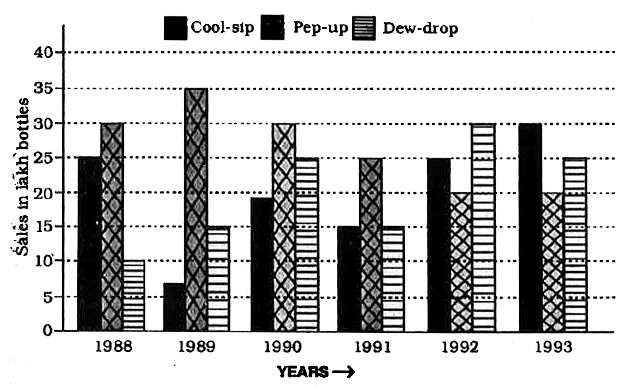
In which year the sale of cool-sip is minimum ?A1990B1992C1993DNone of the above
Study the graph and answer the questions.
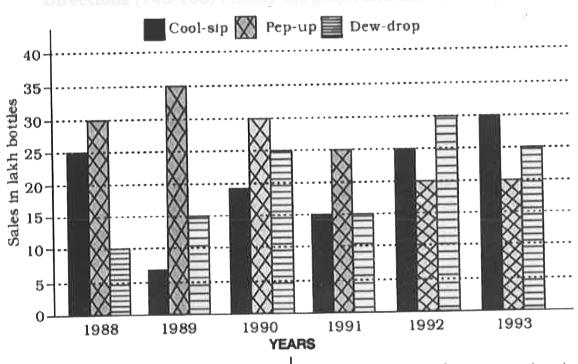
In which year sale of Dew -drop is maximum ?View SolutionStudy the bar graph and answer the following questions.
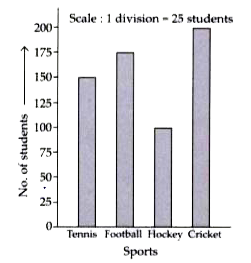
Which is the most popular sport ?View SolutionStudy the bar graph and answer the following questions.
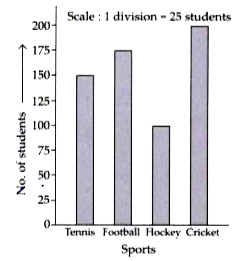
Which sport is preferred least ?View SolutionWhich one of the following depicts the graph of an odd function?
View SolutionStudy the graph and answer the questions.
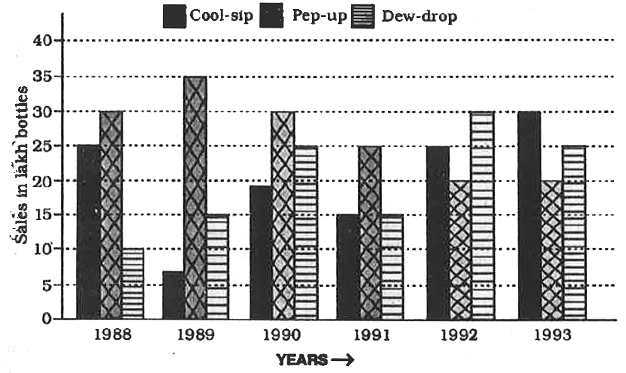
In which year sale of Drew-drop is maximum ?View Solution

