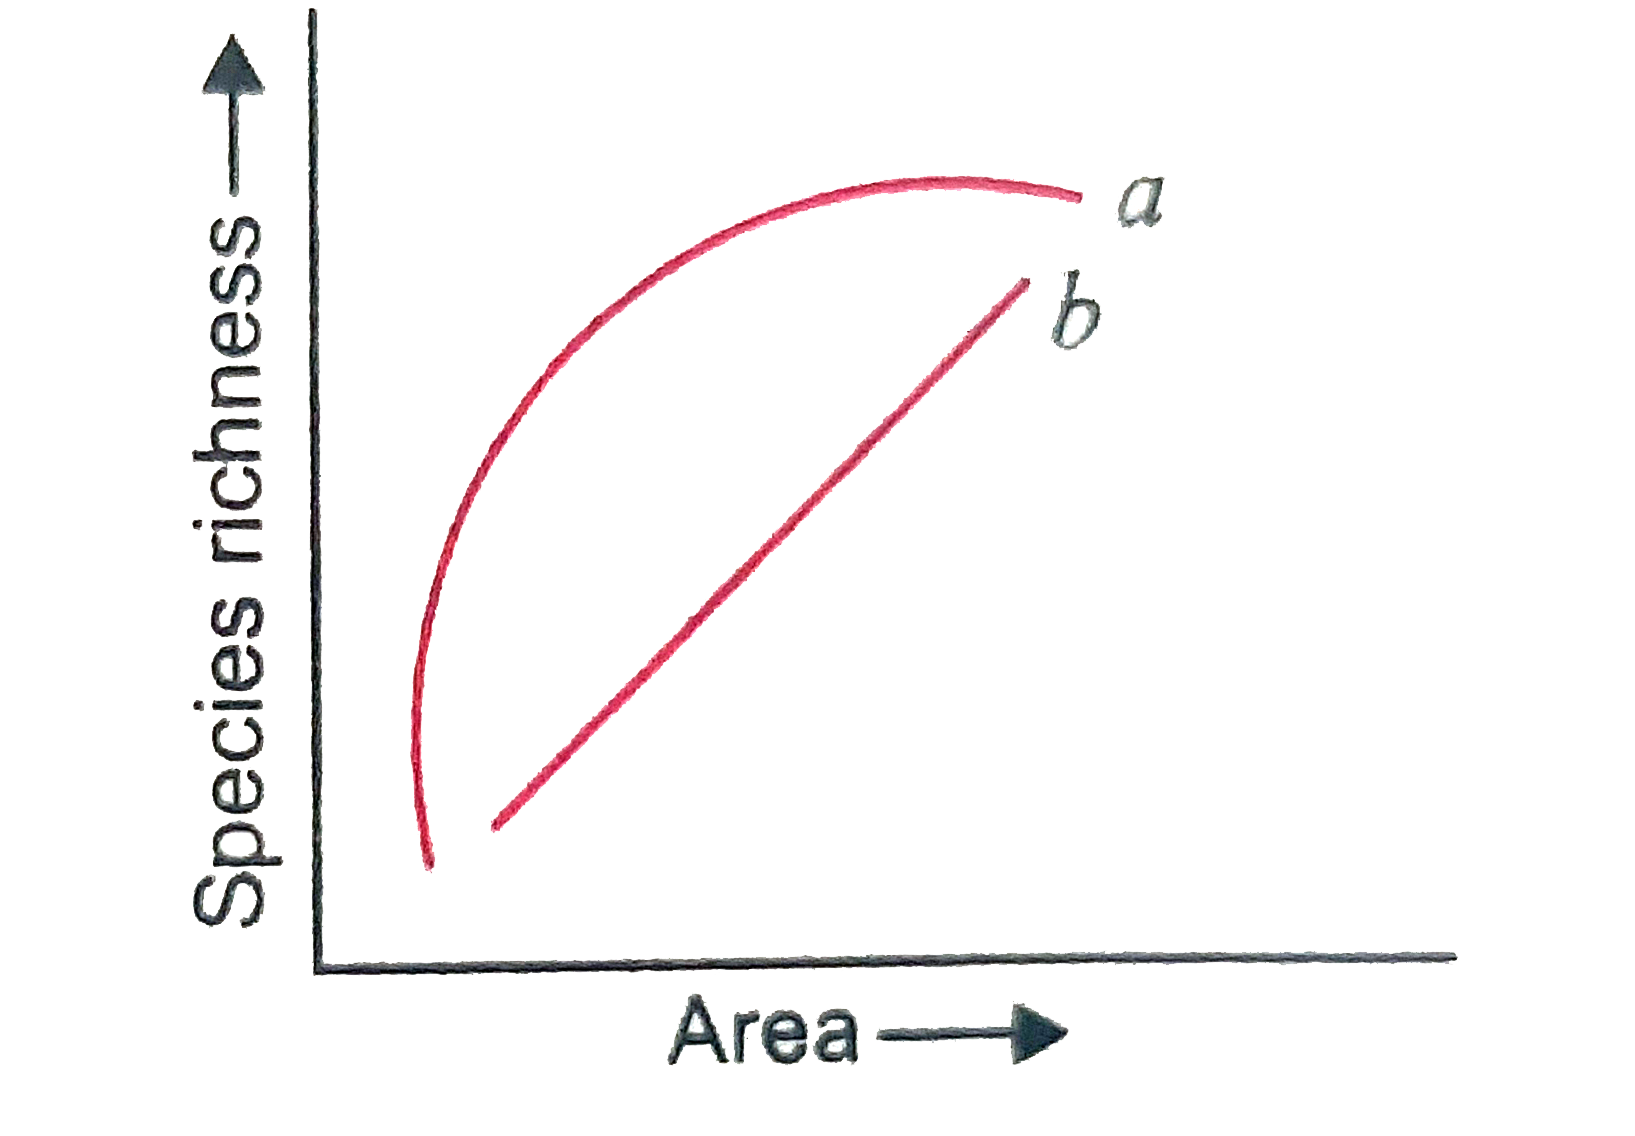
The graph given alongside shows the species area relationship. Study the graph and answer the question:
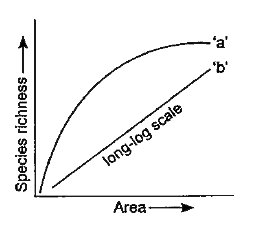
Identify the situation when Z values are in the range of 0.6 to 1.2.
Ecologists have discovered that the value of Z lies in the range of 0.1 to 0.2, regardless of the taxonomic group or the region (whether it is the plants in Britain, birds in California or molluscs in New York state, the slopes of the regression line are amazingly similar). But, if we analyse the species-area relationships among very large areas like the entire continents, the slope of the line to be much steeper (Z values in the range of 0.6 to 1.2).
Similar Questions
Knowledge Check
The graph given here shows a car following the linear path with uniform speed. Study the graph and answer the questions.
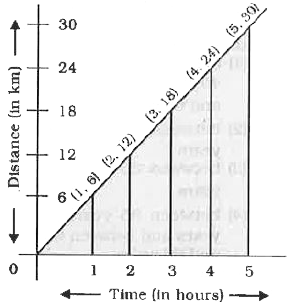
The speed of the car isA12 km/hrB6 km/hrC18 km/hrD24 km/hrThe graph given below the daily income of 50 workers in a factory. Study the graph and answer the questions.
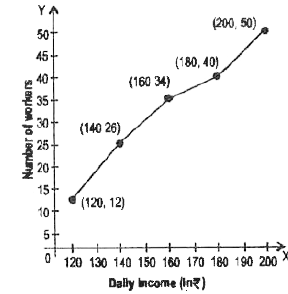
The median wages in the factory isARs 140BRs 138CRs 150DRs 160The given bar graph shows the biscuit exports of India over a period of five years. Study the graph and answer the questions that follows
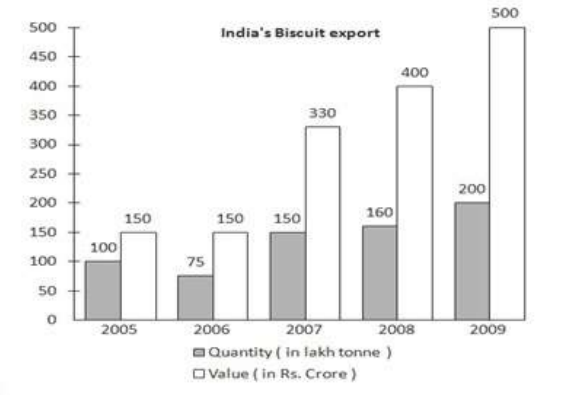
In which two year was the value per tonne equal?A2006 and 2007B2008 and 2009C2007 and 2008D2005 and 2006
The graph shows Income and Expenditure of a company. Study the graph and answer the questions.
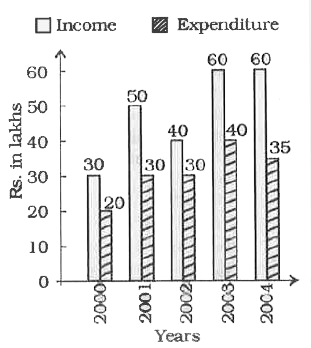
The profit was maximum in the year
View SolutionThe graph given here shows a car following the linear path with uniform speed. Study the graph and answer the questions.
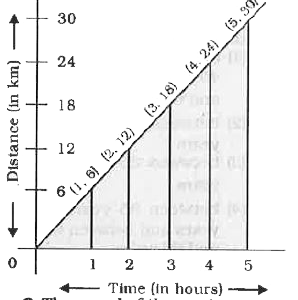
The speed of the car (in metres per minute) is
View SolutionThe graph given here shows a car following the linear path with uniform speed. Study the graph and answer the questions.
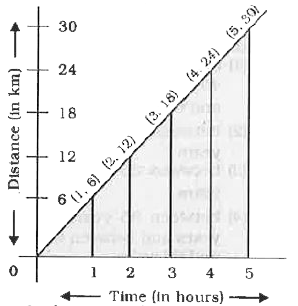
The distance travelled by the car in 4.5 hours is
View SolutionThe graph given here shows a car following the linear path with uniform speed. Study the graph and answer the questions.
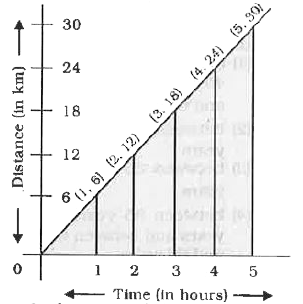
The car covers a distance of 15 kilometres in
View SolutionStudy the information given in each of these question to answer the questions
Study the graph and answer the question given below-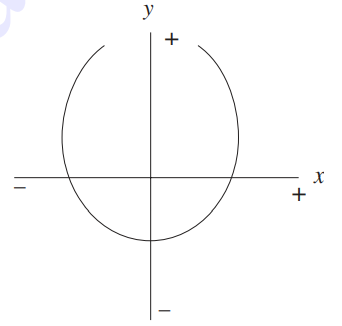
Which of the following is true about the value of x and y in the graph ?
View Solution

