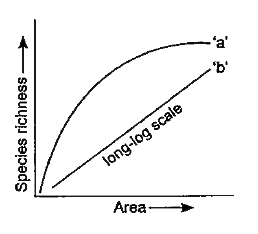
The graph given alongside shows the species area relationship. Study the graph and answer the question:
Name the region he explored.
Alexander von Humboldt explored wilderness of South American jungles.
Similar Questions
The graph shows Income and Expenditure of a company. Study the graph and answer the questions.
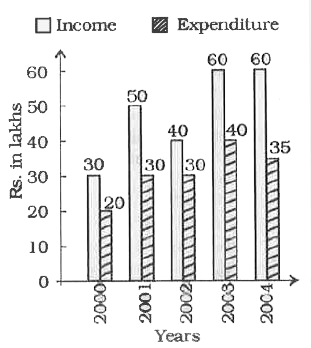
The profit was maximum in the year
View SolutionThe graph shows Income and Expenditure of a company. Study the graph and answer the questions.
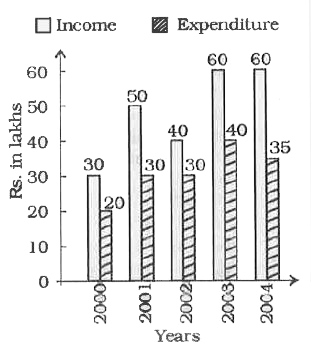
The income in 2002 was equal to the expenditure in the year
View Solution
Knowledge Check
Study the graph and answer the questions.
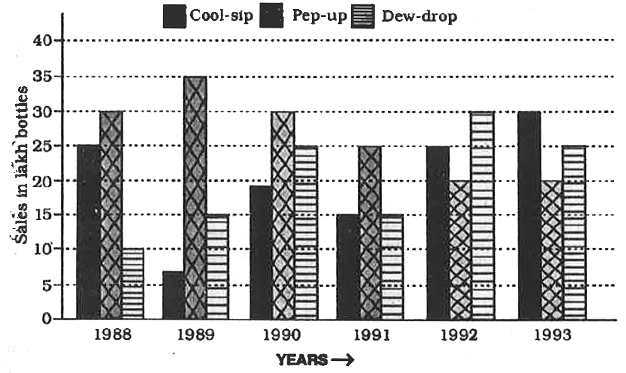
In which year sale of Drew-drop is maximum ?A1998B1992C1989D1993Study the following bar graph and answer the question that follows.
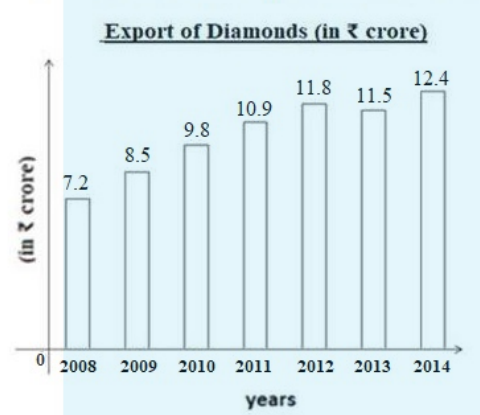
In which year was the maximin percentage increase in diamonds exports compared to the previous year?A2014B2009C2010D2012The graph given here shows a car following the linear path with uniform speed. Study the graph and answer the questions.
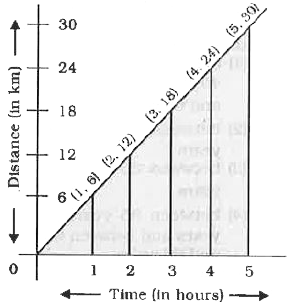
The speed of the car isA12 km/hrB6 km/hrC18 km/hrD24 km/hr
The graph given here shows a car following the linear path with uniform speed. Study the graph and answer the questions.
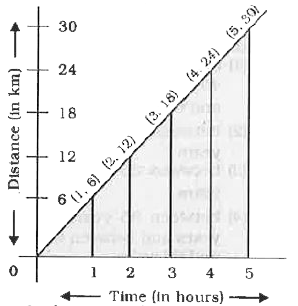
The distance travelled by the car in 4.5 hours is
View SolutionThe graph given here shows a car following the linear path with uniform speed. Study the graph and answer the questions.
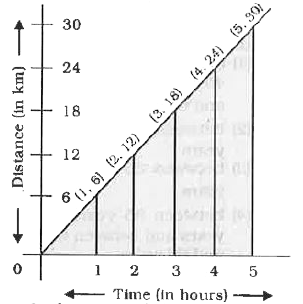
The car covers a distance of 15 kilometres in
View SolutionThe graph given here shows a car following the linear path with uniform speed. Study the graph and answer the questions.
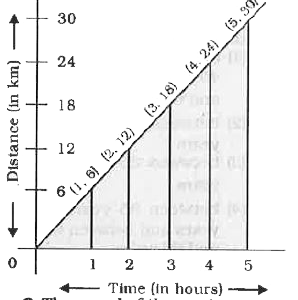
The speed of the car (in metres per minute) is
View SolutionThe graph given below the daily income of 50 workers in a factory. Study the graph and answer the questions.
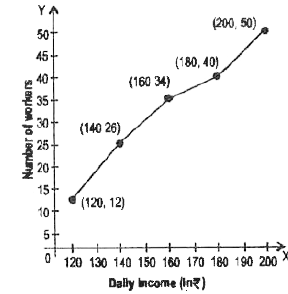
The median wages in the factory is
View SolutionThe given bar graph shows the biscuit exports of India over a period of five years. Study the graph and answer the questions that follows
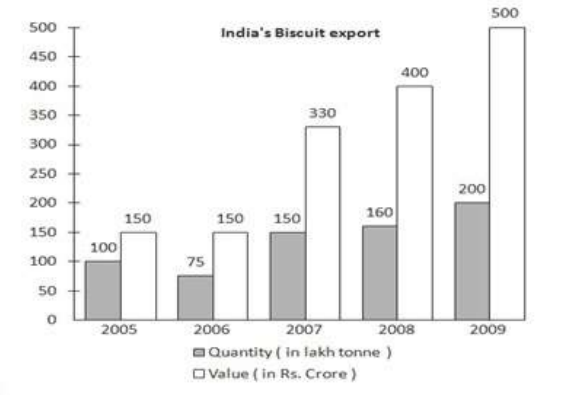
In which two year was the value per tonne equal?
View Solution
