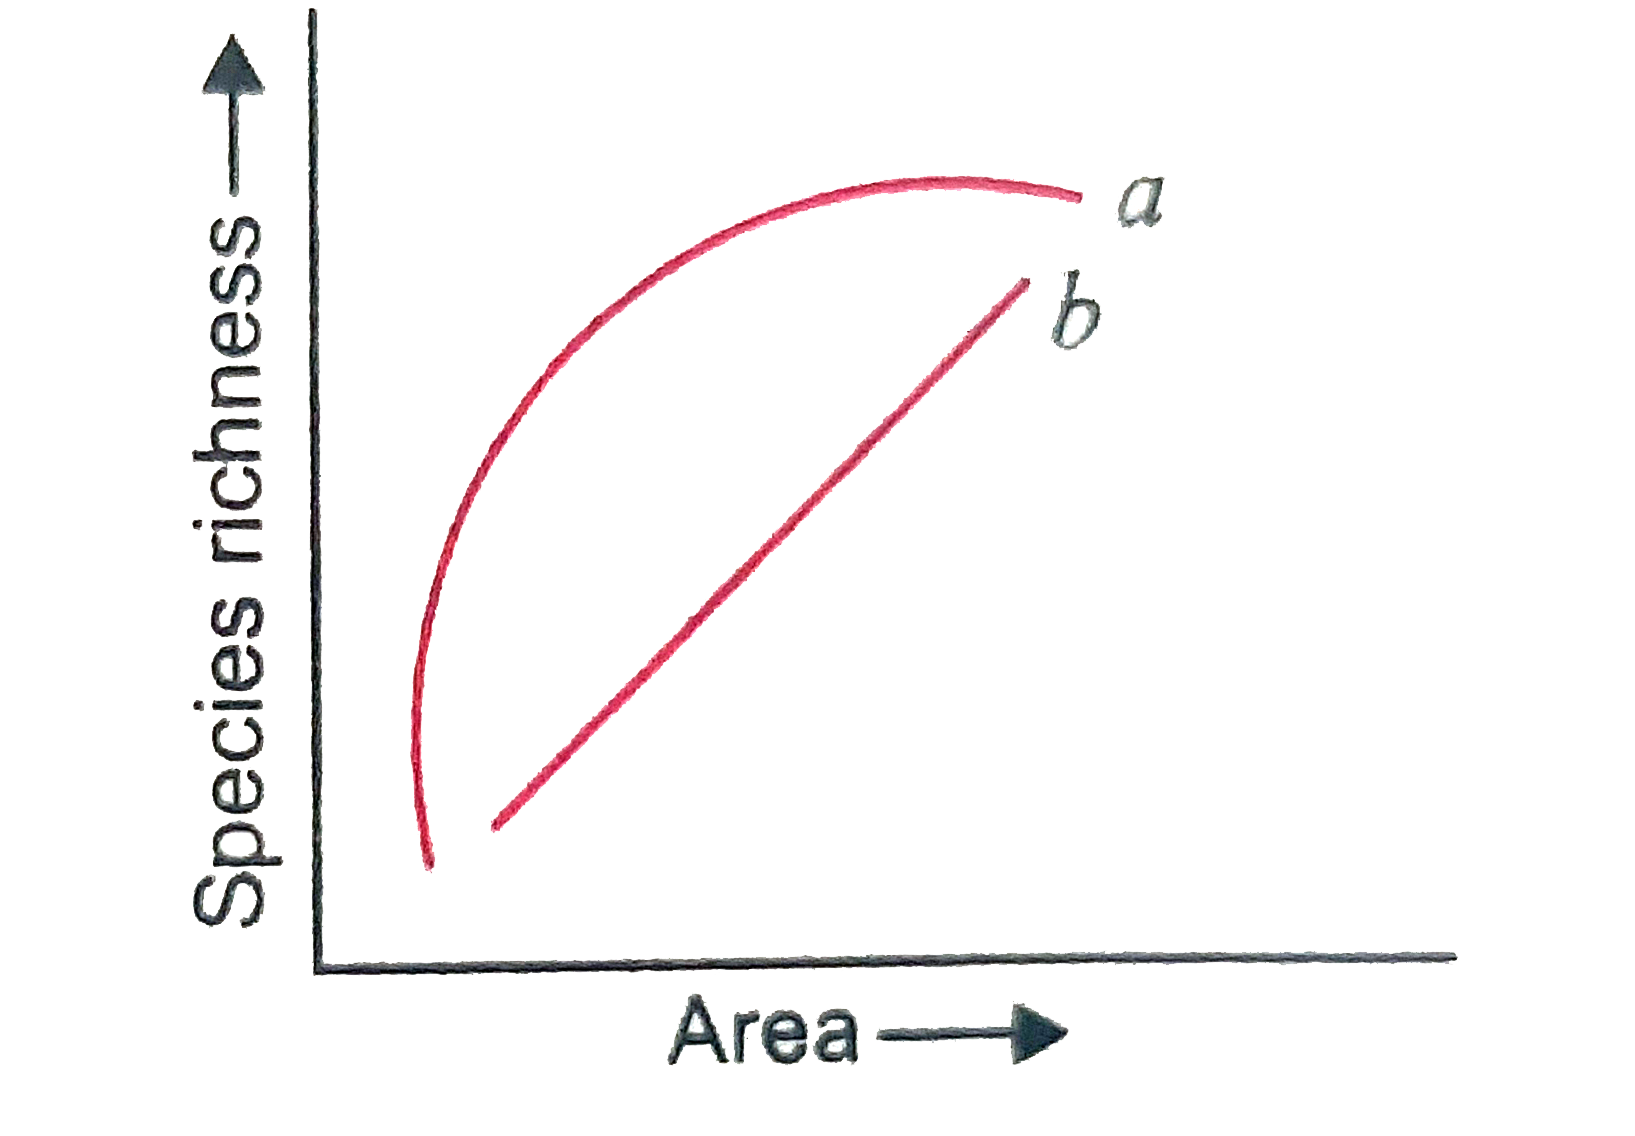
The graph given below shows the species-area relationship. Answer the following question as directed:
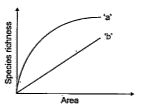
When would the slope of the line 'b' become steeper?
The slope of the line .b. becomes steeper when the species richness will be between 0.6 to 1.2.
Similar Questions
Knowledge Check
If we analyse the species-area relationships among very large areas like the entire continents, then slope of line becomes much steeper in the range of
A0.1 to 0.6B0.1 to 0.2C0.6 to 1.2D0.2 to 0.6
Answer the following questions below :
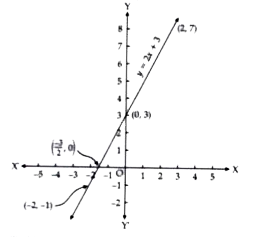
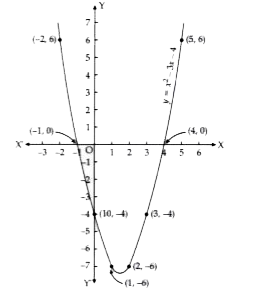 Name the shape of the graph .
View SolutionThe following graph shows the species area relationship. Answers the Questions as directed.
(a) Name the naturalist who studied the kind of relationship shown in the graph.
Write the observations made by him.
(b) Write the situations as discovered by the ecologists when the value of 'Z' (slope of the line) lies between
(i) 0.1 and 0.2, (ii) 0.6 and 1.2
What does 'Z' stand for ?
(c ) When would the slope of the line 'b' become steeper ?
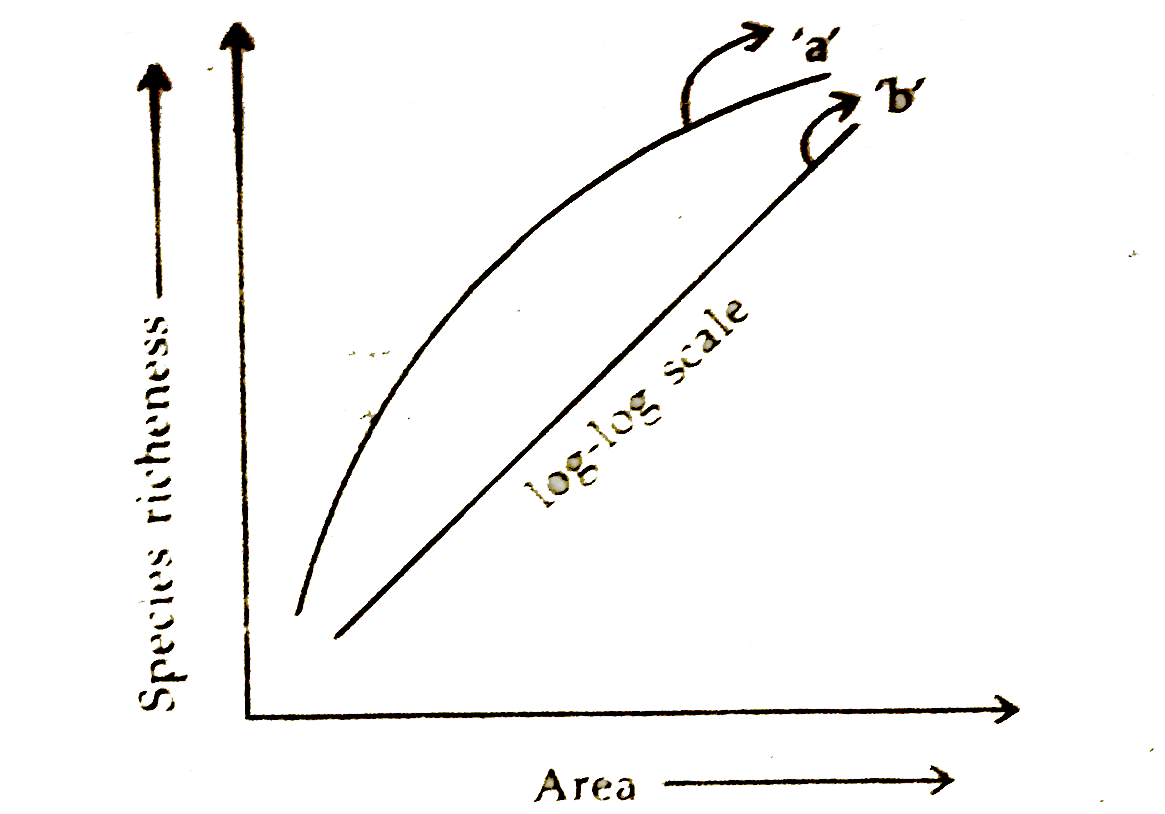
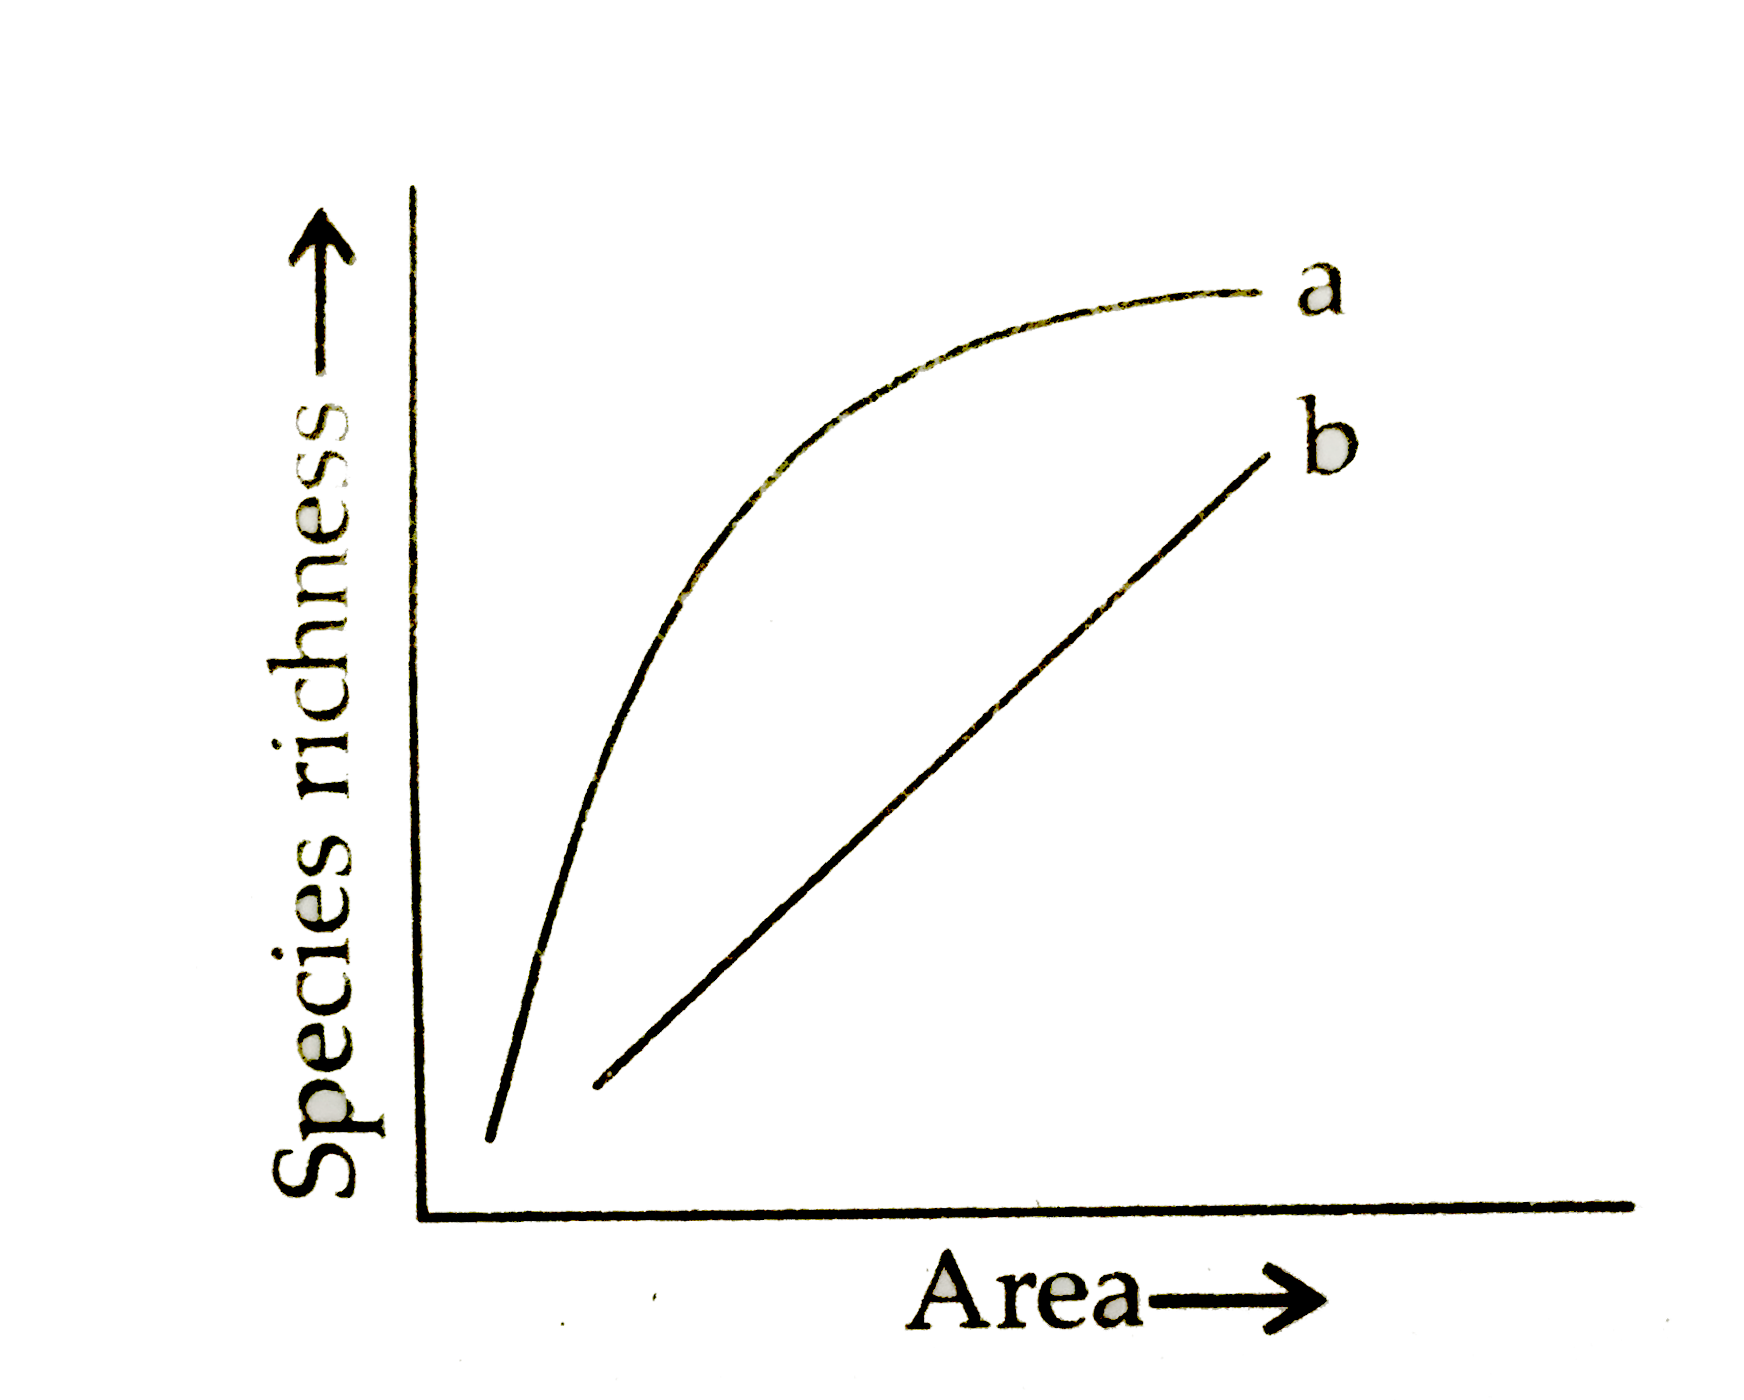
View SolutionThe given graph shows species-area relationship. Write the equation of the curve 'a' and explain.
View SolutionThe above graph show Species-Area relationship. Write the equation of the curve a and explain.
View SolutionRead the bar graph given below and answer the following questions:
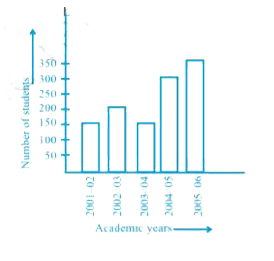
What information is given by the þar graph?
View SolutionRead the bar graph given below and answer the following questions:

In which year is the number of students maximum?
View SolutionRead the bar graph given below and answer the following questions:

In which year is the number of students twice as that of 2001-02?
View Solution

