The given bar graph shows the number of pupils who participated in the fitness test on different days of the week.
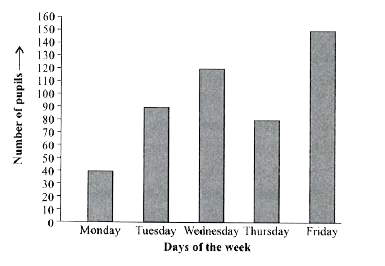
What percentage of the total number of pupils had their fitness test on Wednesday ?
30%
25%
22.5%
27.5%
The correct Answer is:B
Step by step video, text & image solution for The given bar graph shows the number of pupils who participated in the fitness test on different days of the week. What percentage of the total number of pupils had their fitness test on Wednesday ? by Maths experts to help you in doubts & scoring excellent marks in Class 7 exams.
Topper's Solved these Questions
- BOOK - SCIENCE OLYMPIAD FOUNDATION CHAPTER - IMO QOESTION PAPER 2017-18 SET-BEXERCISE - EVERYDAY MATHEMATICS10videos
IMO QOESTION PAPER 2017-18 SET-B
- BOOK - SCIENCE OLYMPIAD FOUNDATION CHAPTER - IMO MODEL TEST PAPER 2 EXERCISE - Achievers Section5videos
IMO MODEL TEST PAPER 2
- BOOK - SCIENCE OLYMPIAD FOUNDATION CHAPTER - IMO QUESTION PAPER 2017-18 SET AEXERCISE - ACHIEVERS SECTION5videos
IMO QUESTION PAPER 2017-18 SET A
Similar Questions
the given bar graph shows the numbers of puspils who participated in the fitness test in different days of the week .
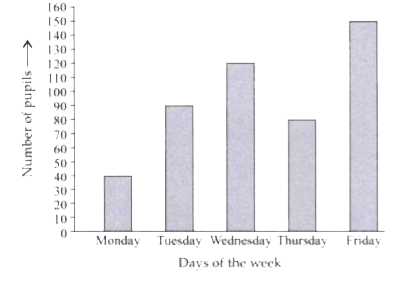
what percentage of the total number of puipil had their test on Wednesday ?View SolutionThe given bar graph, shows the number of students in different classes.
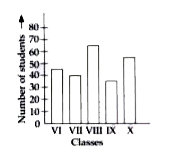
Find the total number of students in the classes VIII to X.View Solution
Knowledge Check
- Question 1 - Select One
The Bar graph given below presents the number of female employees working in two factories on six different days of a week.
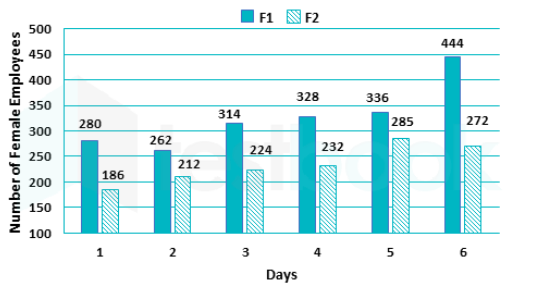
On which day the number of female workers in the factories Fl and F2, taken together, is the second highest?AA) D3BB) D6CC) D5DD) D4 - Question 2 - Select One
The Bar graph given below presents the number of cars parked on ten different days in a parking area
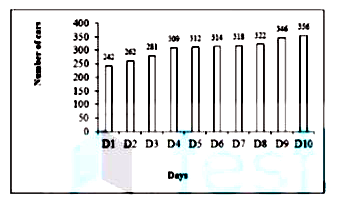
What is the total number of cars parked on all the ten days in the parking area ?AA) 3862BB) 3062CC) 3462DD) 3882
The given bar graph shows the marks obtained by students in a Science test.
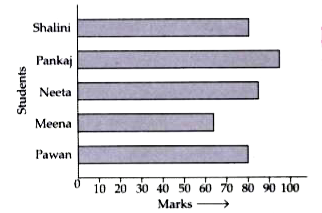
Who scored the highest marks in the test ? Whats in the score ?View SolutionThe given bar graph, shows the number of students in different classes.
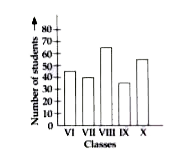
Arrange the classes in descending order of student population.View Solution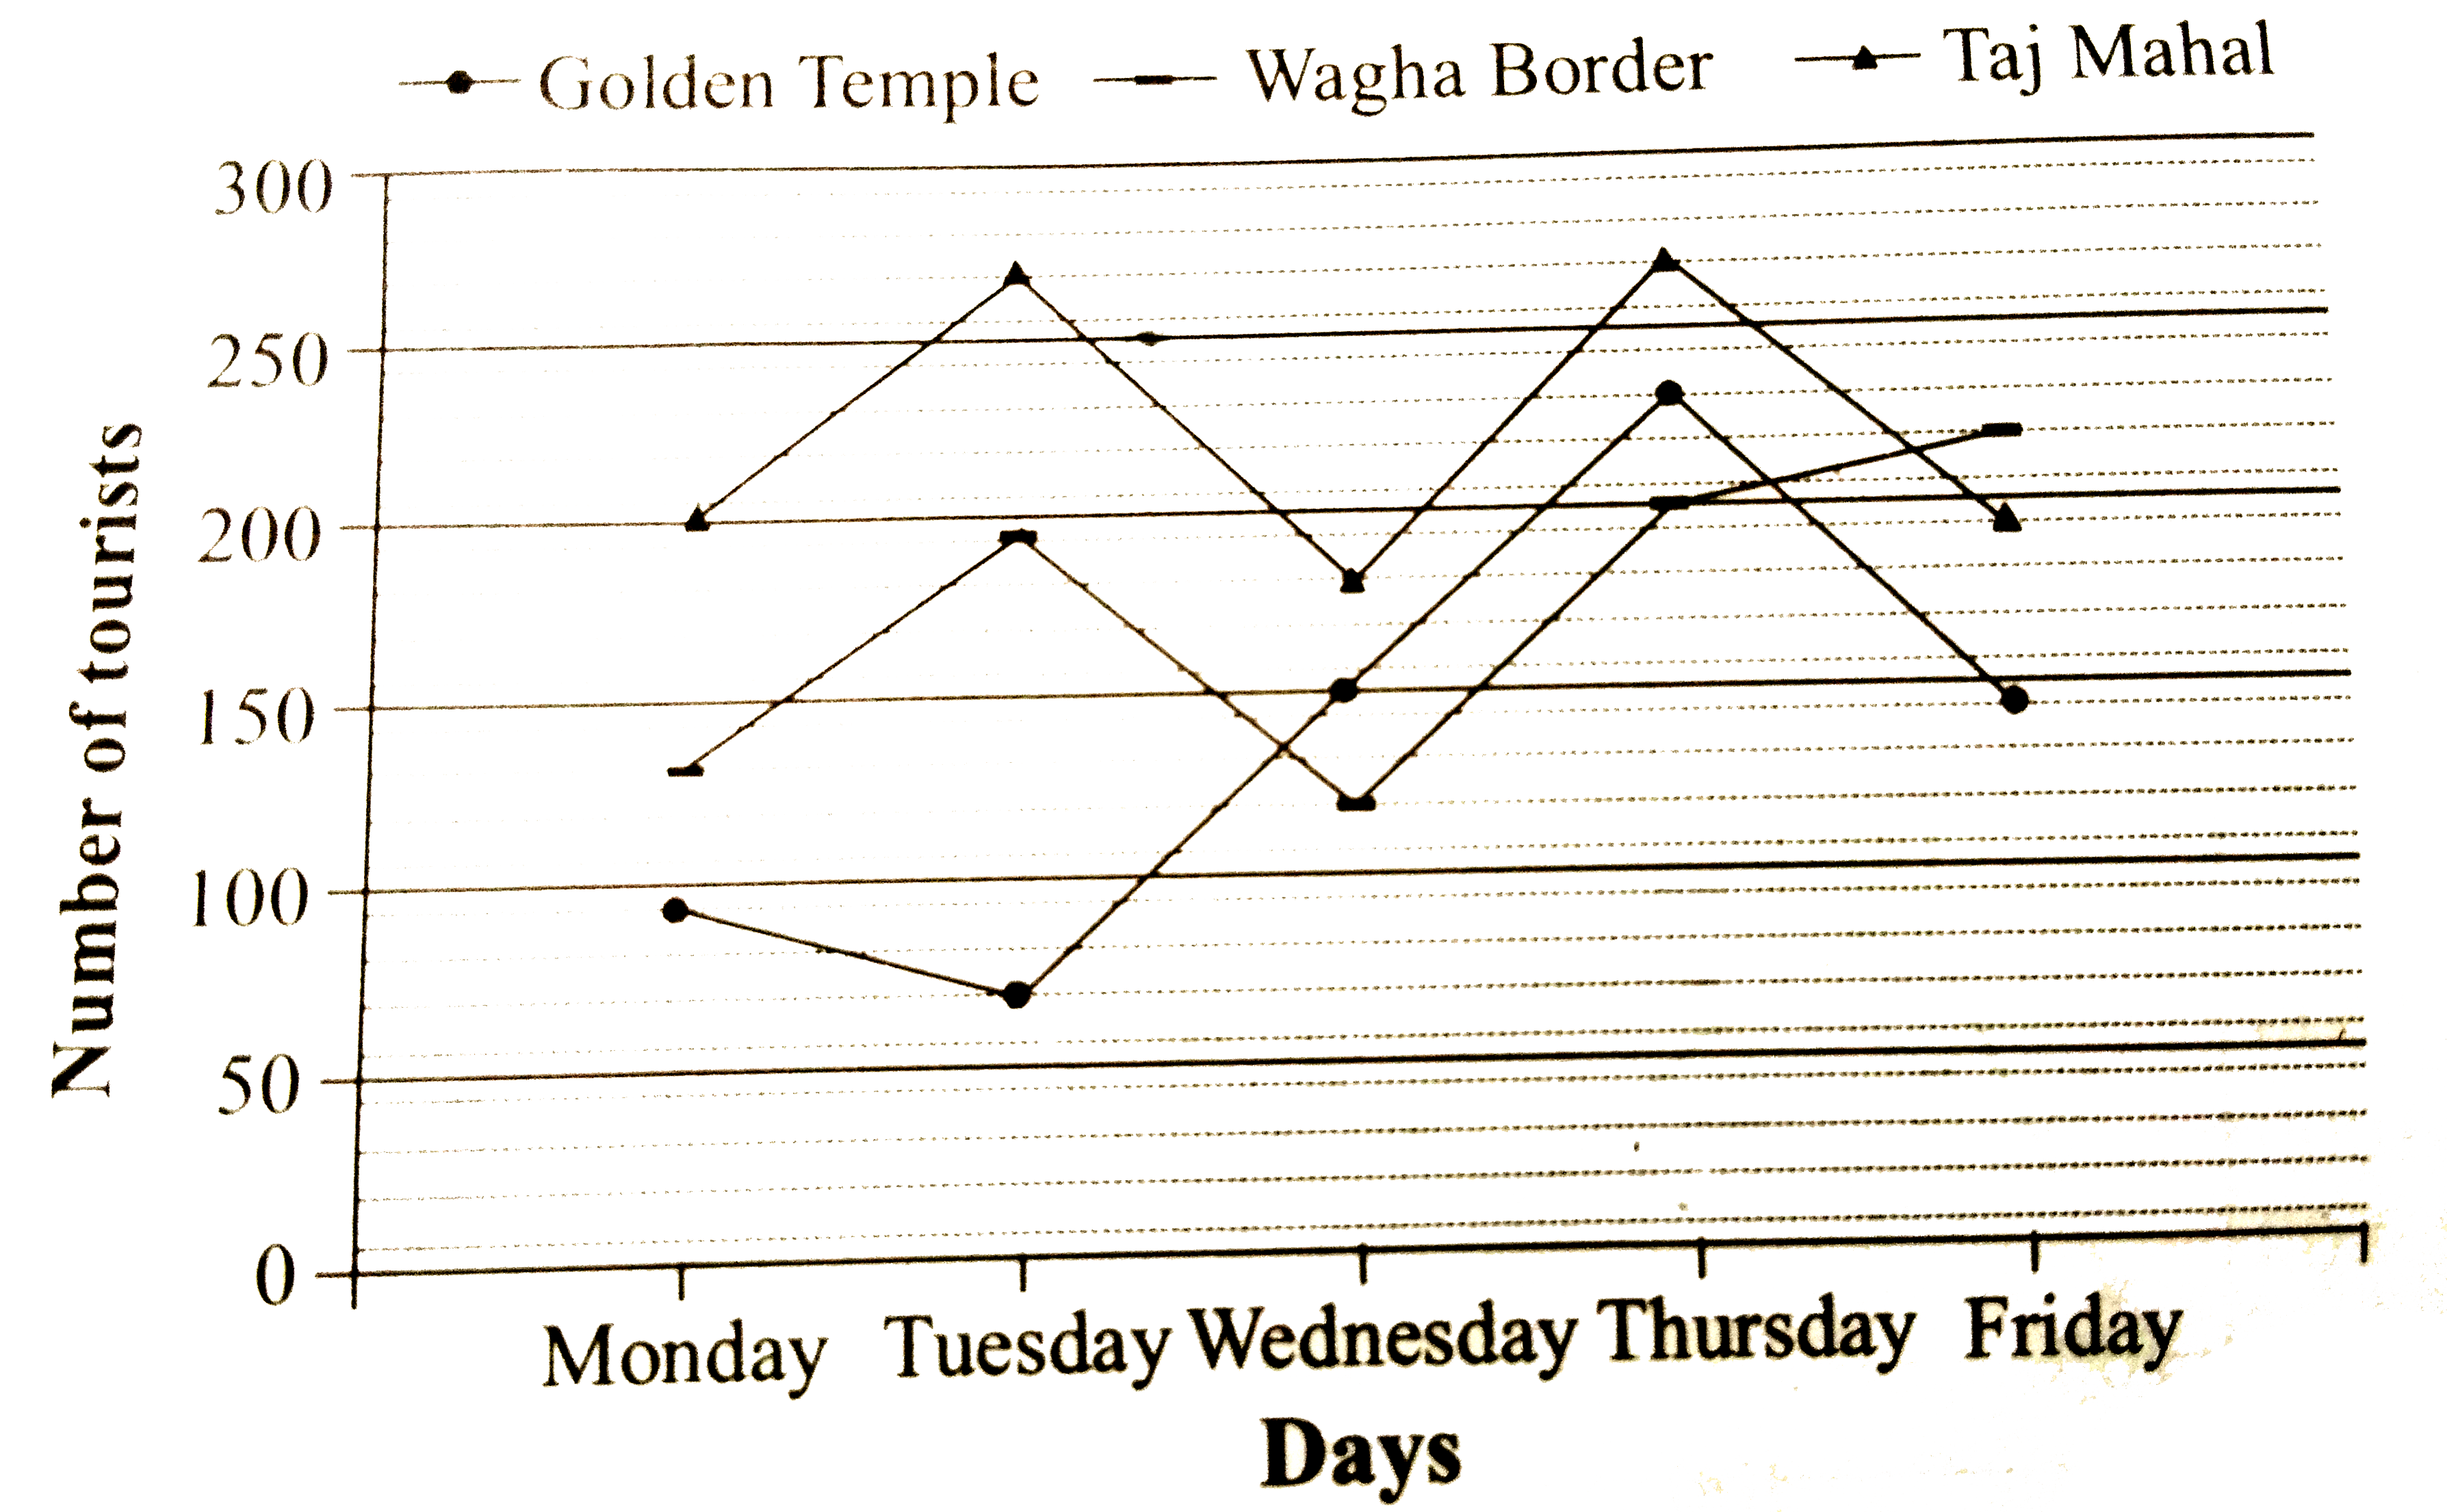
Total number of foreign tourists who visited all three places on Tuesday together is what per cent of the total number foreign tourists who visited Wagha Border on Monday and Wednesday together ?View SolutionAnswer the questions based on the information given below:
The given cascade bar graph provides the information about the number of girls and boys participated in a dance competition of NH Goel school on five different days of a week and the table give the details about the percentage of students participated on different days who lost the competition.
Total number of students participated in a day = Number of girls participated in a day + Number of boys participated in a day
Total number of students participated = Total number of students who lost the competition participated + Total number of students who won the competition participated
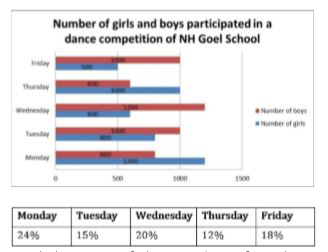
Find the ratio of the number of students who lost the competition on Tuesday to the number of students who won the competition on Wednesday.View SolutionAnswer the questions based on the information given below:
The given cascade bar graph provides the information about the number of girls and boys participated in a dance competition of NH Goel school on five different days of a week and the table give the details about the percentage of students participated on different days who lost the competition.
Total number of students participated in a day = Number of girls participated in a day + Number of boys participated in a day
Total number of students participated = Total number of students who lost the competition participated + Total number of students who won the competition participated
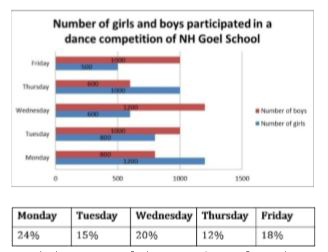
Find the ratio between the number of students who won on Wednesday to the number of students who won on ThursdayView SolutionAnswer the questions based on the information given below:
The given cascade bar graph provides the information about the number of girls and boys participated in a dance competition of NH Goel school on five different days of a week and the table give the details about the percentage of students participated on different days who lost the competition.
Total number of students participated in a day = Number of girls participated in a day + Number of boys participated in a day
Total number of students participated = Total number of students who lost the competition participated + Total number of students who won the competition participated
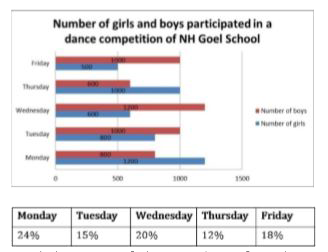
If the ratio of number of girls lost to the number of boys lost on Thursday is 7: 5 respectively, then the number of girls lost on Thursday was what percentage of the number of boys participated on Monday?View Solution
