The given line graph shows the number of toys sold by a store in five months.
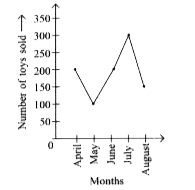
What is the ratio of the toys sold in April and June together to the toys sold in August and July together ?
9:8
8:9
7:6
6:7
The correct Answer is:B
Step by step video, text & image solution for The given line graph shows the number of toys sold by a store in five months. What is the ratio of the toys sold in April and June together to the toys sold in August and July together ? by Maths experts to help you in doubts & scoring excellent marks in Class 6 exams.
Updated on:21/07/2023Topper's Solved these Questions
- IMO QUESTION PAPER 2017-18 SET - BBOOK - SCIENCE OLYMPIAD FOUNDATION CHAPTER - IMO QUESTION PAPER 2017-18 SET - BEXERCISE - EVERYDAY MATHEMATICS
10 Videos
- IMO QUESTION PAPER 2017-18 SET - ABOOK - SCIENCE OLYMPIAD FOUNDATION CHAPTER - IMO QUESTION PAPER 2017-18 SET - AEXERCISE - EVERYDAY MATHEMATICS
15 Videos
- IMO QUESTION PAPER 2018-19 SET ABOOK - SCIENCE OLYMPIAD FOUNDATION CHAPTER - IMO QUESTION PAPER 2018-19 SET AEXERCISE - Achievers section
5 Videos
Similar Questions
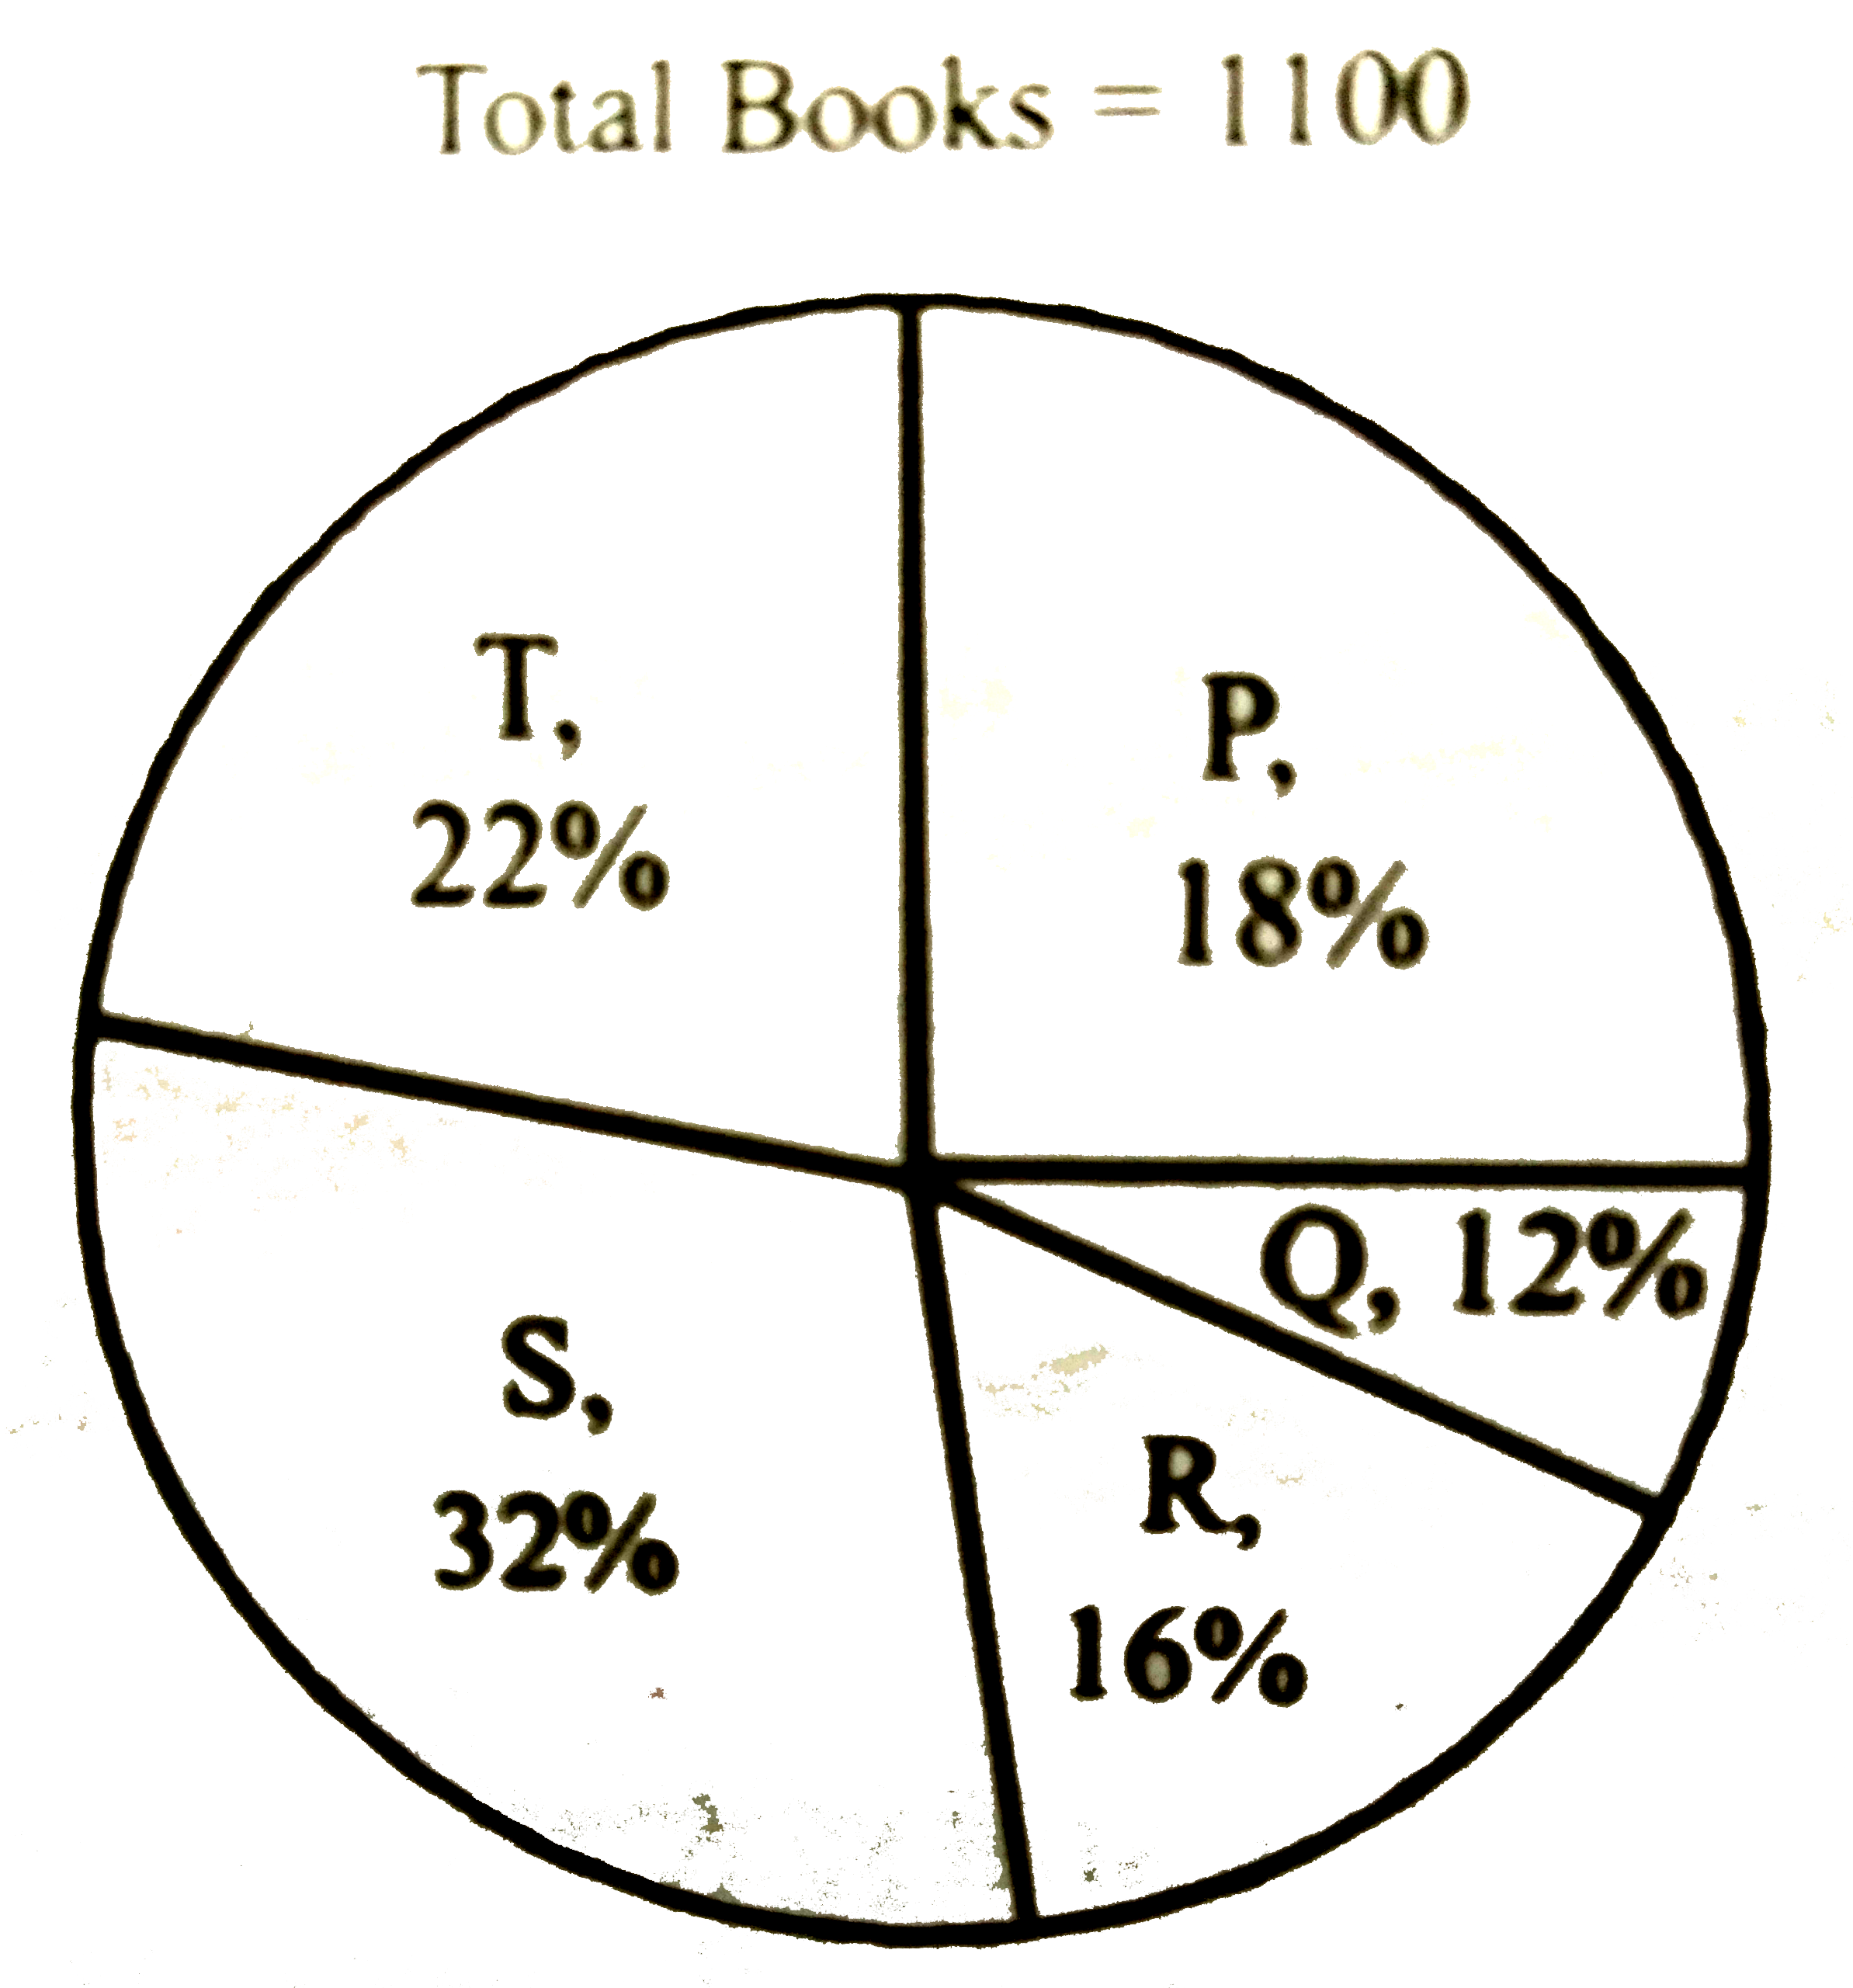
What is the ratio of total books sold by store P and R together to the total books sold by store S and T together
View SolutionThe bar graph shows the number of toys produced by a factory during a certain week.
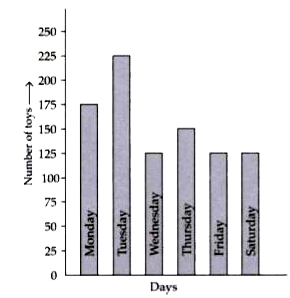
What is the total number of toys produced during the week ?
View SolutionThe bar graph shows the number of cycles sold by a distributor in each month from January to June. Whatis the increase in the number of cycles sold in April as compared to March?
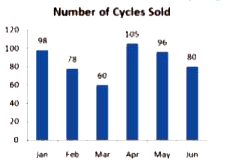
View SolutionThe bar graph shows the number of cycles sold by a distributor in each month from January to June. Whatis the increase in the number of cycles sold in April as compared to March ?
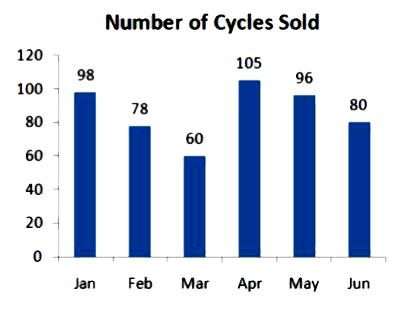
View SolutionThe bar graph shows the number of cycles sold by a distributor in each month from January to June. Whatis the increase in the number of cycles sold in April as compared to March ?

View SolutionThe given bar graph shows the sale of different brands of shirts in a shop in one month.
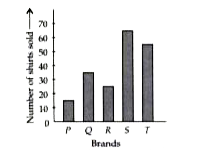
Find the ratio of number of shirts sold of brand S to the number of shirts sold or brand P and R together.
{ ((a),8:9),((b)13:8),((c )11:7),((d)13:6): }
View SolutionThe given bar graph shows the number of cars sold from Jan to Dec.
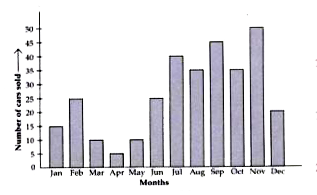
How many cars were sold in the last quarter of the year?
View SolutionPercentage -wise disribution of the number of mobile phones sold by a shopkeeper during six months
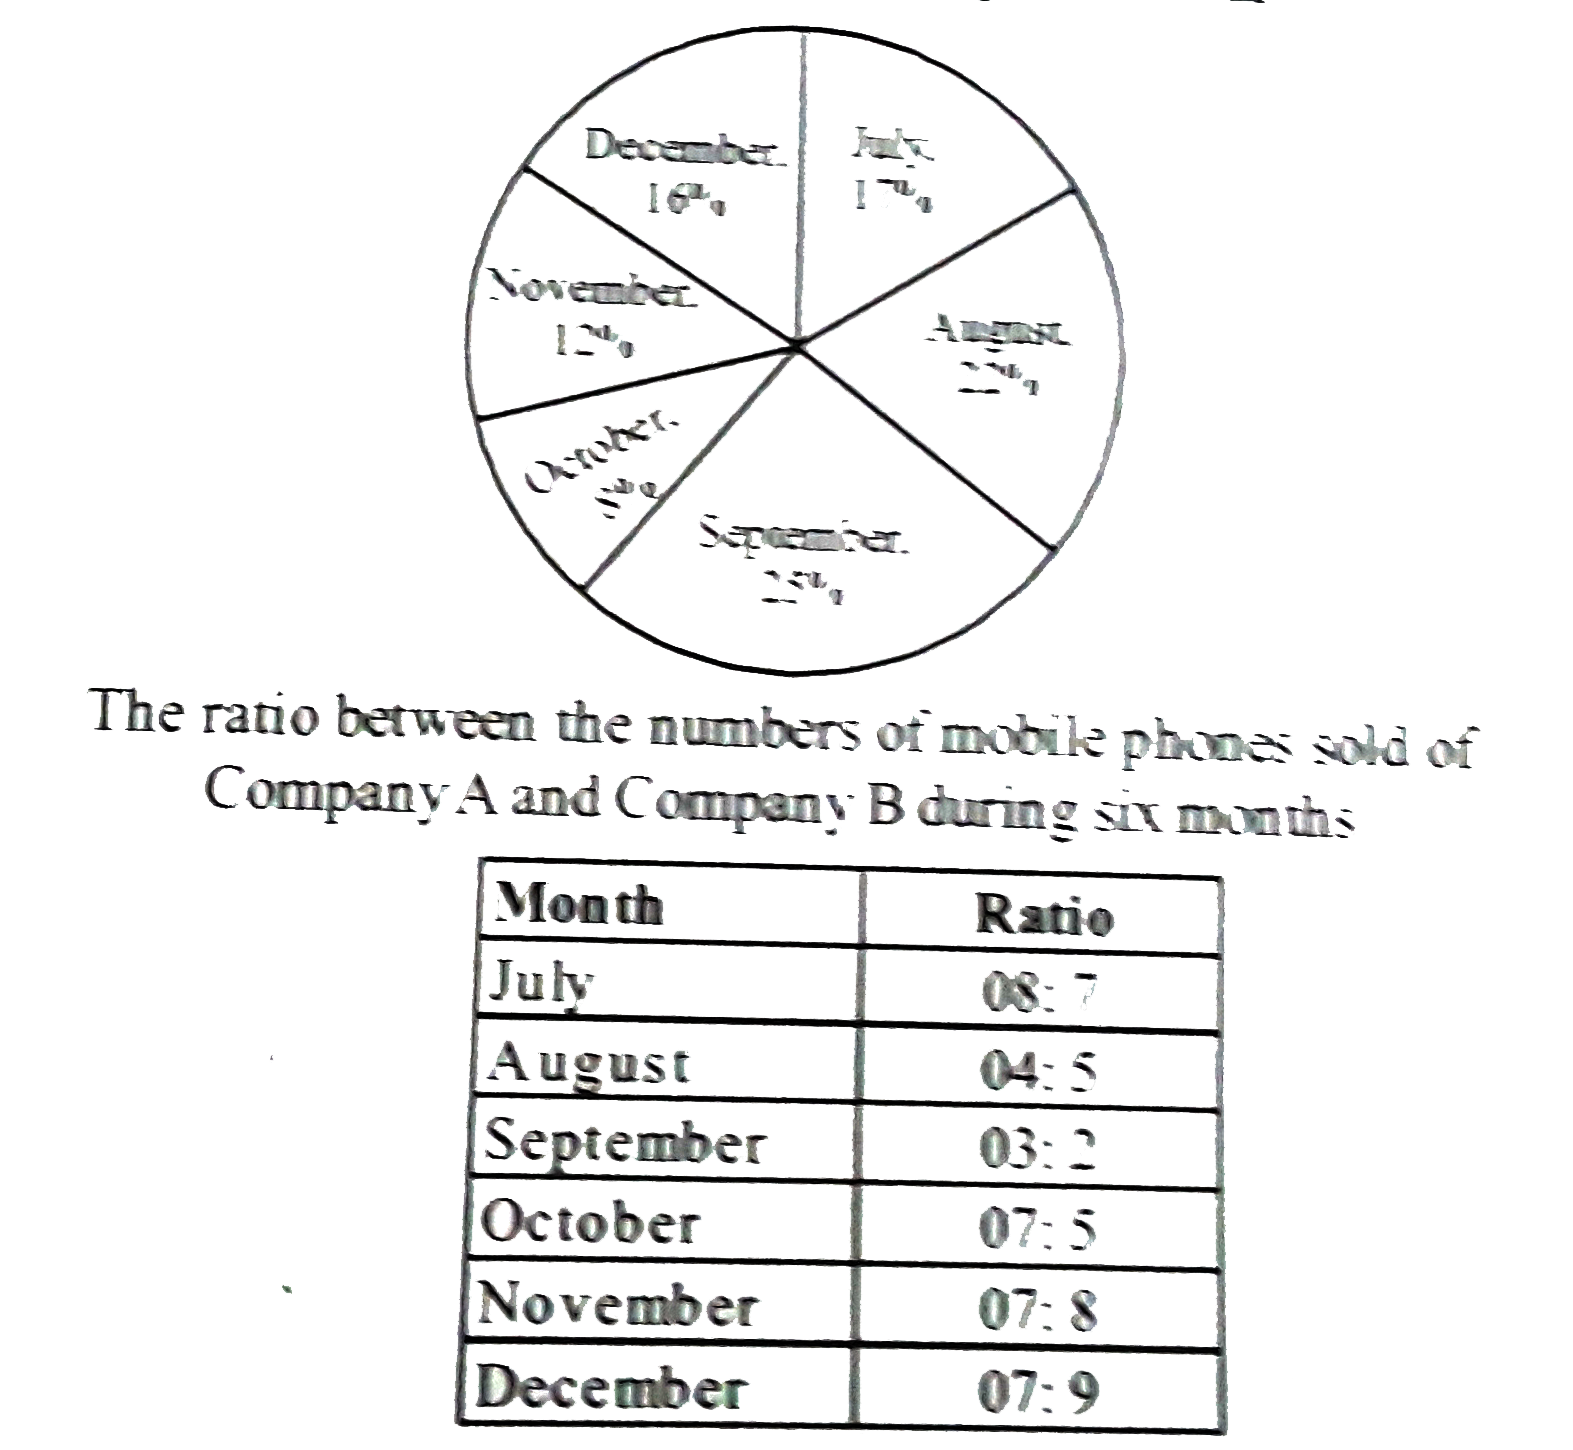
What is the total number of mobile phones sold of Company B During August and September together ?
View SolutionPercentage -wise disribution of the number of mobile phones sold by a shopkeeper during six months
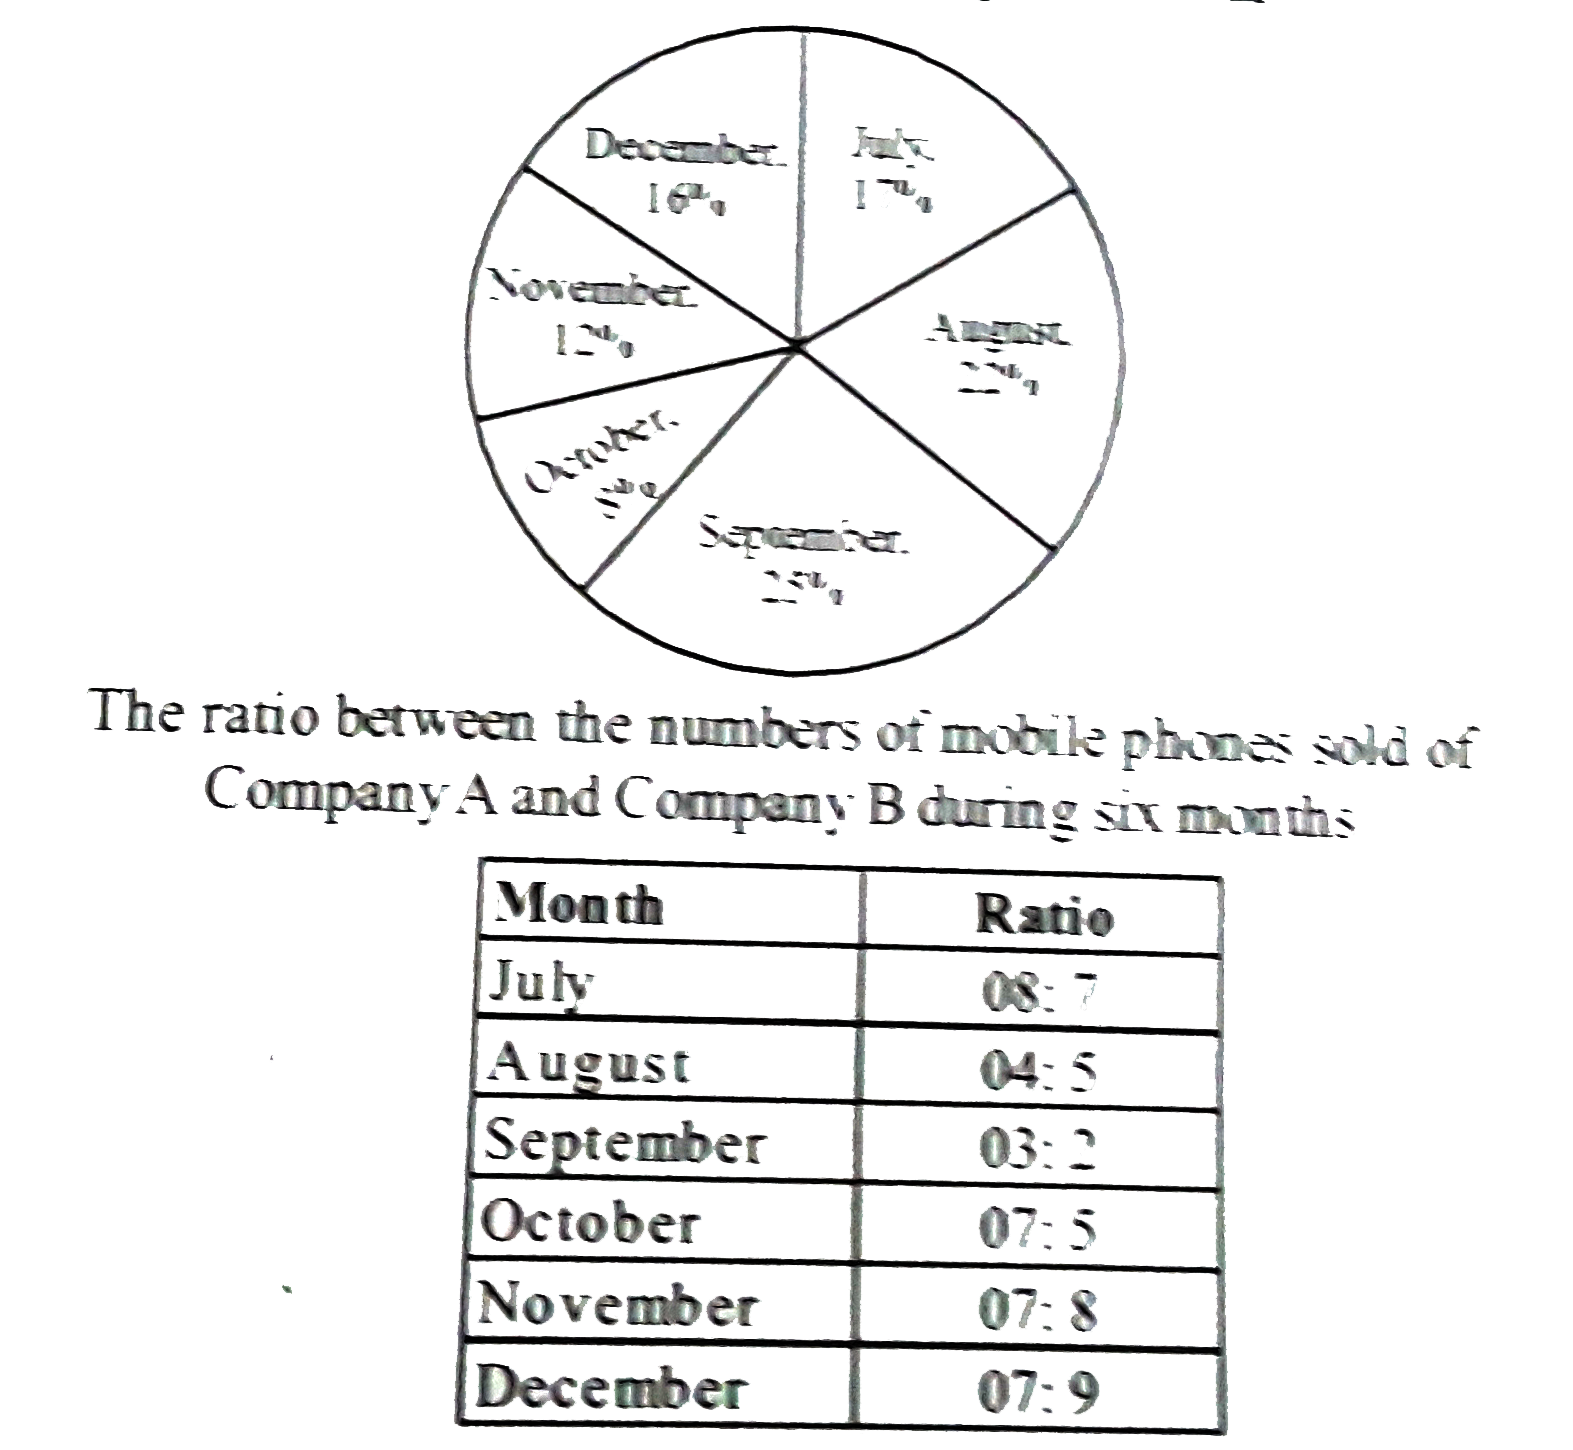
What is the ratio of the number of mobile phones sold of company B during July to those sold during December of the same company ?
View SolutionDirection: The given bar graph shows the number of pens sold by two shops A & B in four consecutive months. Study the following data and answer the following questions:
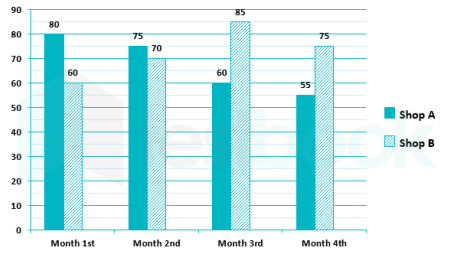
Find the ratio of the number of pens sold by shop A in 1st month to the number of pens sold by B in 3rd month.
View Solution
