The overuse of fertilisers in a farm results in the runoff pollution of nearby river.
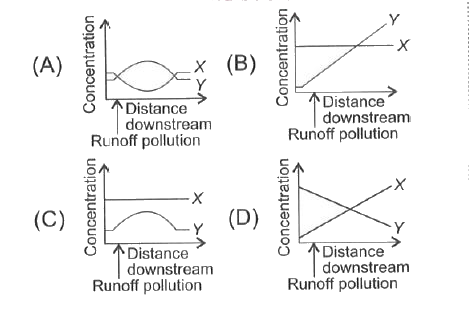
Which of the following graphs correctly represents the resulting changes in the levels of oxygen and bacteria in that river?
Video Solution
Text Solution
The correct Answer is:A
When chemical fertilisers are washed into the river, eutrophication occurs. This results in an increase in concentration of bacteria and a subsequent fall in oxygen concentration.
|
Topper's Solved these Questions
- POLLUTION OF AIR AND WATER BOOK - SCIENCE OLYMPIAD FOUNDATION CHAPTER - POLLUTION OF AIR AND WATER EXERCISE - ACHIEVERS SECTION (HOTS)
5 Videos
- NSO QUESTION PAPER 2020-21 SET ABOOK - SCIENCE OLYMPIAD FOUNDATION CHAPTER - NSO QUESTION PAPER 2020-21 SET AEXERCISE - SCIENCE
14 Videos
- REPRODUCTION AND ENDOCRINE SYSTEMBOOK - SCIENCE OLYMPIAD FOUNDATION CHAPTER - REPRODUCTION AND ENDOCRINE SYSTEMEXERCISE - ACHIEVERS SECTION (HOTS)
4 Videos
Similar Questions
Knowledge Check
Which of the following graph is correctly represented?
A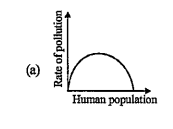 B
B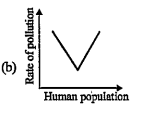 C
C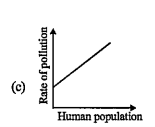 D
D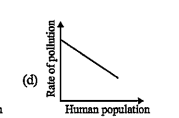
Which of the following graphs represents freundlich adsorption isotherm?
A B
B C
C D
D
which of the following graphs represents Charles' law correctly ?
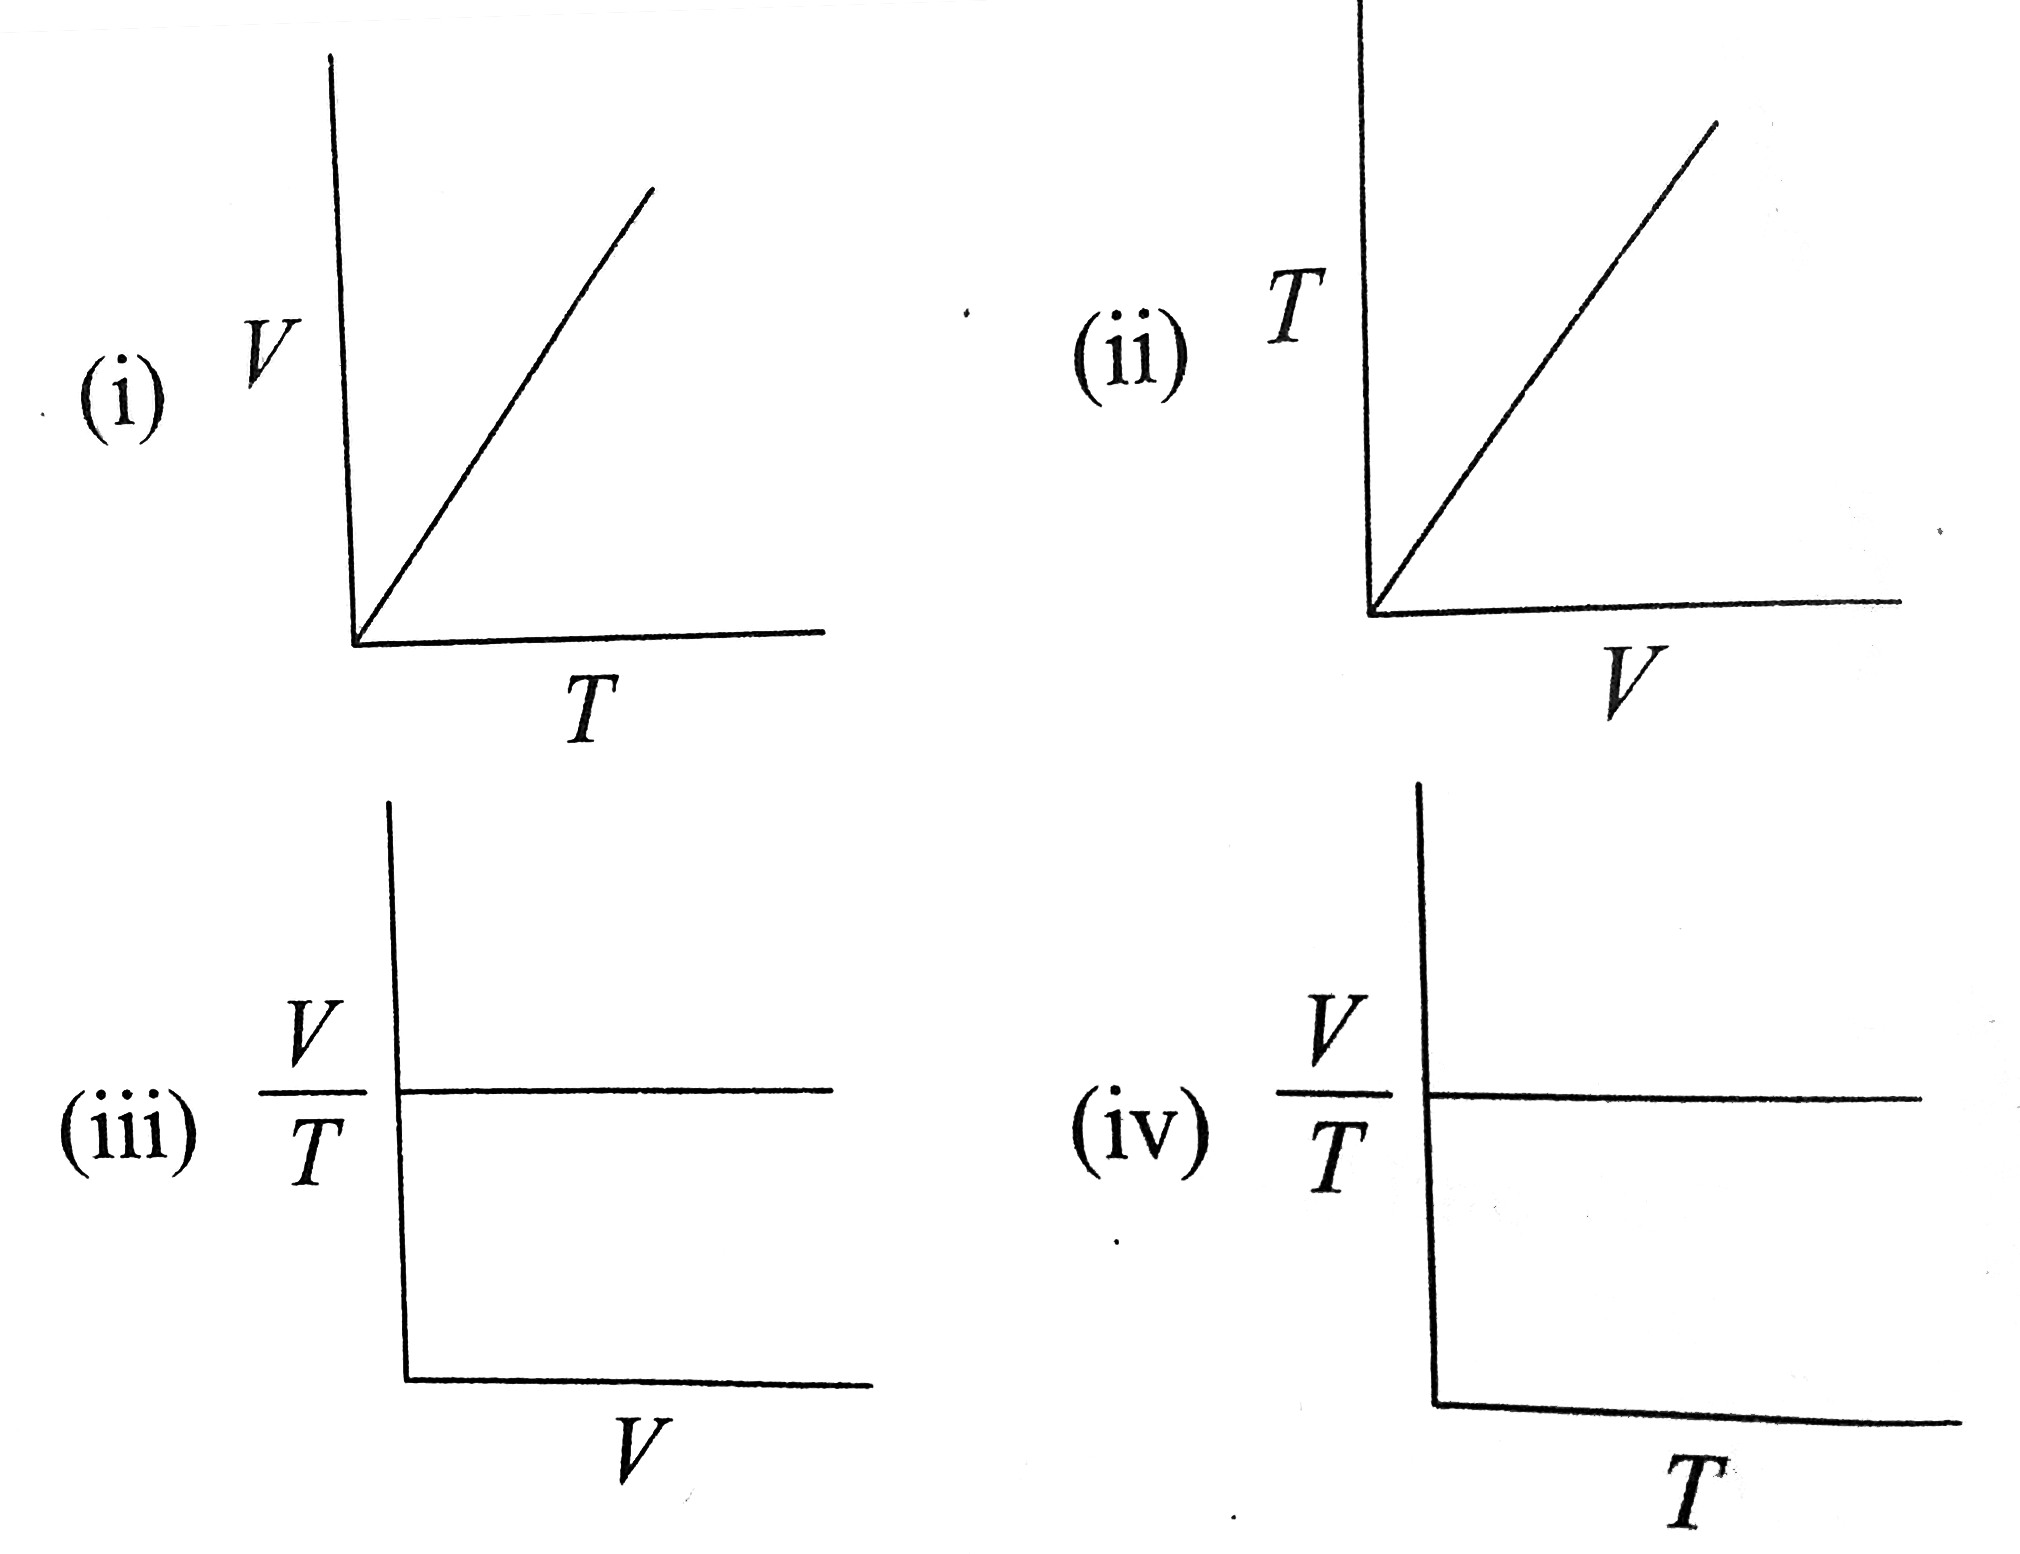 A(i),(iii)B(ii),(iv)C(i),(ii),(iii),(iv)D(iii),(iv)
Which one of the following diagrams correctly represents the energy levels in the p-type semiconductor?
View SolutionWhich of the following graph correctly represent for equilibrium reaction whose Kp>1?
View SolutionWhich of the following correctly represents the physical significance of Gibbs energy change?
View SolutionA body is thrown vertically upwards. Which one of the following graphs correctly represent the velocity vs time?
View SolutionWhich of the following correctly explains mitochondrial function and results?
View Solution

