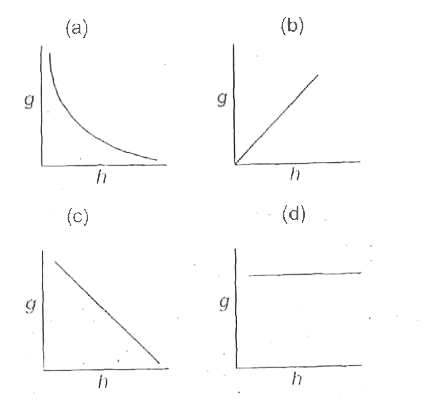
The graph that represents variation of g with height (h) from the surface of the earth is
A

B

C

D

Video Solution
Text Solution
The correct Answer is:B
Value of g decreases with height.
|
Topper's Solved these Questions
Similar Questions
Knowledge Check
The graph that represents variation of g with depth (d) from the surface of the earth is
A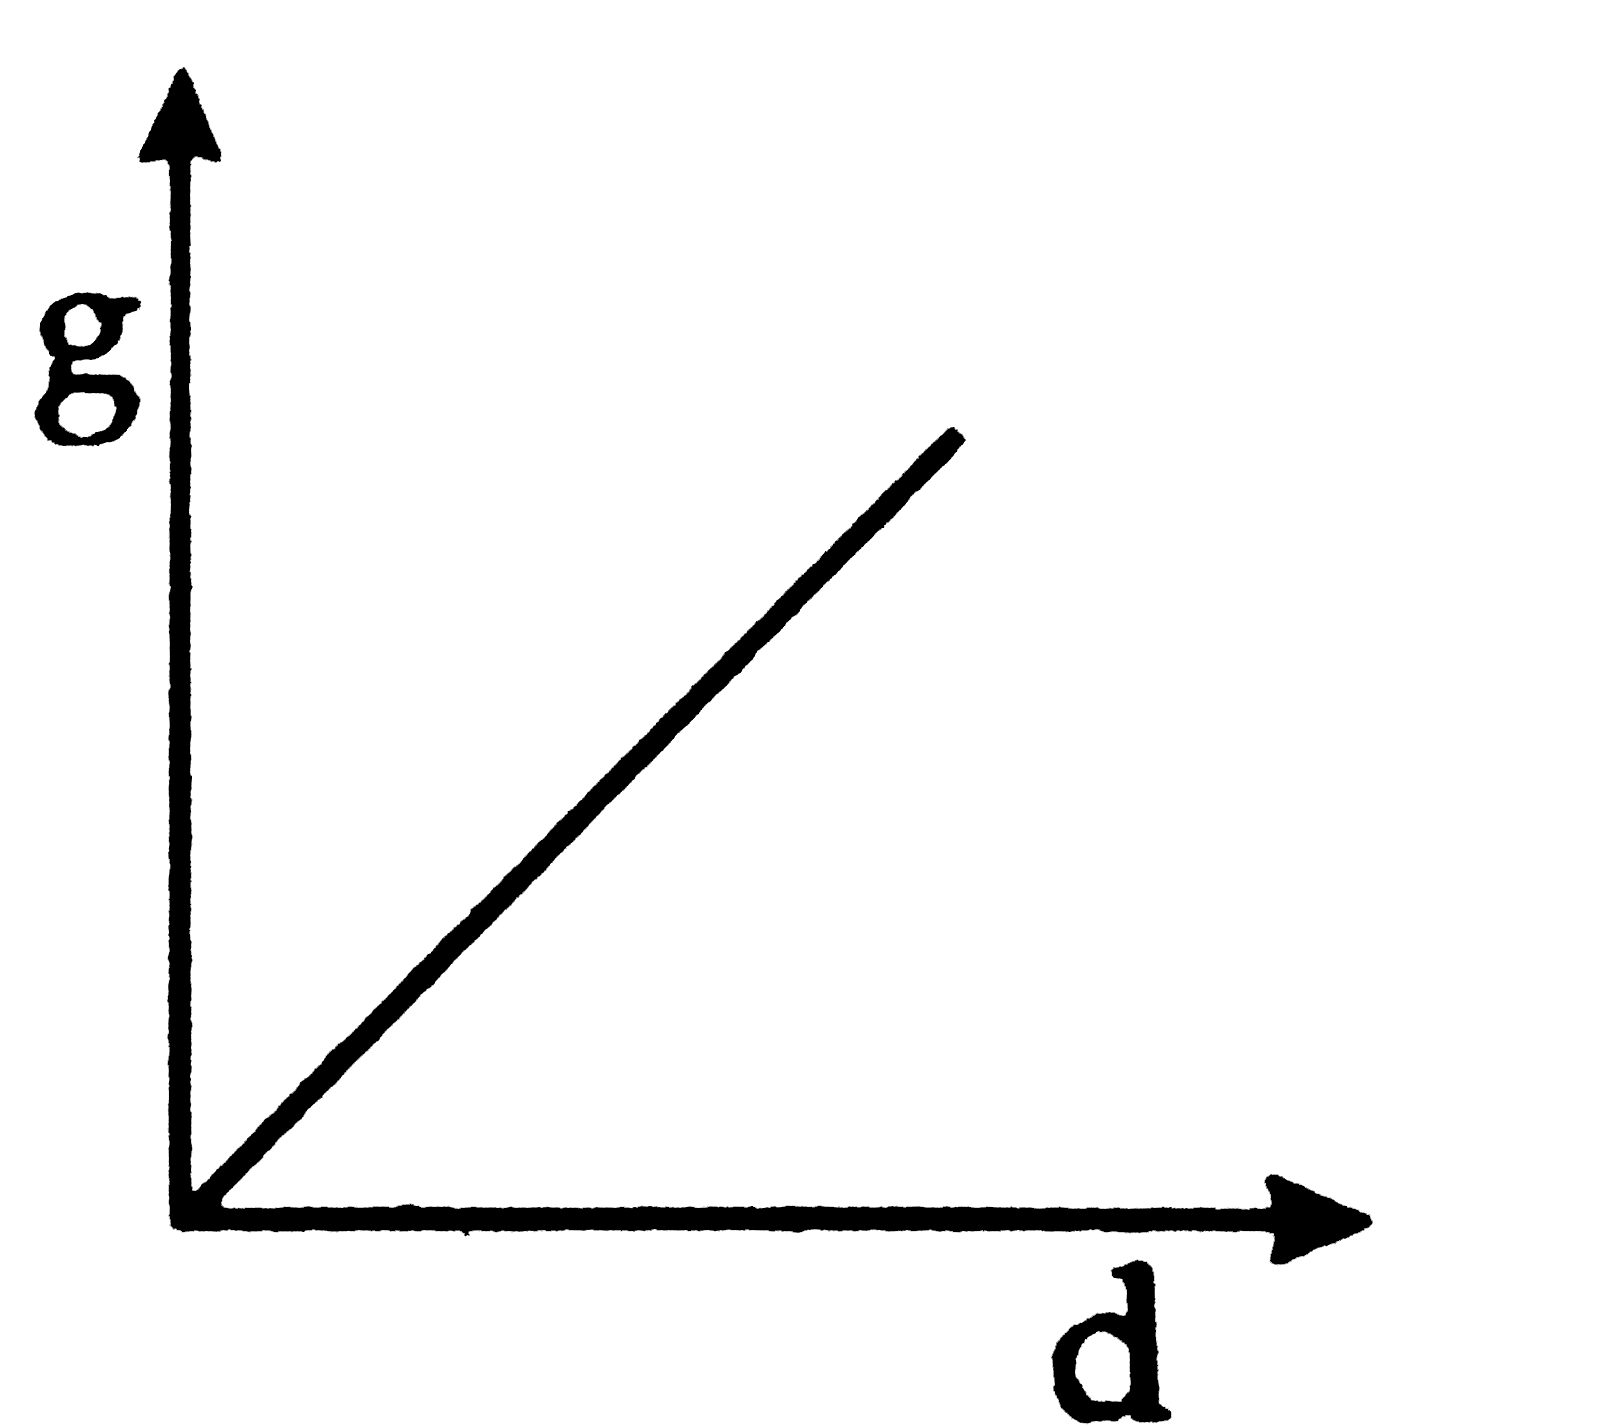 B
B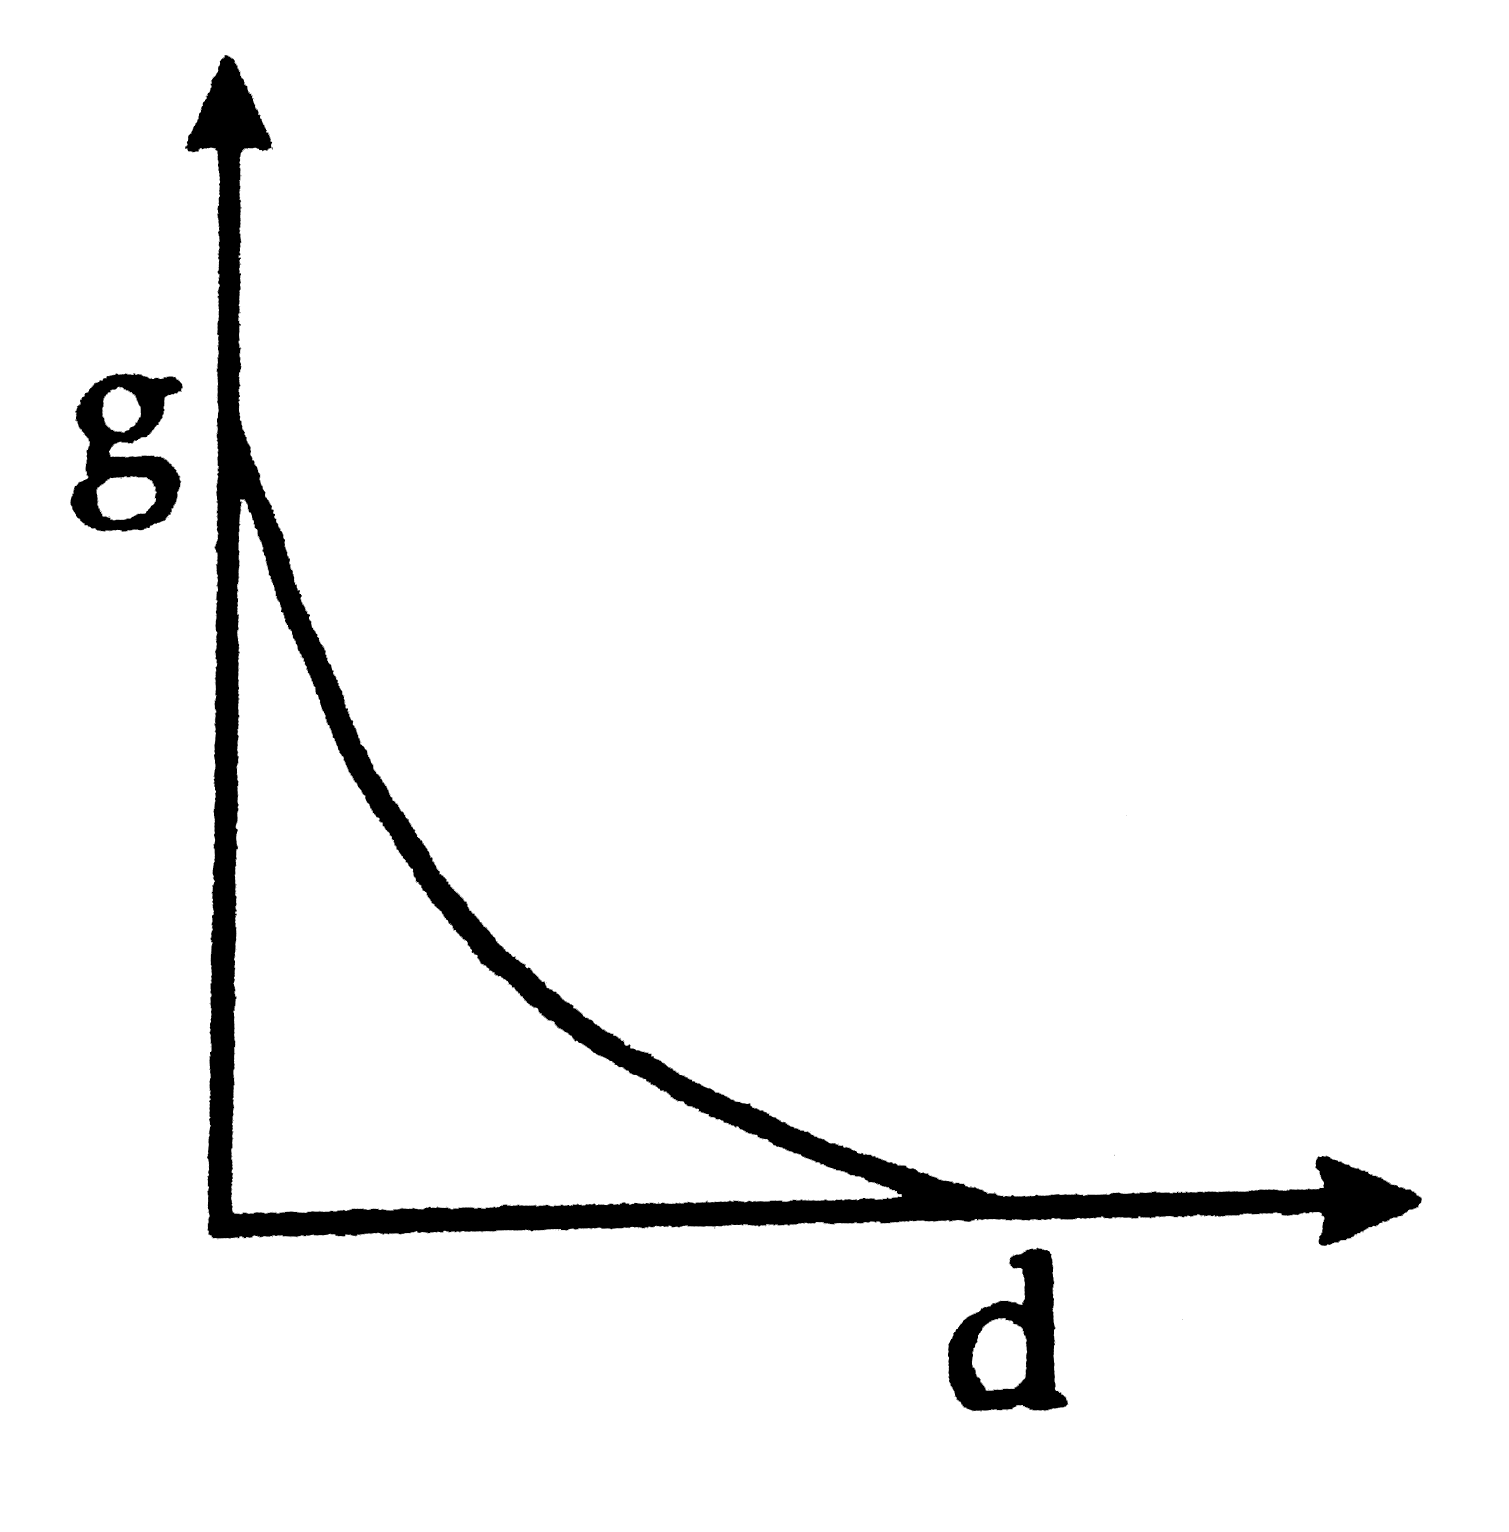 C
C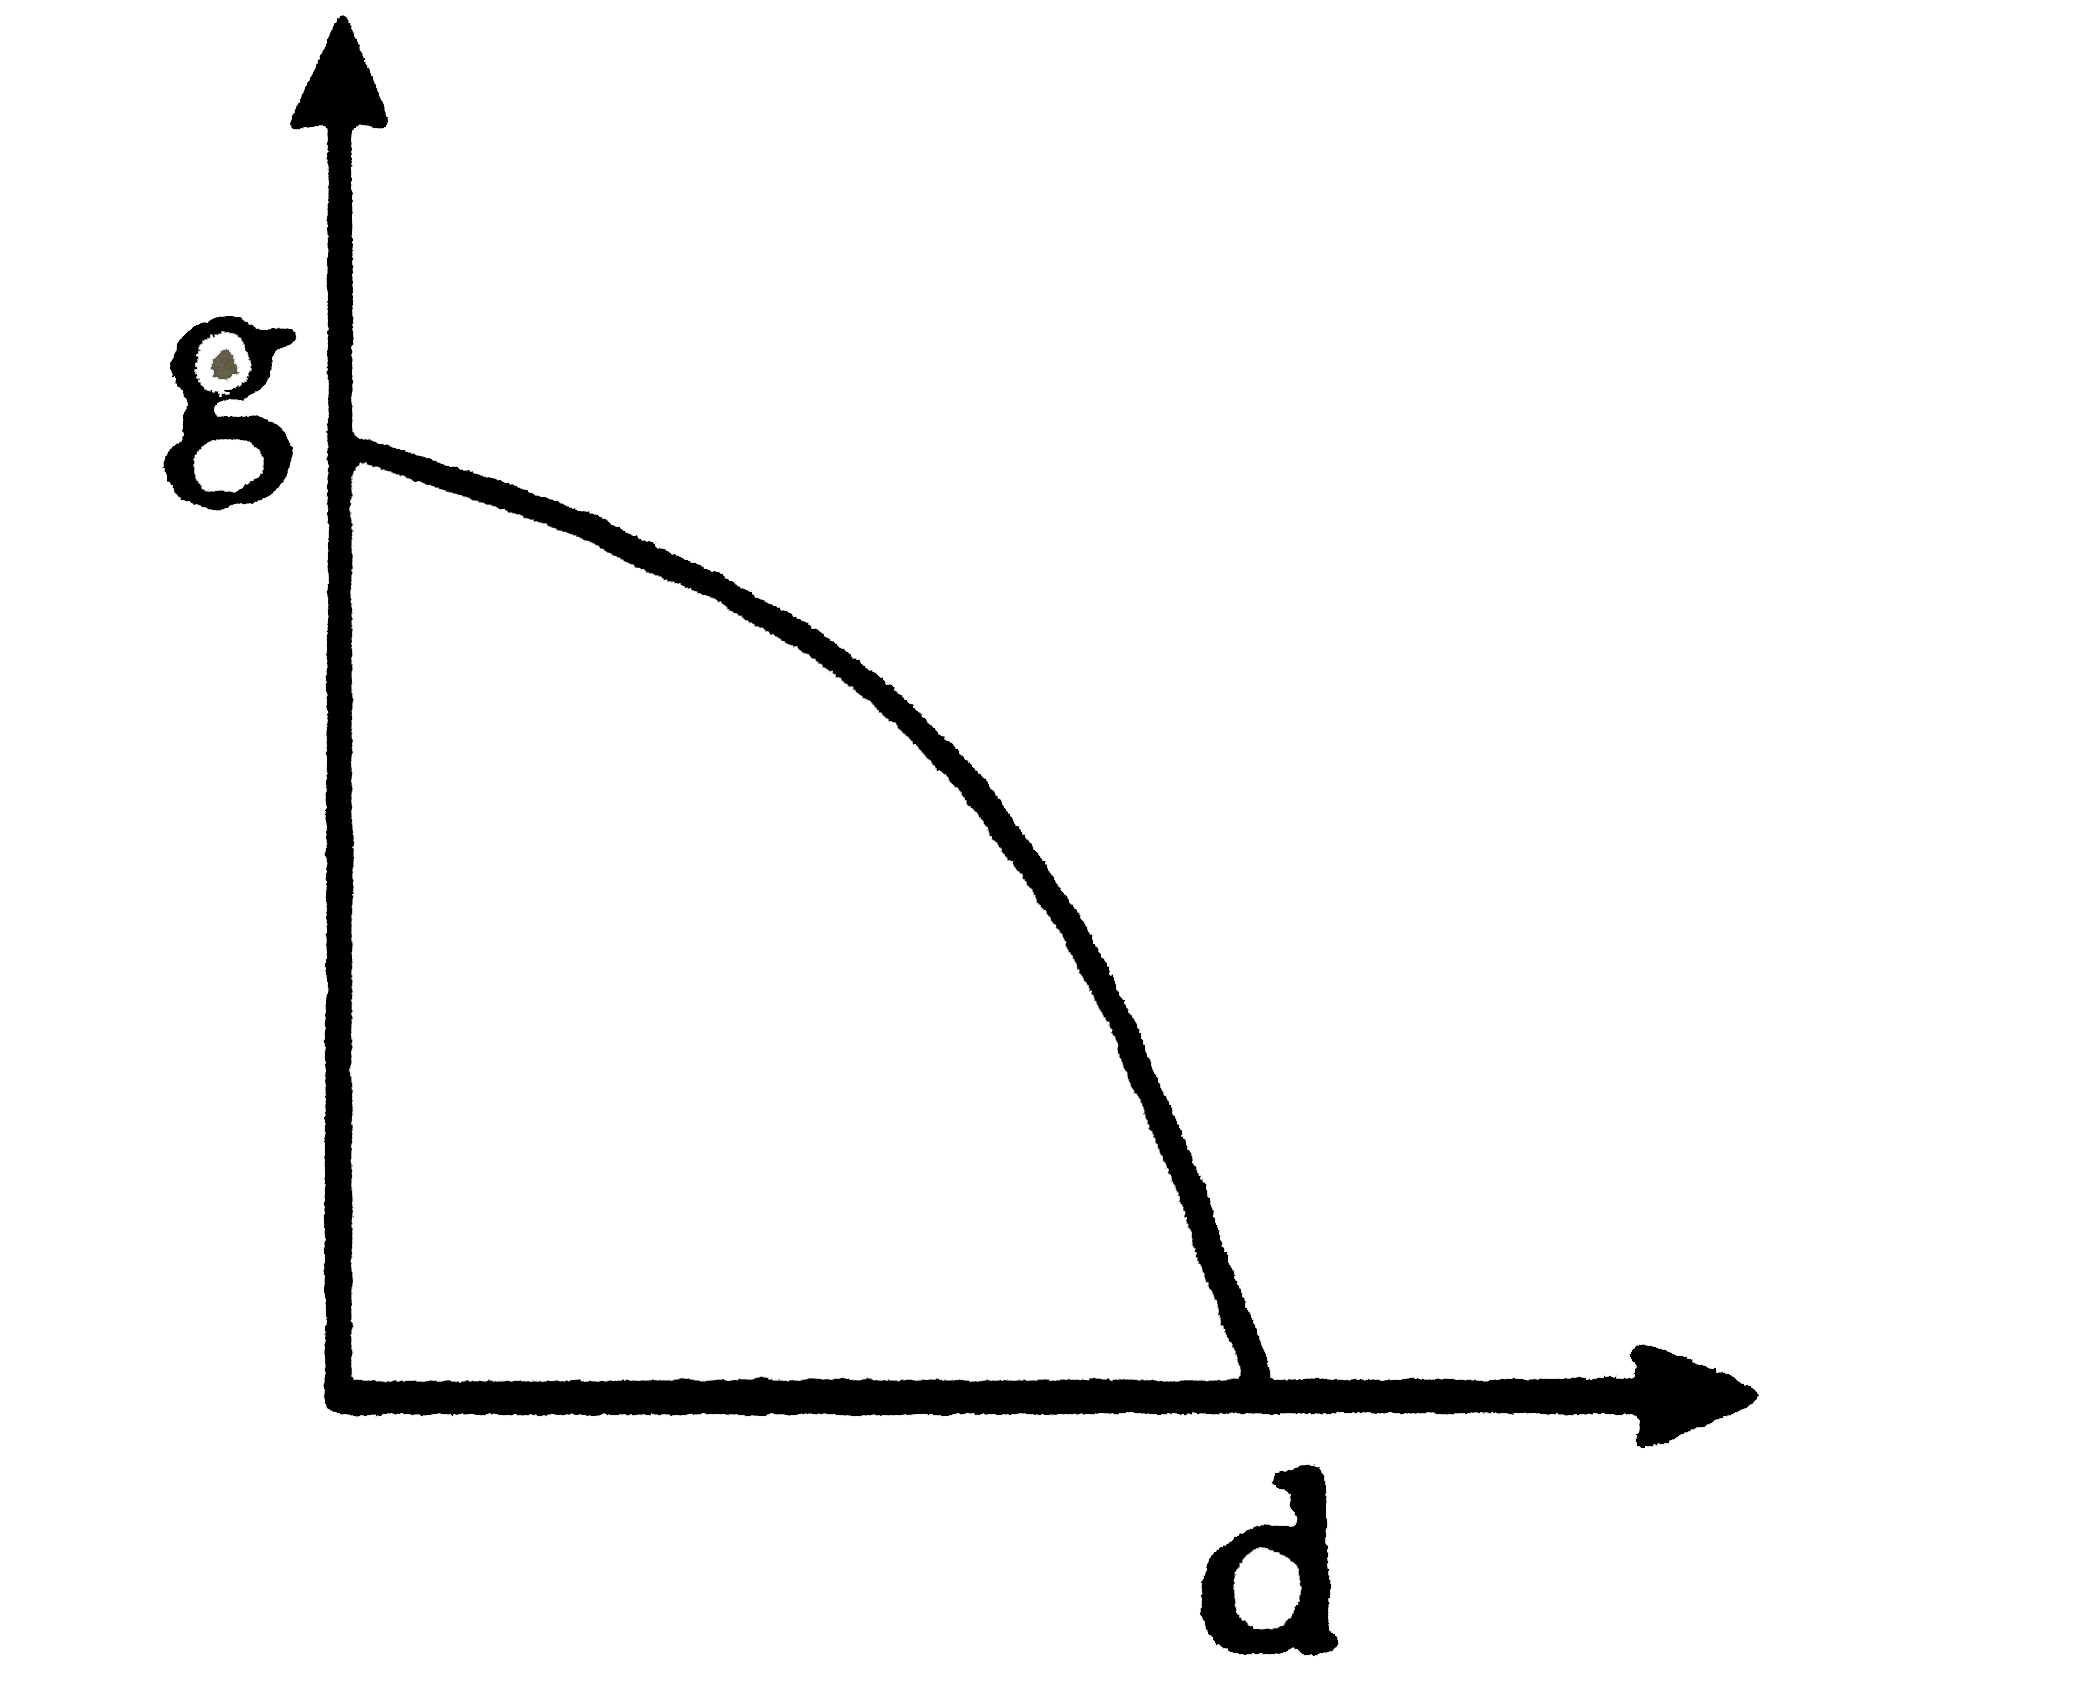 D
D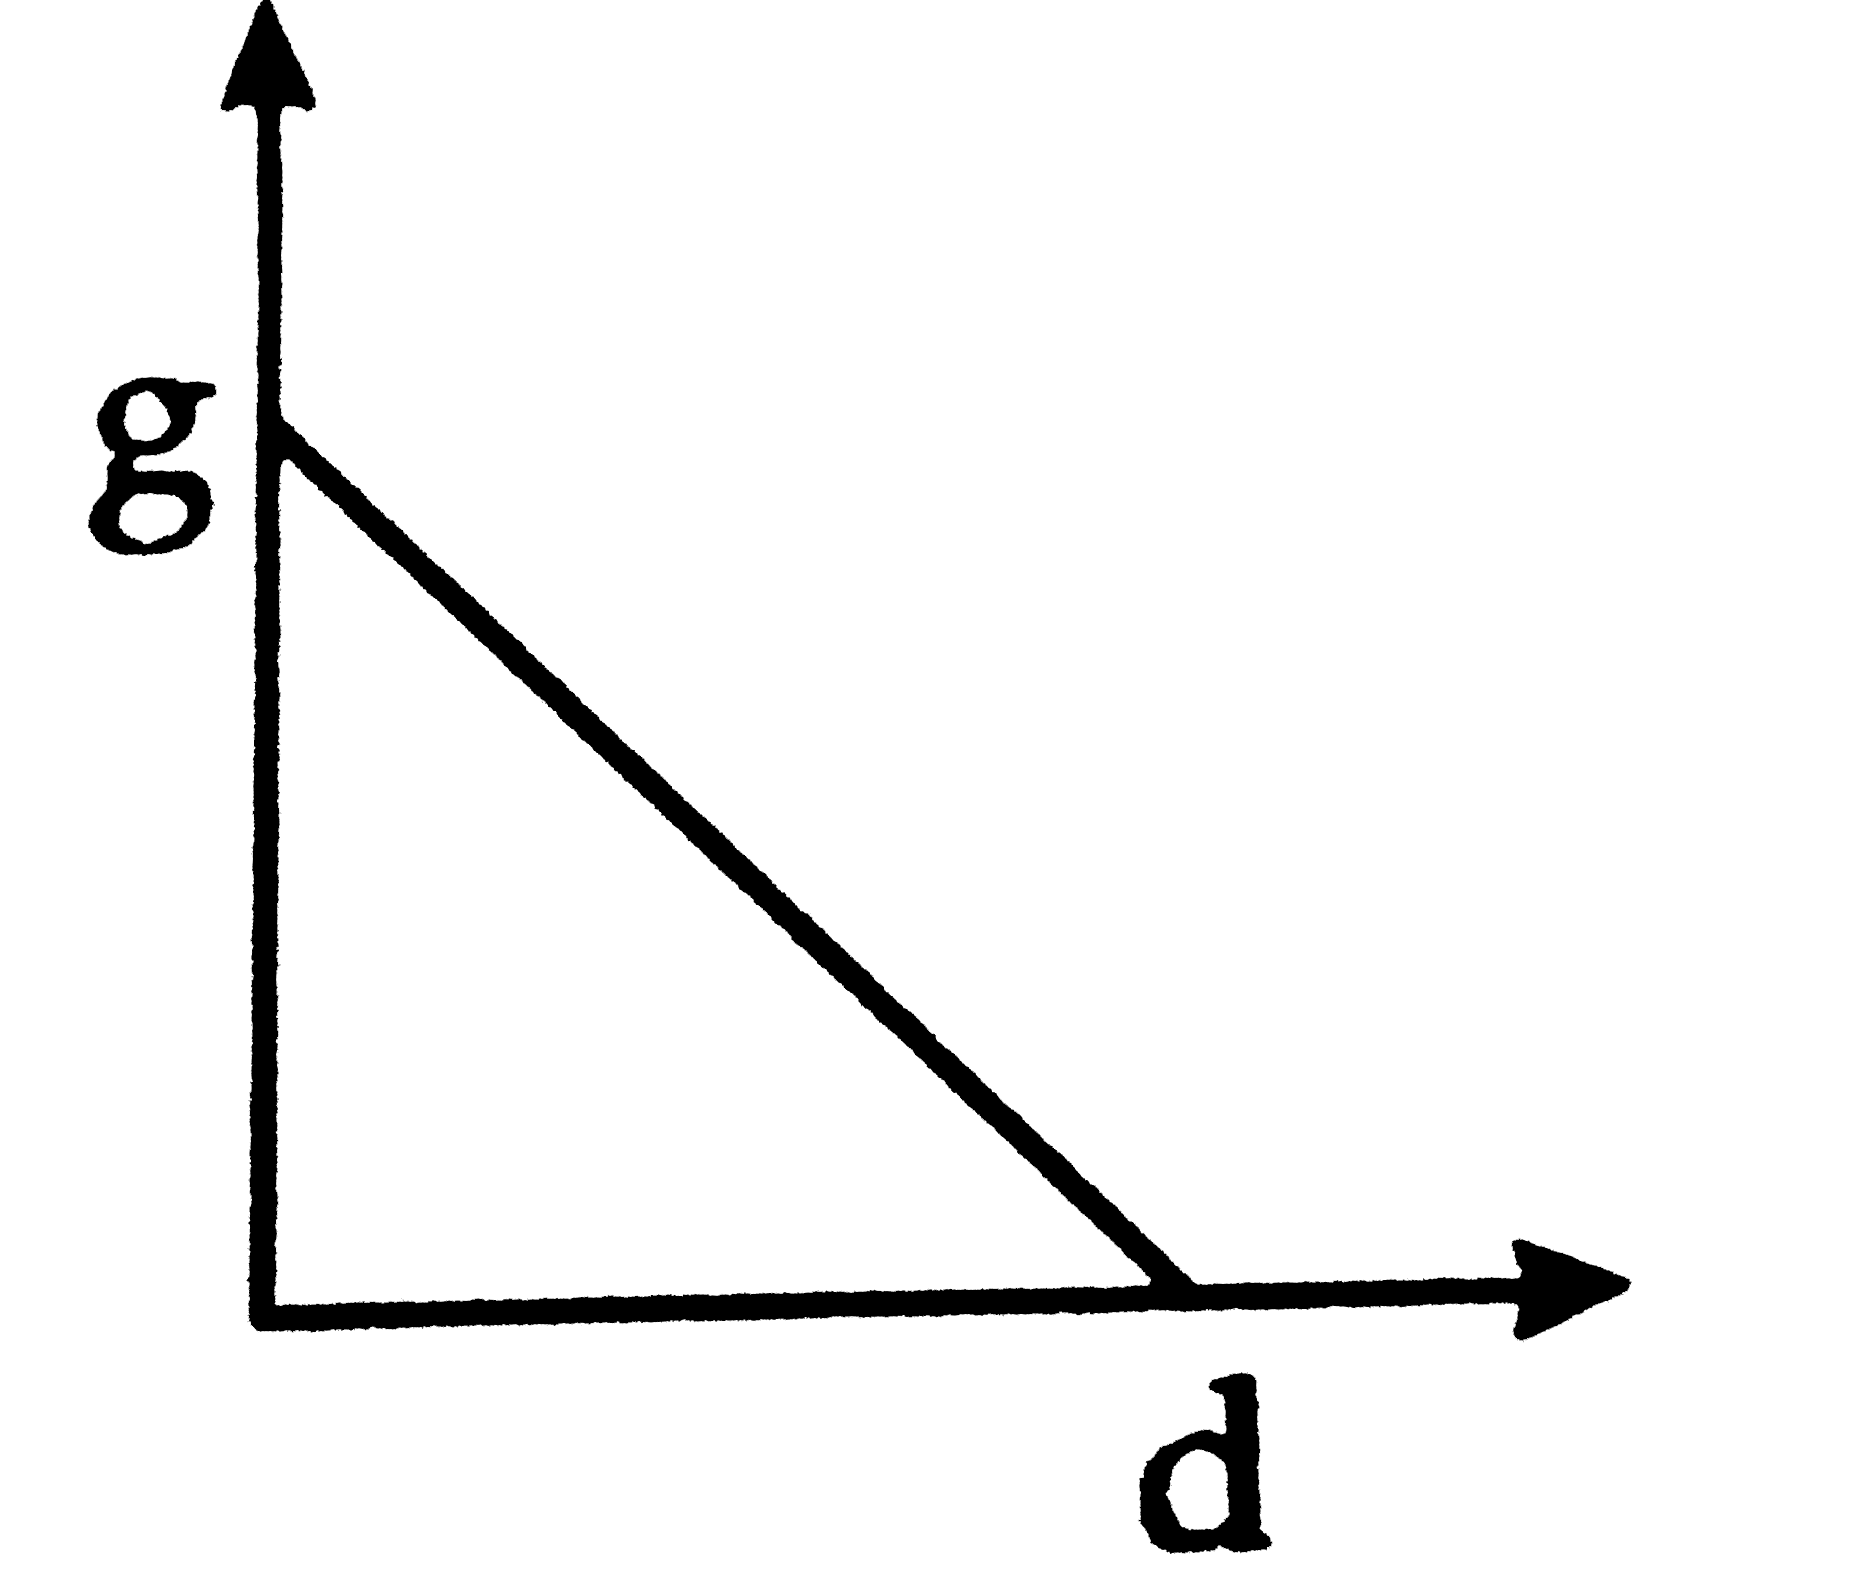
The graph that represents variation of g at the equator with square of angular velocity of rotation of earth is
A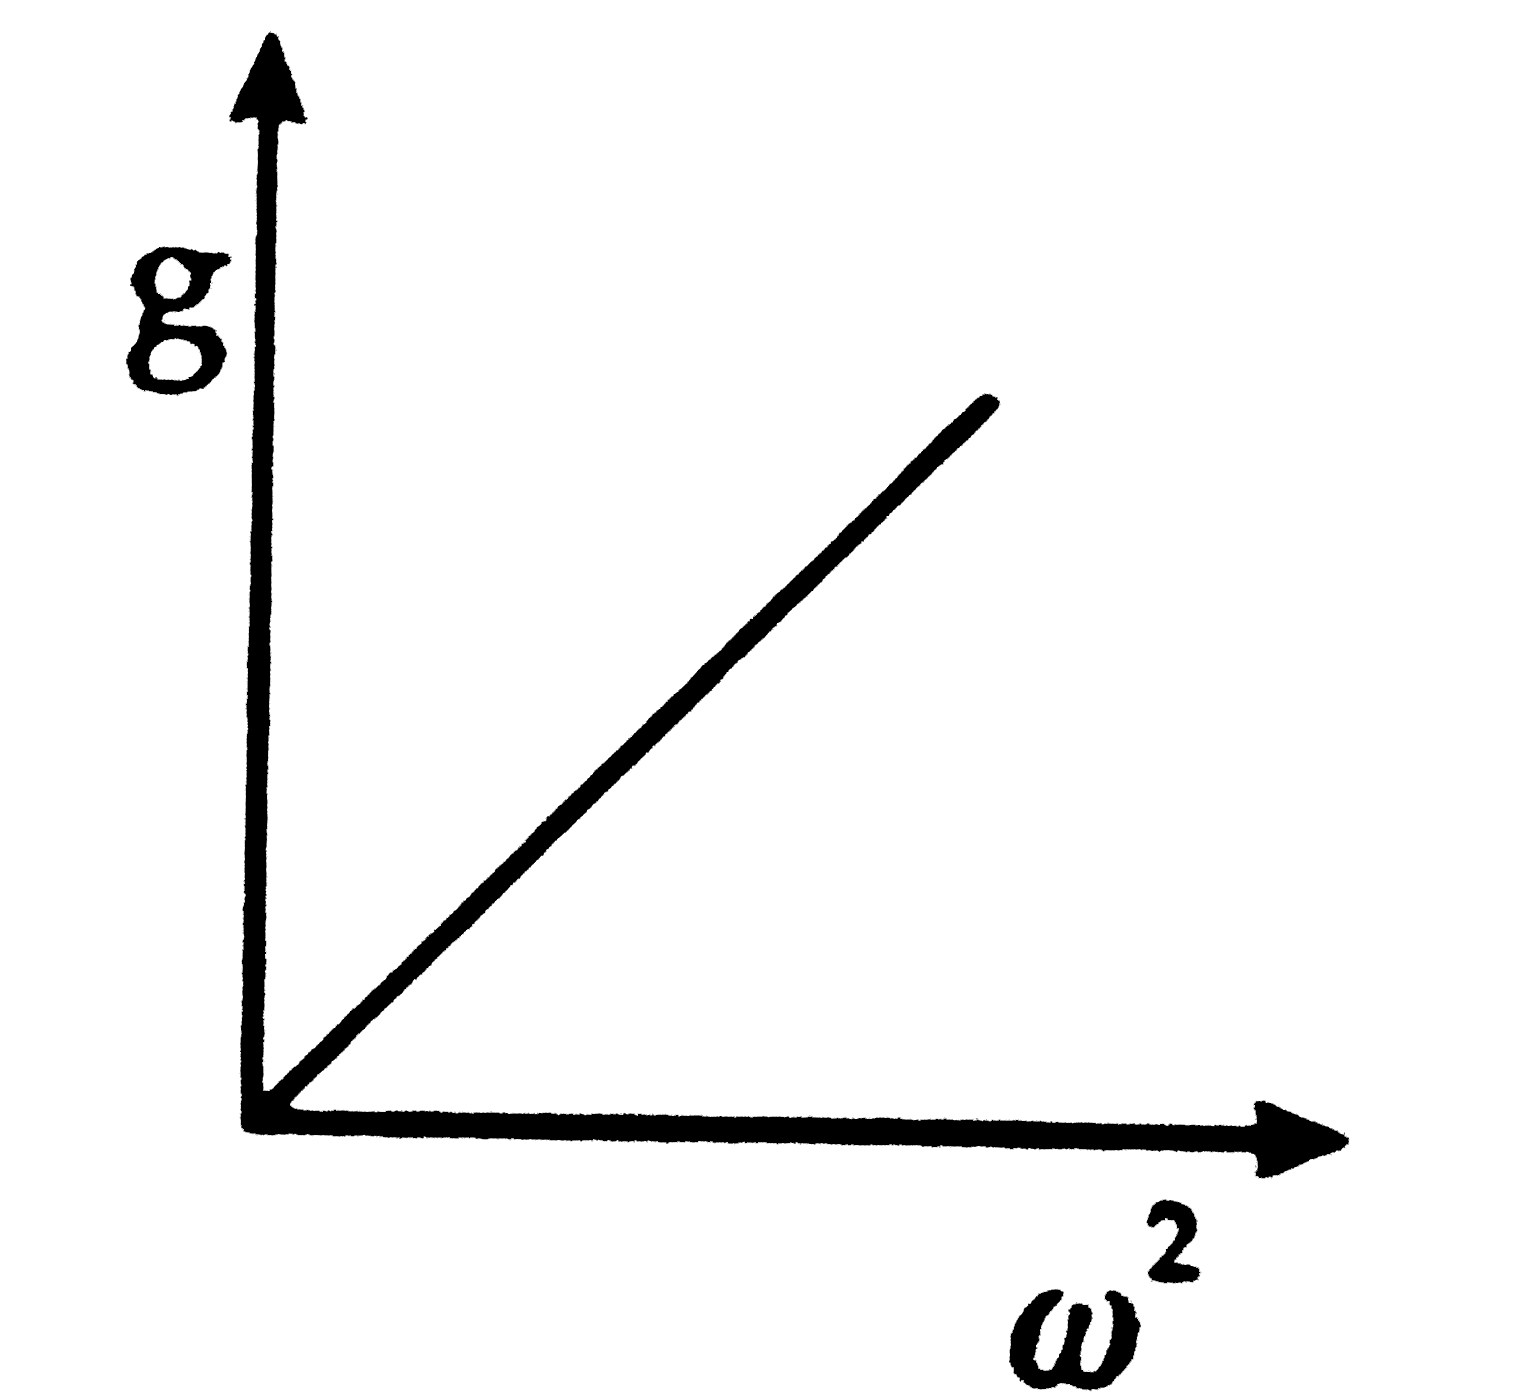 B
B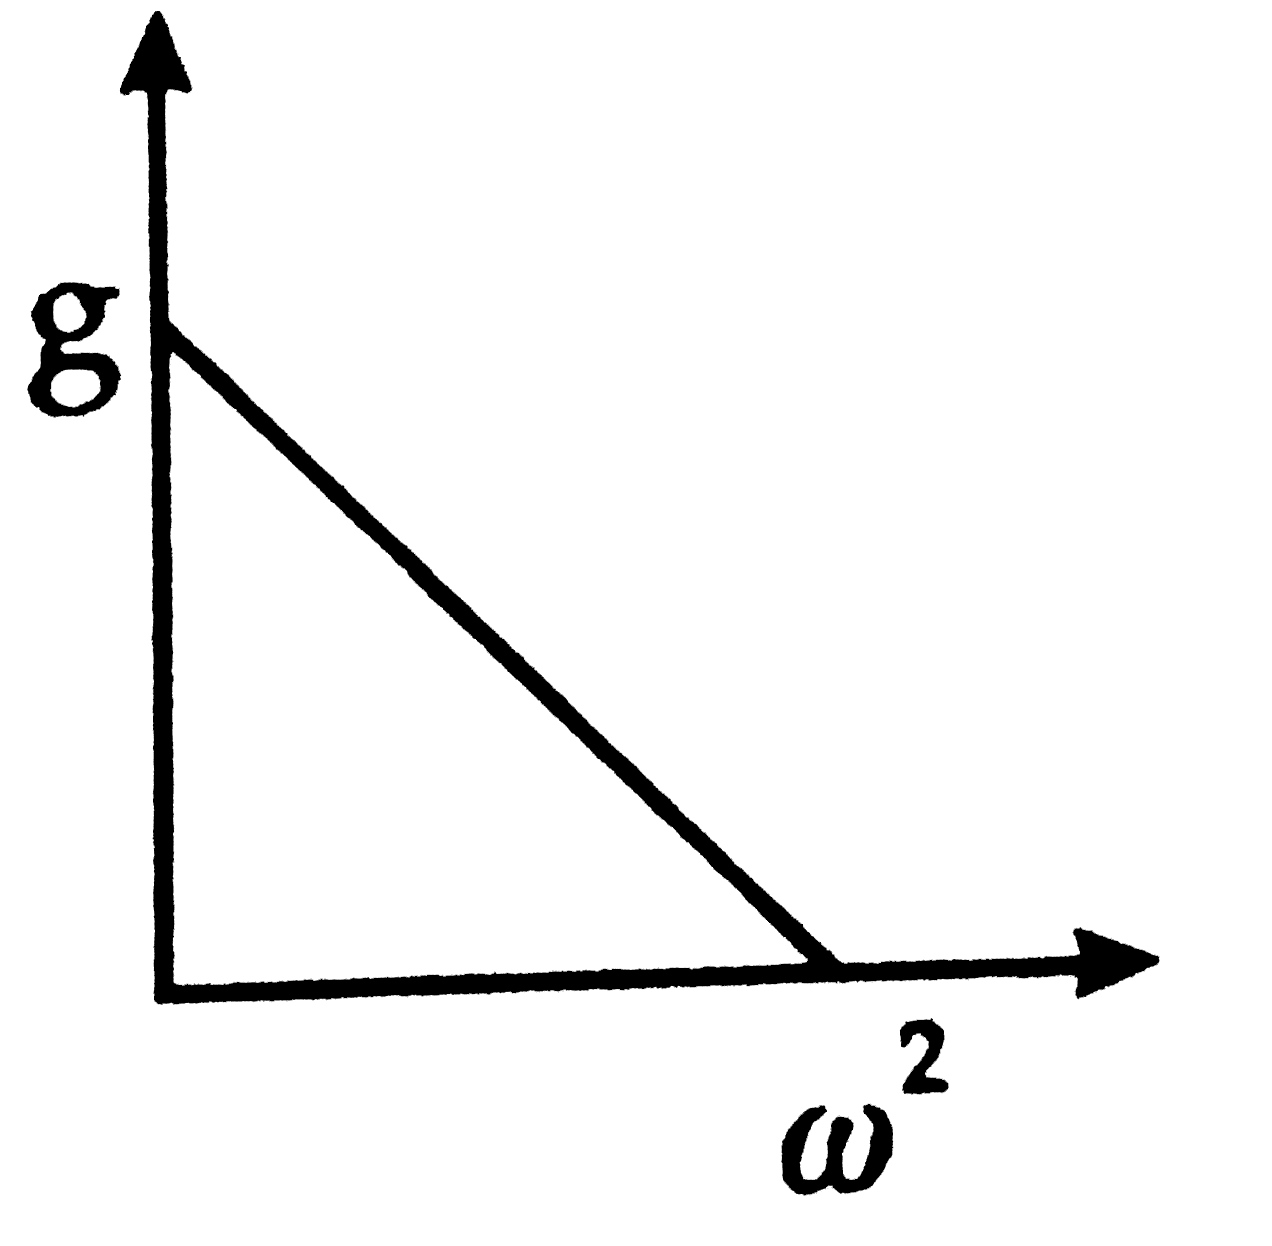 C
C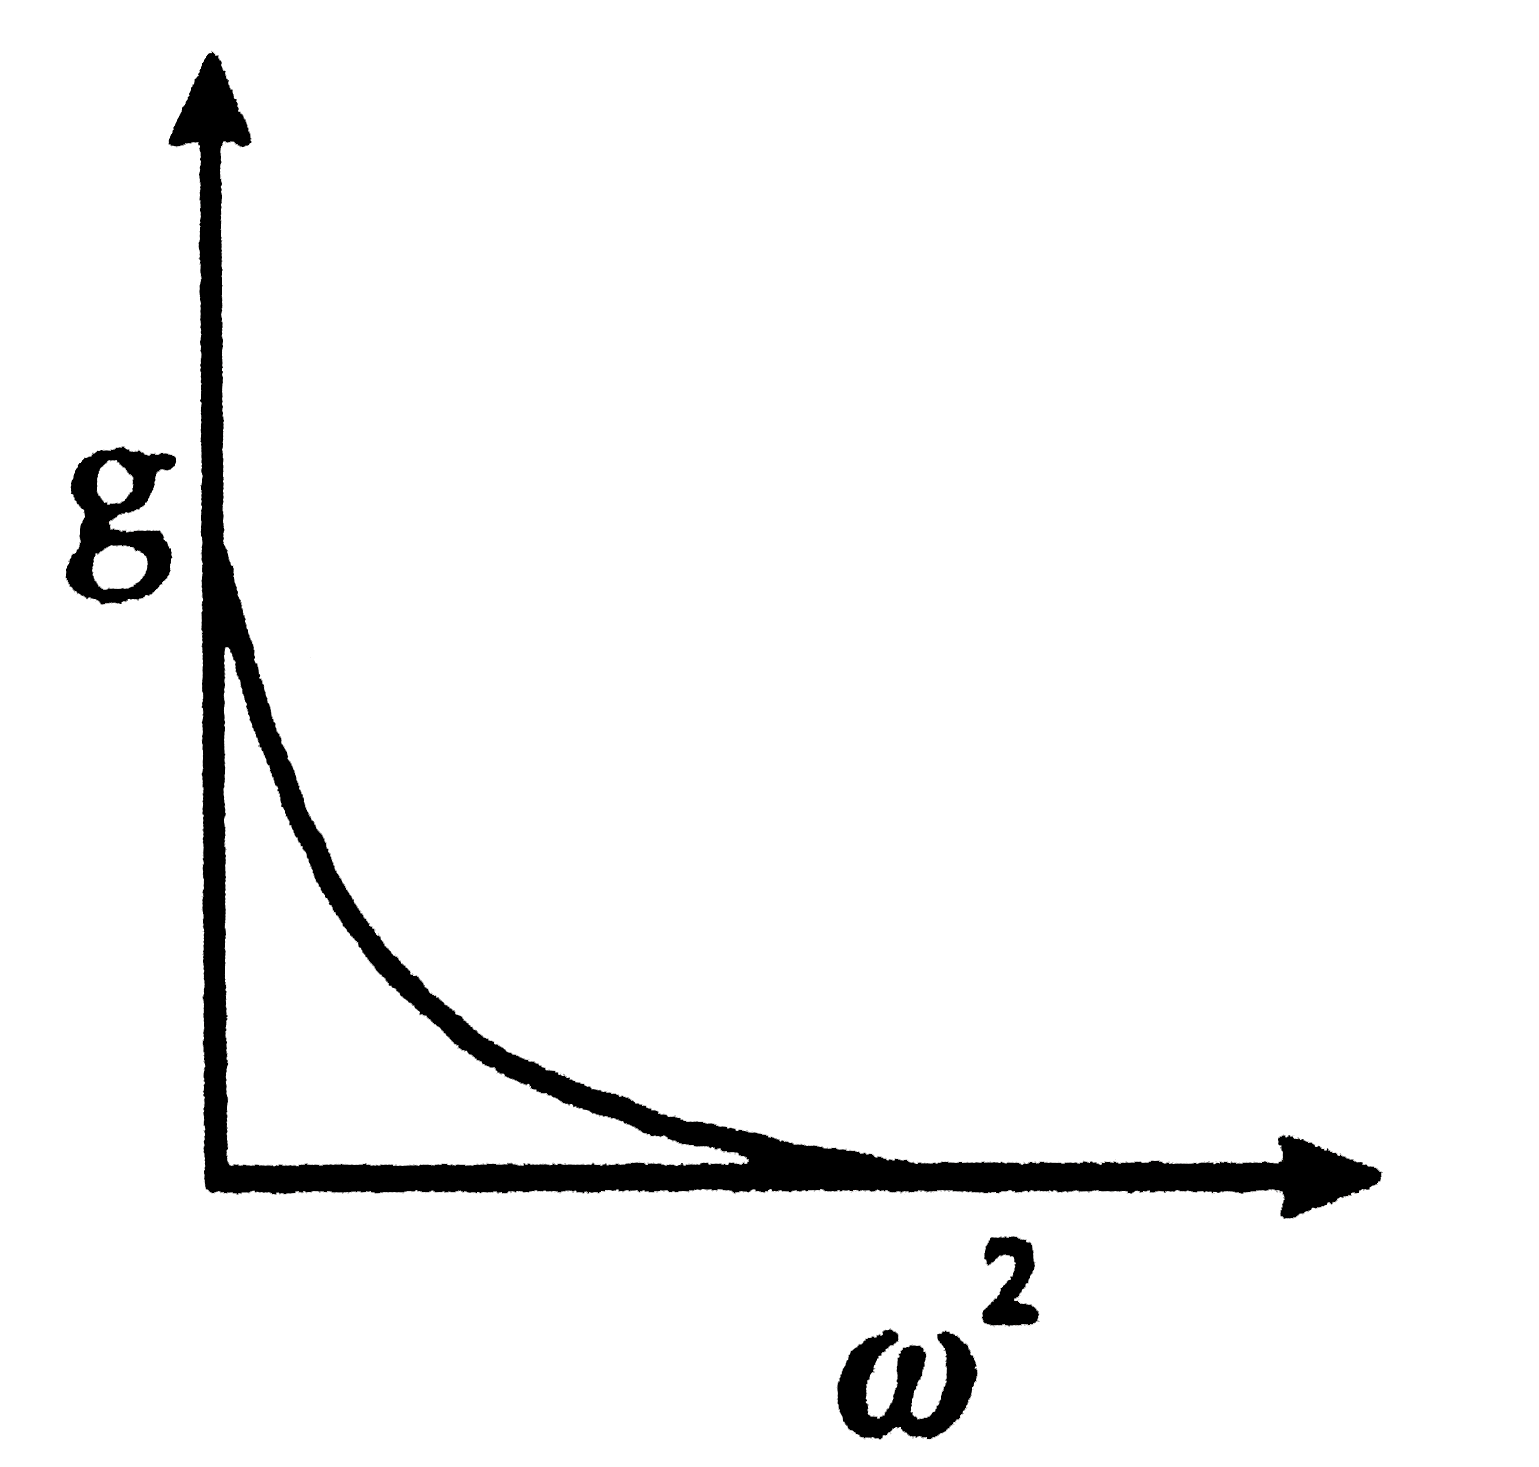 D
D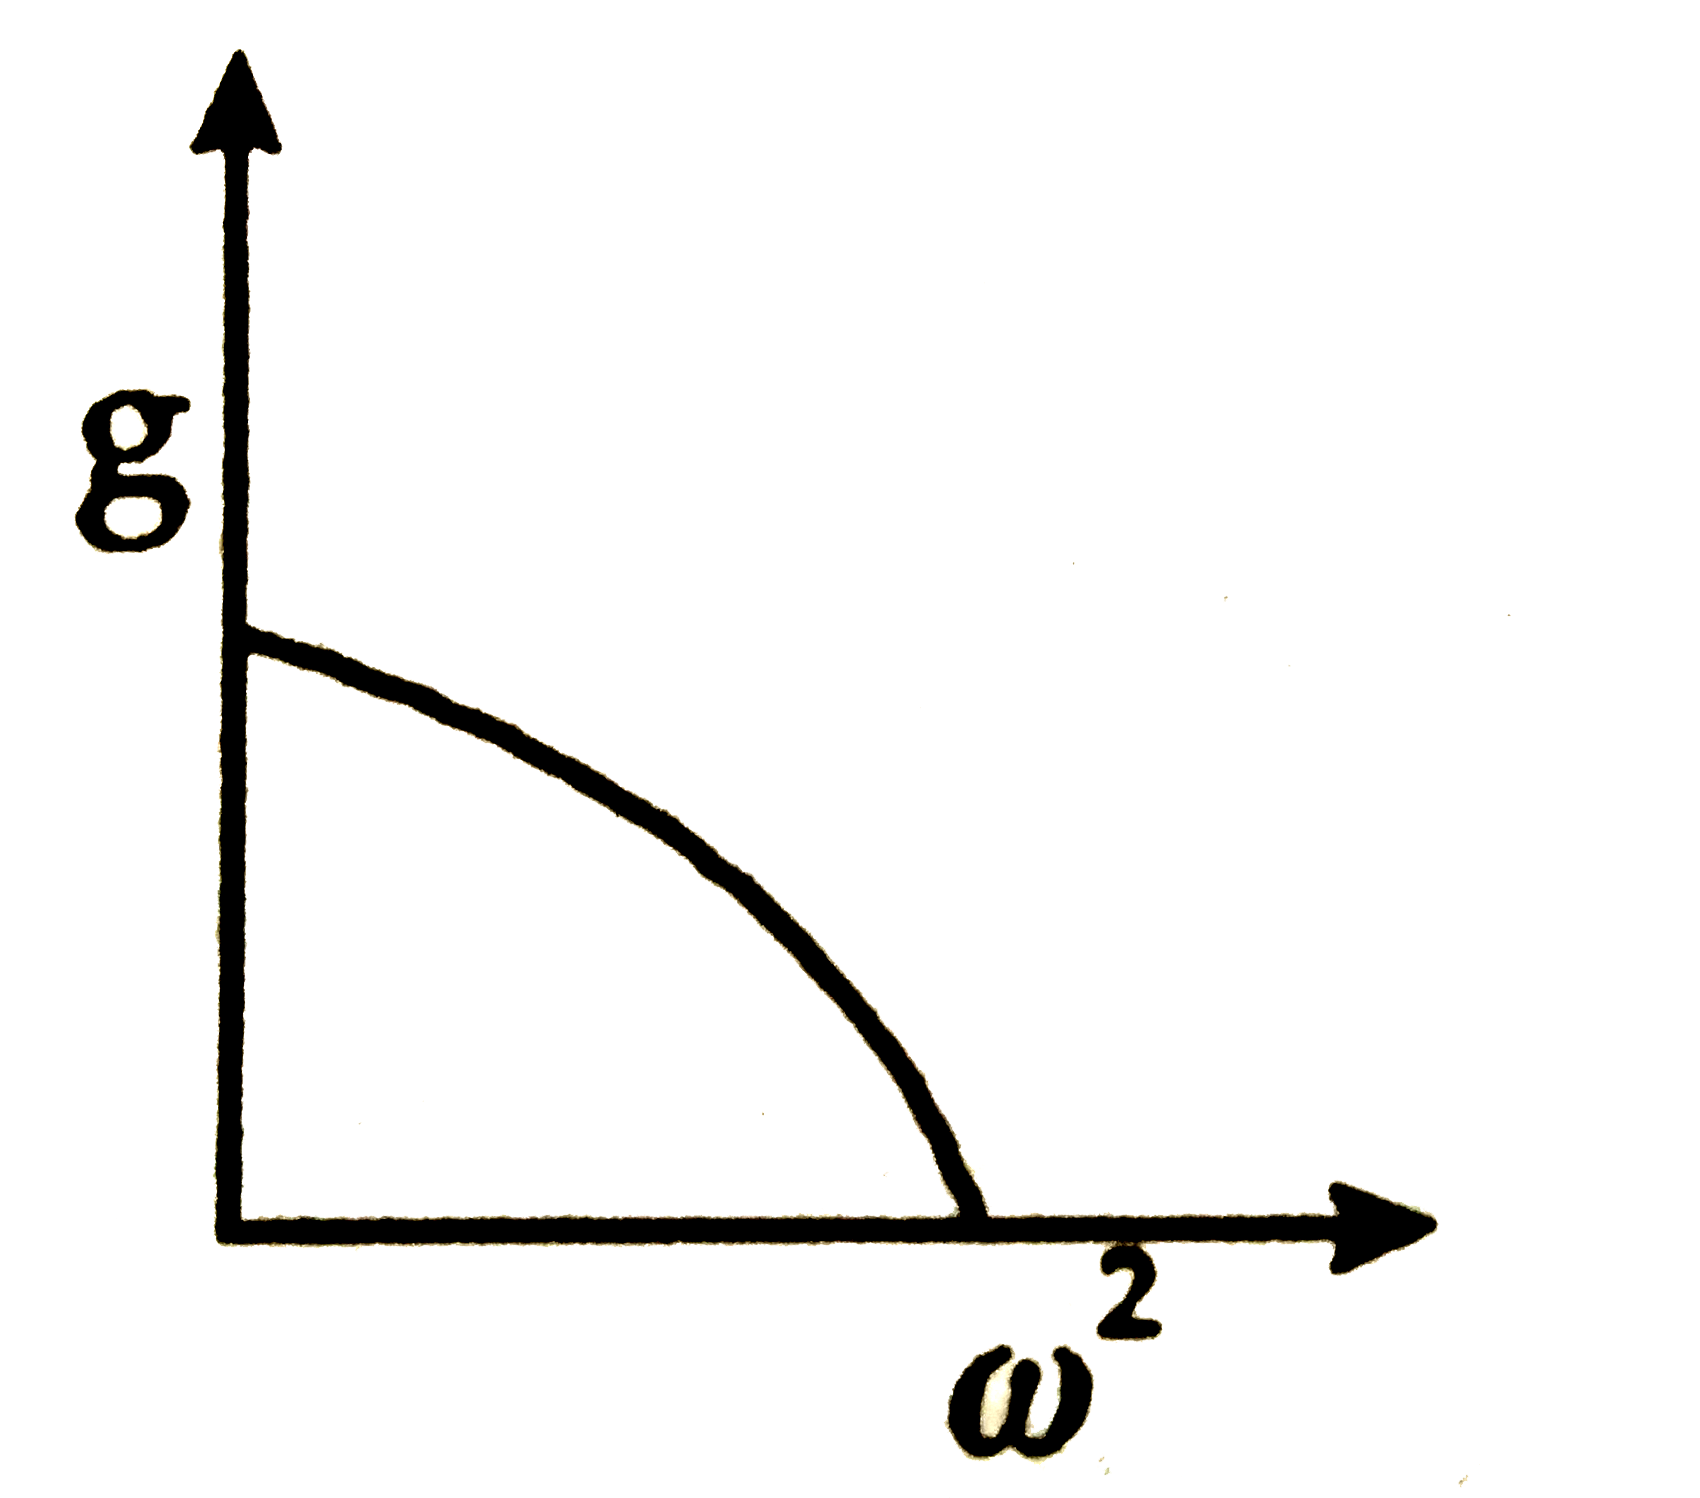
In the usual notation, the acceleration due to gravity at a height h from the surface of the earth is ………………
Ag(GM)(R+h)Bg=GM√R+h.Cg=GM(R+h)2Dg=GM(R+h)2
The radius of the earth is 6,400 km. Calculate the height from the surface of the earth at which the value of g is 81% of the value at the surface.
View SolutionIn the usual notation, the acceleration due to gravity at a height h from the surface of the earth is ……………
View SolutionIf R is the radius of the earth, then the value of acceleration due to gravity at a height h from the surface of the earth will become half its value on the surface of the earth if
View SolutionWhich of the following graphs shows the variation of acceleration due to gravity g with depth h from the surface of the earth ?
View SolutionIf the potential energy of a body at a height h from the surface of the earth is mgR2, then
View Solution
