Study the pie chart given below and answer the following questions. Pie chart shows the percentage distribution of total distance travelled by Anurag on 5 days (Monday, Tuesday, Wednesday, Thursday and Friday).
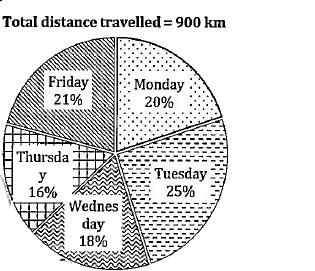
Find average distance travelled by Anurag on Wednesday, Thursday & Friday.
165km
182km
154km
176km
The correct Answer is:A
Step by step video, text & image solution for Study the pie chart given below and answer the following questions. Pie chart shows the percentage distribution of total distance travelled by Anurag on 5 days (Monday, Tuesday, Wednesday, Thursday and Friday). Find average distance travelled by Anurag on Wednesday, Thursday & Friday. by Maths experts to help you in doubts & scoring excellent marks in Class 14 exams.
Updated on:21/07/2023Topper's Solved these Questions
- DATA INTERPRETATIONBOOK - ADDA247CHAPTER - DATA INTERPRETATIONEXERCISE - Prelims Questions (Level-2)
59 Videos
- DATA INTERPRETATIONBOOK - ADDA247CHAPTER - DATA INTERPRETATIONEXERCISE - Mains Questions
33 Videos
- DATA INTERPRETATIONBOOK - ADDA247CHAPTER - DATA INTERPRETATIONEXERCISE - Basic Questions
30 Videos
- BOAT AND STREAM BOOK - ADDA247CHAPTER - BOAT AND STREAM EXERCISE - Previous Year Question
22 Videos
- DATA SUFFICIENCY BOOK - ADDA247CHAPTER - DATA SUFFICIENCY EXERCISE - PREVIOUS YEAR QUESTIONS
25 Videos
Similar Questions
Study the pie chart given below and answer the question that follow
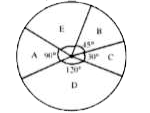
Which heads is allocated maximum funds?
View SolutionStudy the following information carefully and answer the given questions.
The following chart shows the opening, closing, high and low price of a share of a company XYZ on given 5 days-Monday, Tuesday, Wednesday, Thursday and Friday.
Opening and closing price of the shares of the company XYZ are represented by ceiling and floor of the black box and floor and ceiling of the white box respectively. The high and low price of the share of the company XYZ are represented by ceiling and floor of the line respectively
For example: On Monday, opening price = 60, closing price = 52, high price = 66 and low price = 40
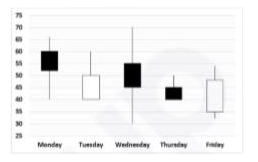
What is the ratio of average high price and average low price of the share of the company XYZ on Monday, Tuesday, Wednesday and Friday?
View Solution
Knowledge Check
The average temperature of Monday Tuesday Wednesday and Thursday was 38∘and that of Tuesday Wednesday Thursday and Friday was 40∘ if the temperature on Monday was 30∘ the temperature of Friday was
A40∘B39∘C38∘D30∘
Study the following information carefully and answer the given questions.
The following chart shows the opening, closing, high and low price of a share of a company XYZ on given 5 days-Monday, Tuesday, Wednesday, Thursday and Friday.
Opening and closing price of the shares of the company XYZ are represented by ceiling and floor of the black box and floor and ceiling of the white box respectively. The high and low price of the share of the company XYZ are represented by ceiling and floor of the line respectively
For example: On Monday, opening price = 60, closing price = 52, high price = 66 and low price = 40
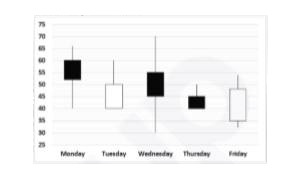
Average closing price of shares of the company XYZ is what percent more than the average opening price for the given 5 days?
View SolutionStudy the following information carefully and answer the given questions.
The following chart shows the opening, closing, high and low price of a share of a company XYZ on given 5 days-Monday, Tuesday, Wednesday, Thursday and Friday.
Opening and closing price of the shares of the company XYZ are represented by ceiling and floor of the black box and floor and ceiling of the white box respectively. The high and low price of the share of the company XYZ are represented by ceiling and floor of the line respectively
For example: On Monday, opening price = 60, closing price = 52, high price = 66 and low price = 40
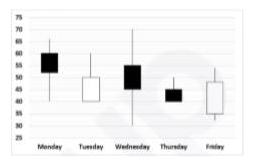
A trader, bought 150 shares of the company XYZ on opening price of Tuesday and sold 40% these shares on highest price of the share on Thursday and rest on opening price of Friday. Rate of commission while buying the shares is Flat Rs. 200 and while selling it is 8% of the selling price, then what is the total loss incurred by the trader in this transaction?
View SolutionDirection: Study the following information carefully and answer the given questions: The following pie chart shows the percentage distribution of total number of Apples (Dry +dry)
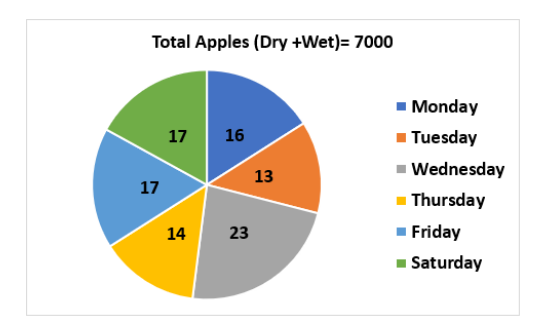
The pie chart2 shows the percentage distribution of total number of Apples (Wet) sold in different days of a week.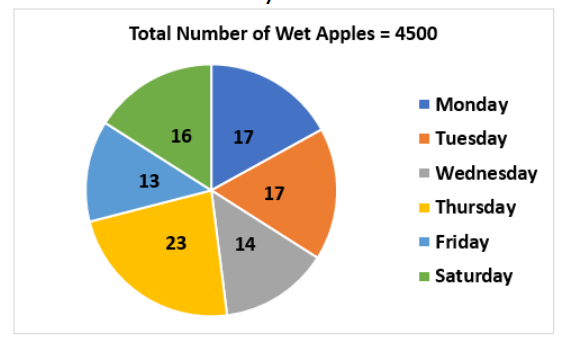
Find the difference the Apples (Wet) sold on Tuesday to the apples (Wet + Dry) sold on Thursday?
View SolutionStudy the data given below and answer the following question. The pie charts shown below shows the distance covered by a boat moving upstream and downstream in different days of a week. And the table shows the speed of stream in km/hr. in different days of a week.
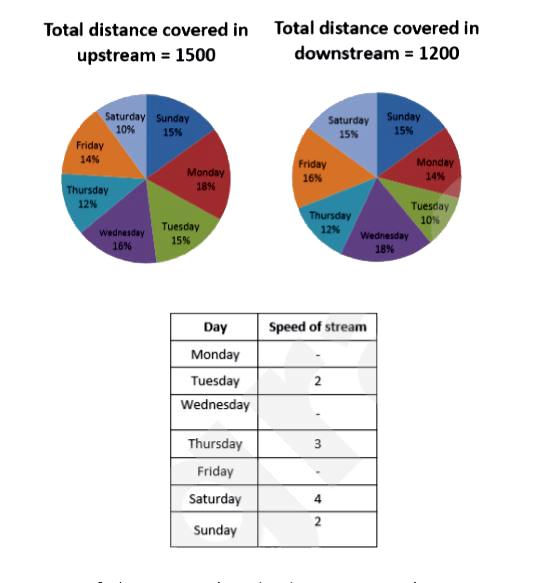
If the speed of boat in still water on Friday was 22 km/hr and the speed of boat in still water on Tuesday was 10/11 times of Friday and time taken to travel downstream on Friday is 20/11 hrs more than the time taken by it to travel downstream on Tuesday, then find the speed of stream (in kmph) on Friday?
View SolutionDirection: Study the following information carefully and answer the given questions: The following pie chart shows the percentage distribution of total number of Apples (Dry +dry)

The pie chart2 shows the percentage distribution of total number of Apples (Wet) sold in different days of a week.
What percentage of dry apples sold on Monday and Tuesday together?
View SolutionDirection: Study the following information carefully and answer the given questions: The following pie chart shows the percentage distribution of total number of Apples (Dry +dry)

The pie chart2 shows the percentage distribution of total number of Apples (Wet) sold in different days of a week.
What is the ratio of dry apples sold on Monday to that sold on Saturday?
View SolutionDirection: Study the following information carefully and answer the given questions: The following pie chart shows the percentage distribution of total number of Apples (Wet +dry)

The pie chart2 shows the percentage distribution of total number of Apples (Wet) sold in different days of a week.
If the Apples (dry) sold on Sunday is 60 % more than the Apples (dry) sold on Saturday. Find the total Apples (dry) sold on Sunday and Saturday together?
View Solution
