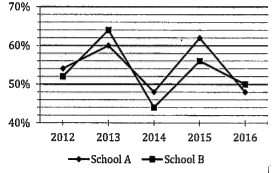
Given below is the line graph which shows the percentage of boys in two school A and B in 5 different years.

Total students in any school = Total boys + Total girls in each school
If total students in school A in 2015 and total student in B in 2013 are 700 and 400 respectively, then find the average number of boys in school A in 2015 and boys in school B in 2013.
344
345
348
368
The correct Answer is:B
Step by step video, text & image solution for Given below is the line graph which shows the percentage of boys in two school A and B in 5 different years. Total students in any school = Total boys + Total girls in each school If total students in school A in 2015 and total student in B in 2013 are 700 and 400 respectively, then find the average number of boys in school A in 2015 and boys in school B in 2013. by Maths experts to help you in doubts & scoring excellent marks in Class 14 exams.
Updated on:21/07/2023Topper's Solved these Questions
- DATA INTERPRETATIONBOOK - ADDA247CHAPTER - DATA INTERPRETATIONEXERCISE - Prelims Questions (Level-2)
59 Videos
- DATA INTERPRETATIONBOOK - ADDA247CHAPTER - DATA INTERPRETATIONEXERCISE - Mains Questions
33 Videos
- DATA INTERPRETATIONBOOK - ADDA247CHAPTER - DATA INTERPRETATIONEXERCISE - Basic Questions
30 Videos
- BOAT AND STREAM BOOK - ADDA247CHAPTER - BOAT AND STREAM EXERCISE - Previous Year Question
22 Videos
- DATA SUFFICIENCY BOOK - ADDA247CHAPTER - DATA SUFFICIENCY EXERCISE - PREVIOUS YEAR QUESTIONS
25 Videos
Similar Questions
Knowledge Check

Total number of boys in School T.A500B600C750D85060% of students in a school are boys. The number of girls in the school is 300 then the number of boys is
Aa)500Bb)300Cc)450Dd)750There are total 200 students in a school of which(25)th are boys. Find the number of girls in the school.
A100B60C120D80
70% of the students in a school are boys and the number of girls is 504 find the number of boys in the school
View Solutionin a school 5/7 of the students are boys . if there are 300 girls, find the number of boys in school
View SolutionIf 60% of students in a school are boys and the total number of girls in the school is 460, find the number of boys in the school.
View Solution45% of the students in a school are boys. If the total number of students in the school is 880, find the number of girls in the school.
View Solution70% of students in a school are boys, if the number of girls is 240, how many boys are there in the school?
View Solution

