Study the following graph that shows the number of boys and girls who appeared for the Class X examination in a school XYZ, in different years.
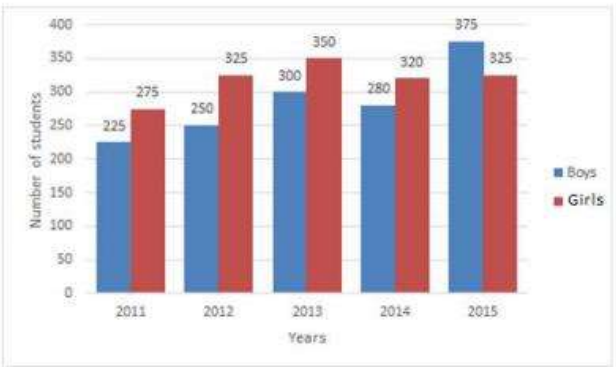
The average of the number of boys who appeared in 2011, 2013 and 2015 is what percentage less than the number of girls who appeared in 2012 (correct to one decimal place)?
8.1
8.5
6.9
7.7
The correct Answer is:D
Step by step video, text & image solution for Study the following graph that shows the number of boys and girls who appeared for the Class X examination in a school XYZ, in different years. The average of the number of boys who appeared in 2011, 2013 and 2015 is what percentage less than the number of girls who appeared in 2012 (correct to one decimal place)? by Maths experts to help you in doubts & scoring excellent marks in Class 14 exams.
Updated on:21/07/2023Similar Questions
The following graph shows the number of boys and girls in Class V, Class VI, Class VII and Class VIII. Study the graph and answer the question.
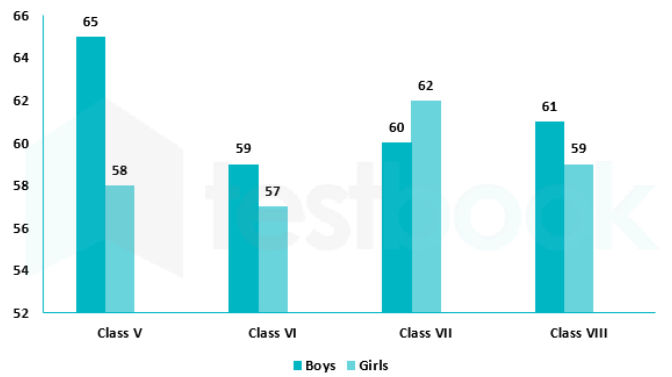
What is the average number of girls in all the classes?
View SolutionThe given bar graph represents the number of students who appeared in the board examination in session 2017-18 and 2018-19. Study the graph and answer the question that follows.
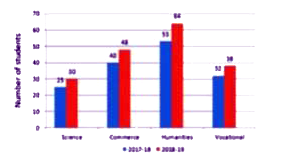
What percentage is the total number of students who appeared in 2017-18 is less than the total number of students who appeared in 2018-19?
View Solution
Knowledge Check
Study the following table and answer question.
Number of students appeared in an examination from five citie s:
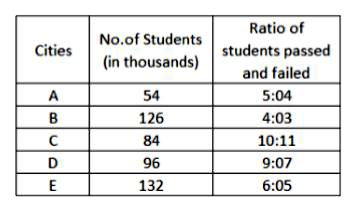
The total number of students who appeared in the examination from cities C and D is what percent more than the total number of students who failed in cities A, B and E ? (nearest to an integer)A44B30C41D42The average score of boys in an examination of a school is 71 and that of girls is 73. The average score of school in that examinations is 71.8. The ratio of the number of boys to the number of girls appeared in the examination, is
A3:2B3:4C1:2D2:1The ratio of the number of boys and girls in a college in 3:2. If 20% of boys and 25% of girls are adults, the percentage of those students who are not adults, is
A0.58B0.675C0.78D0.825
The average score of girls in class X examination in a school is 73 and that of boys is 71. The average score in class X of that school is 71.8. Find the percentage of the number of girls and boys in class X of the school.
View SolutionThe following graph shows the number of boys and girls in Class V, Class VI, Class VII and Class VIII. Study the graph and answer the question.
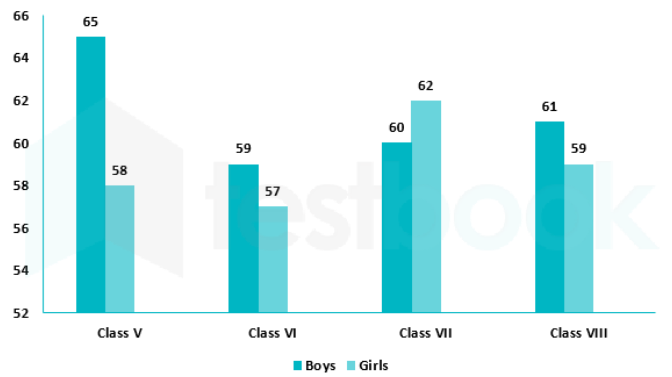
What class has the maximum number of students?
View SolutionThe following bar graph shows the total number of students (Boys+Girls) and the total number of boyes who participated in different sports .
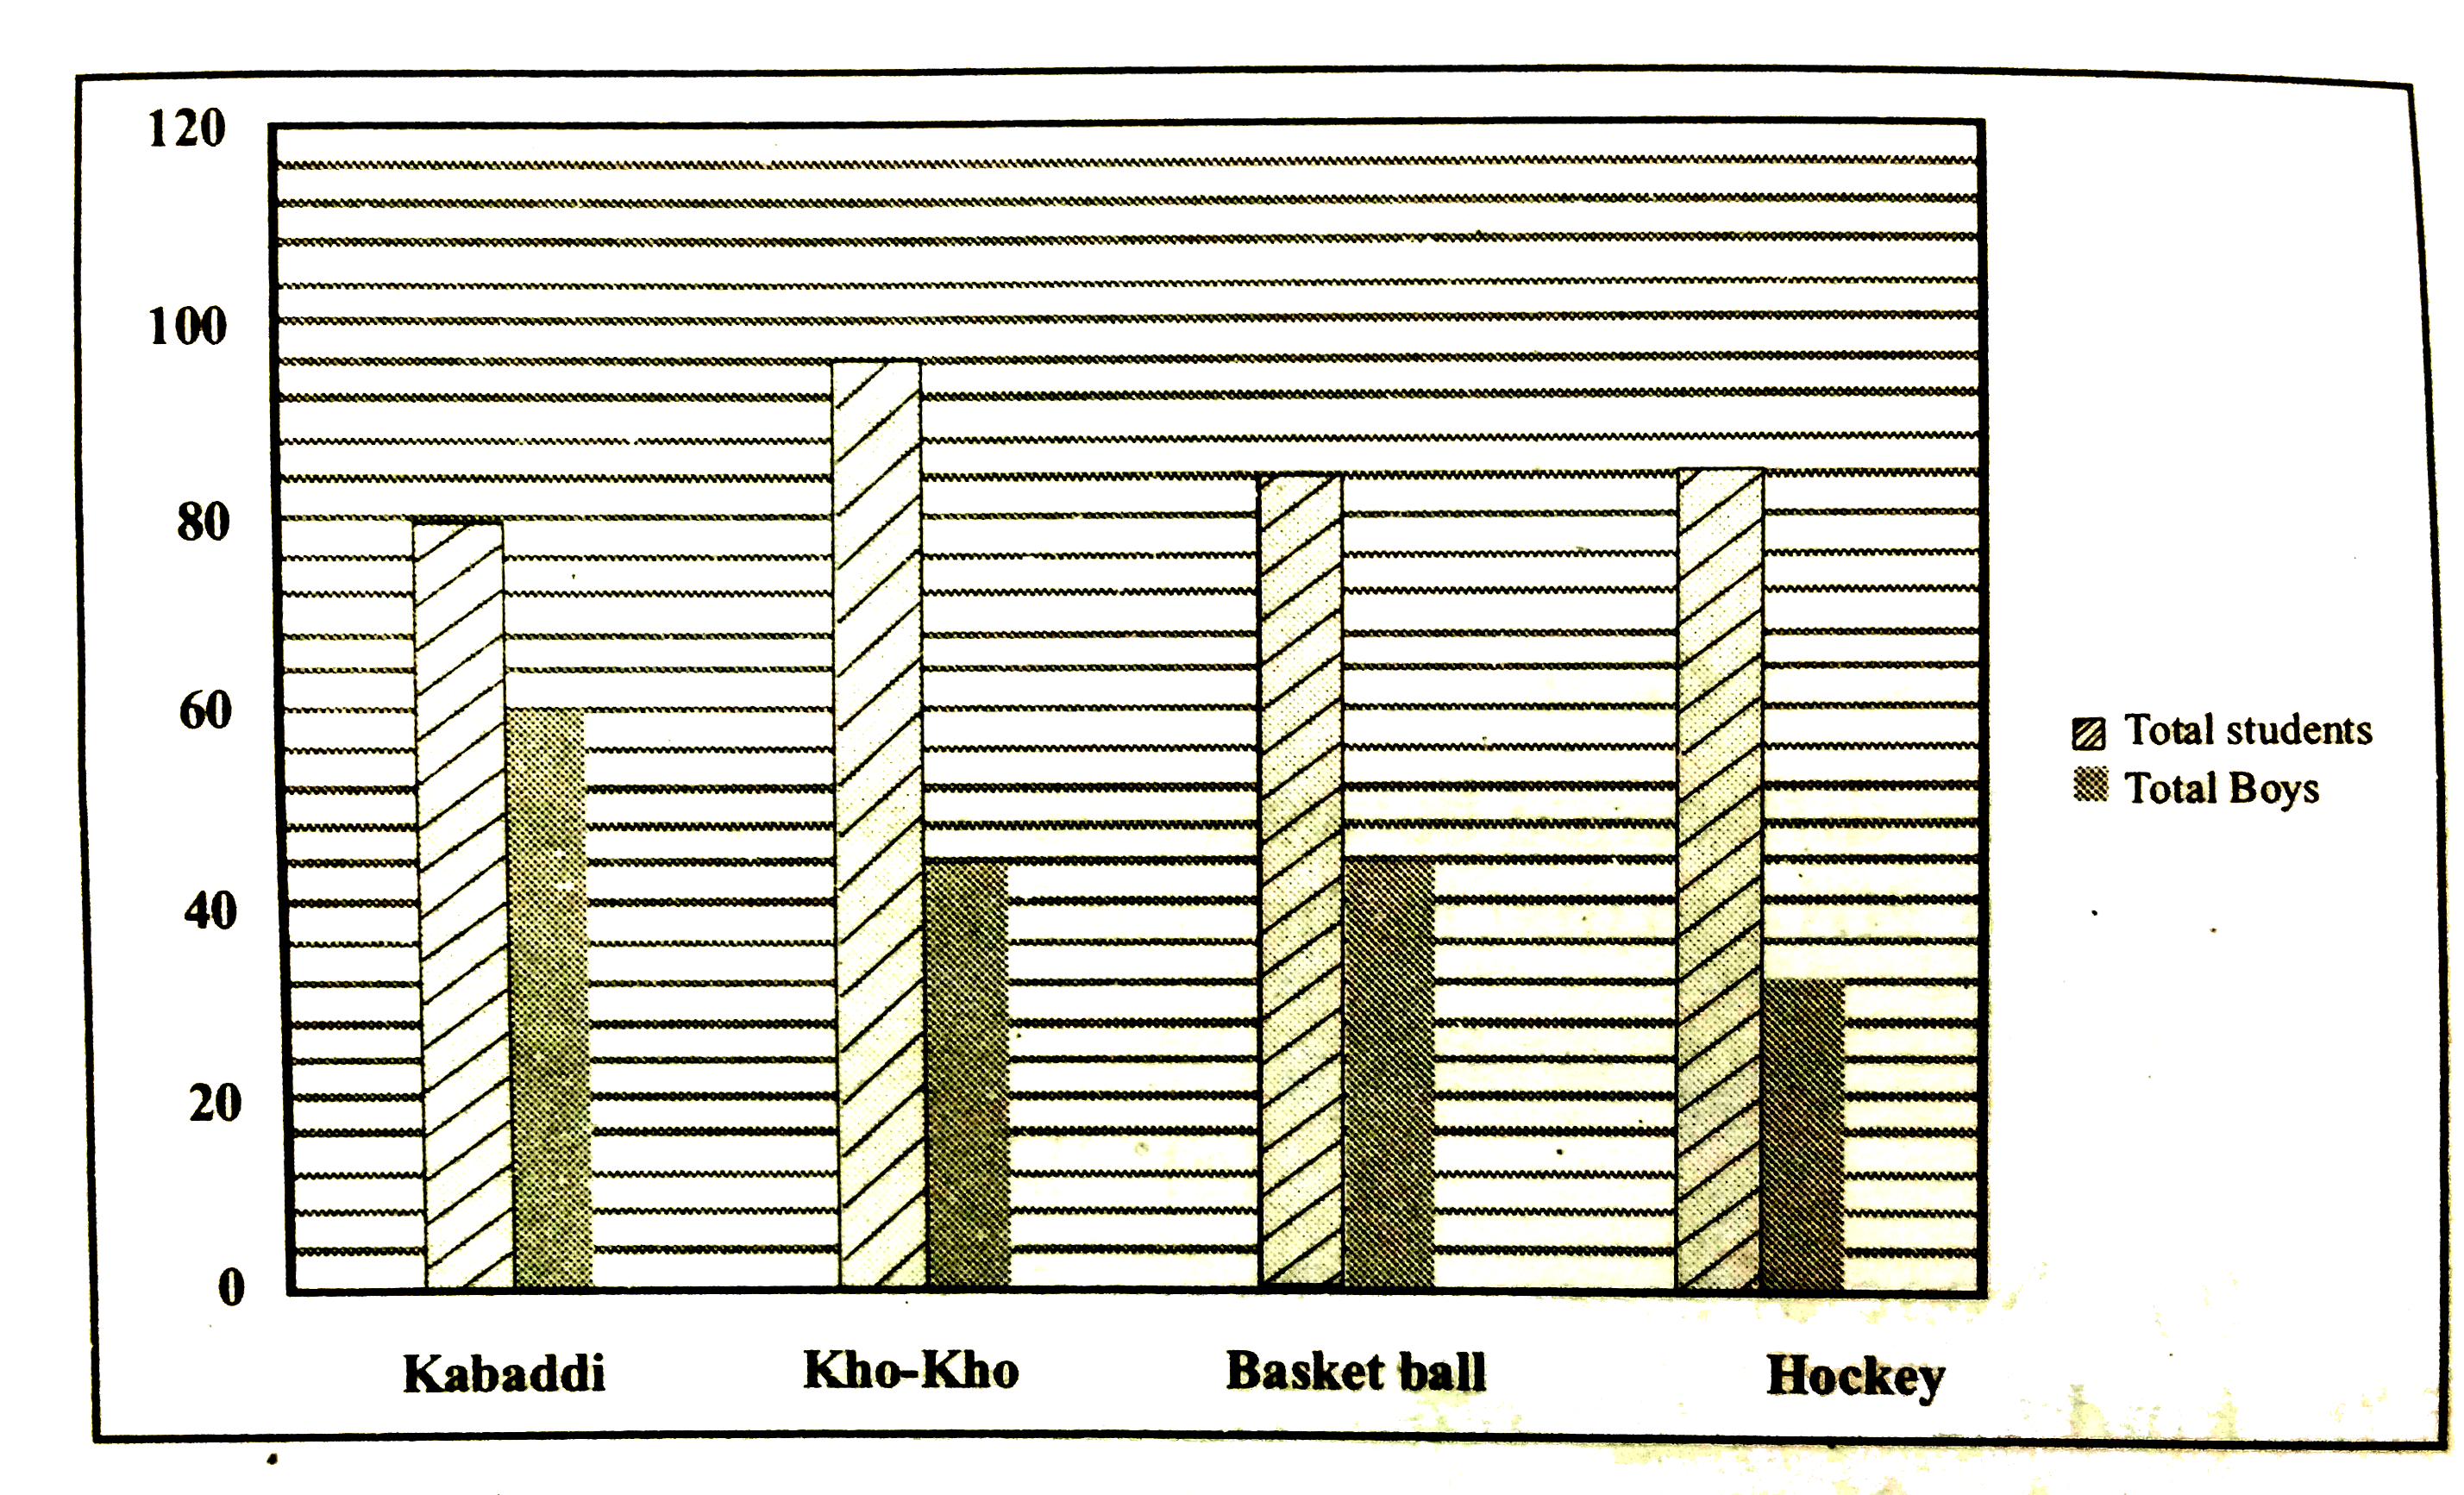
Find the average of the girls participated in all four sports together ?
View SolutionThe following bar graph shows the total number of students (Boys+Girls) and the total number of boyes who participated in different sports .
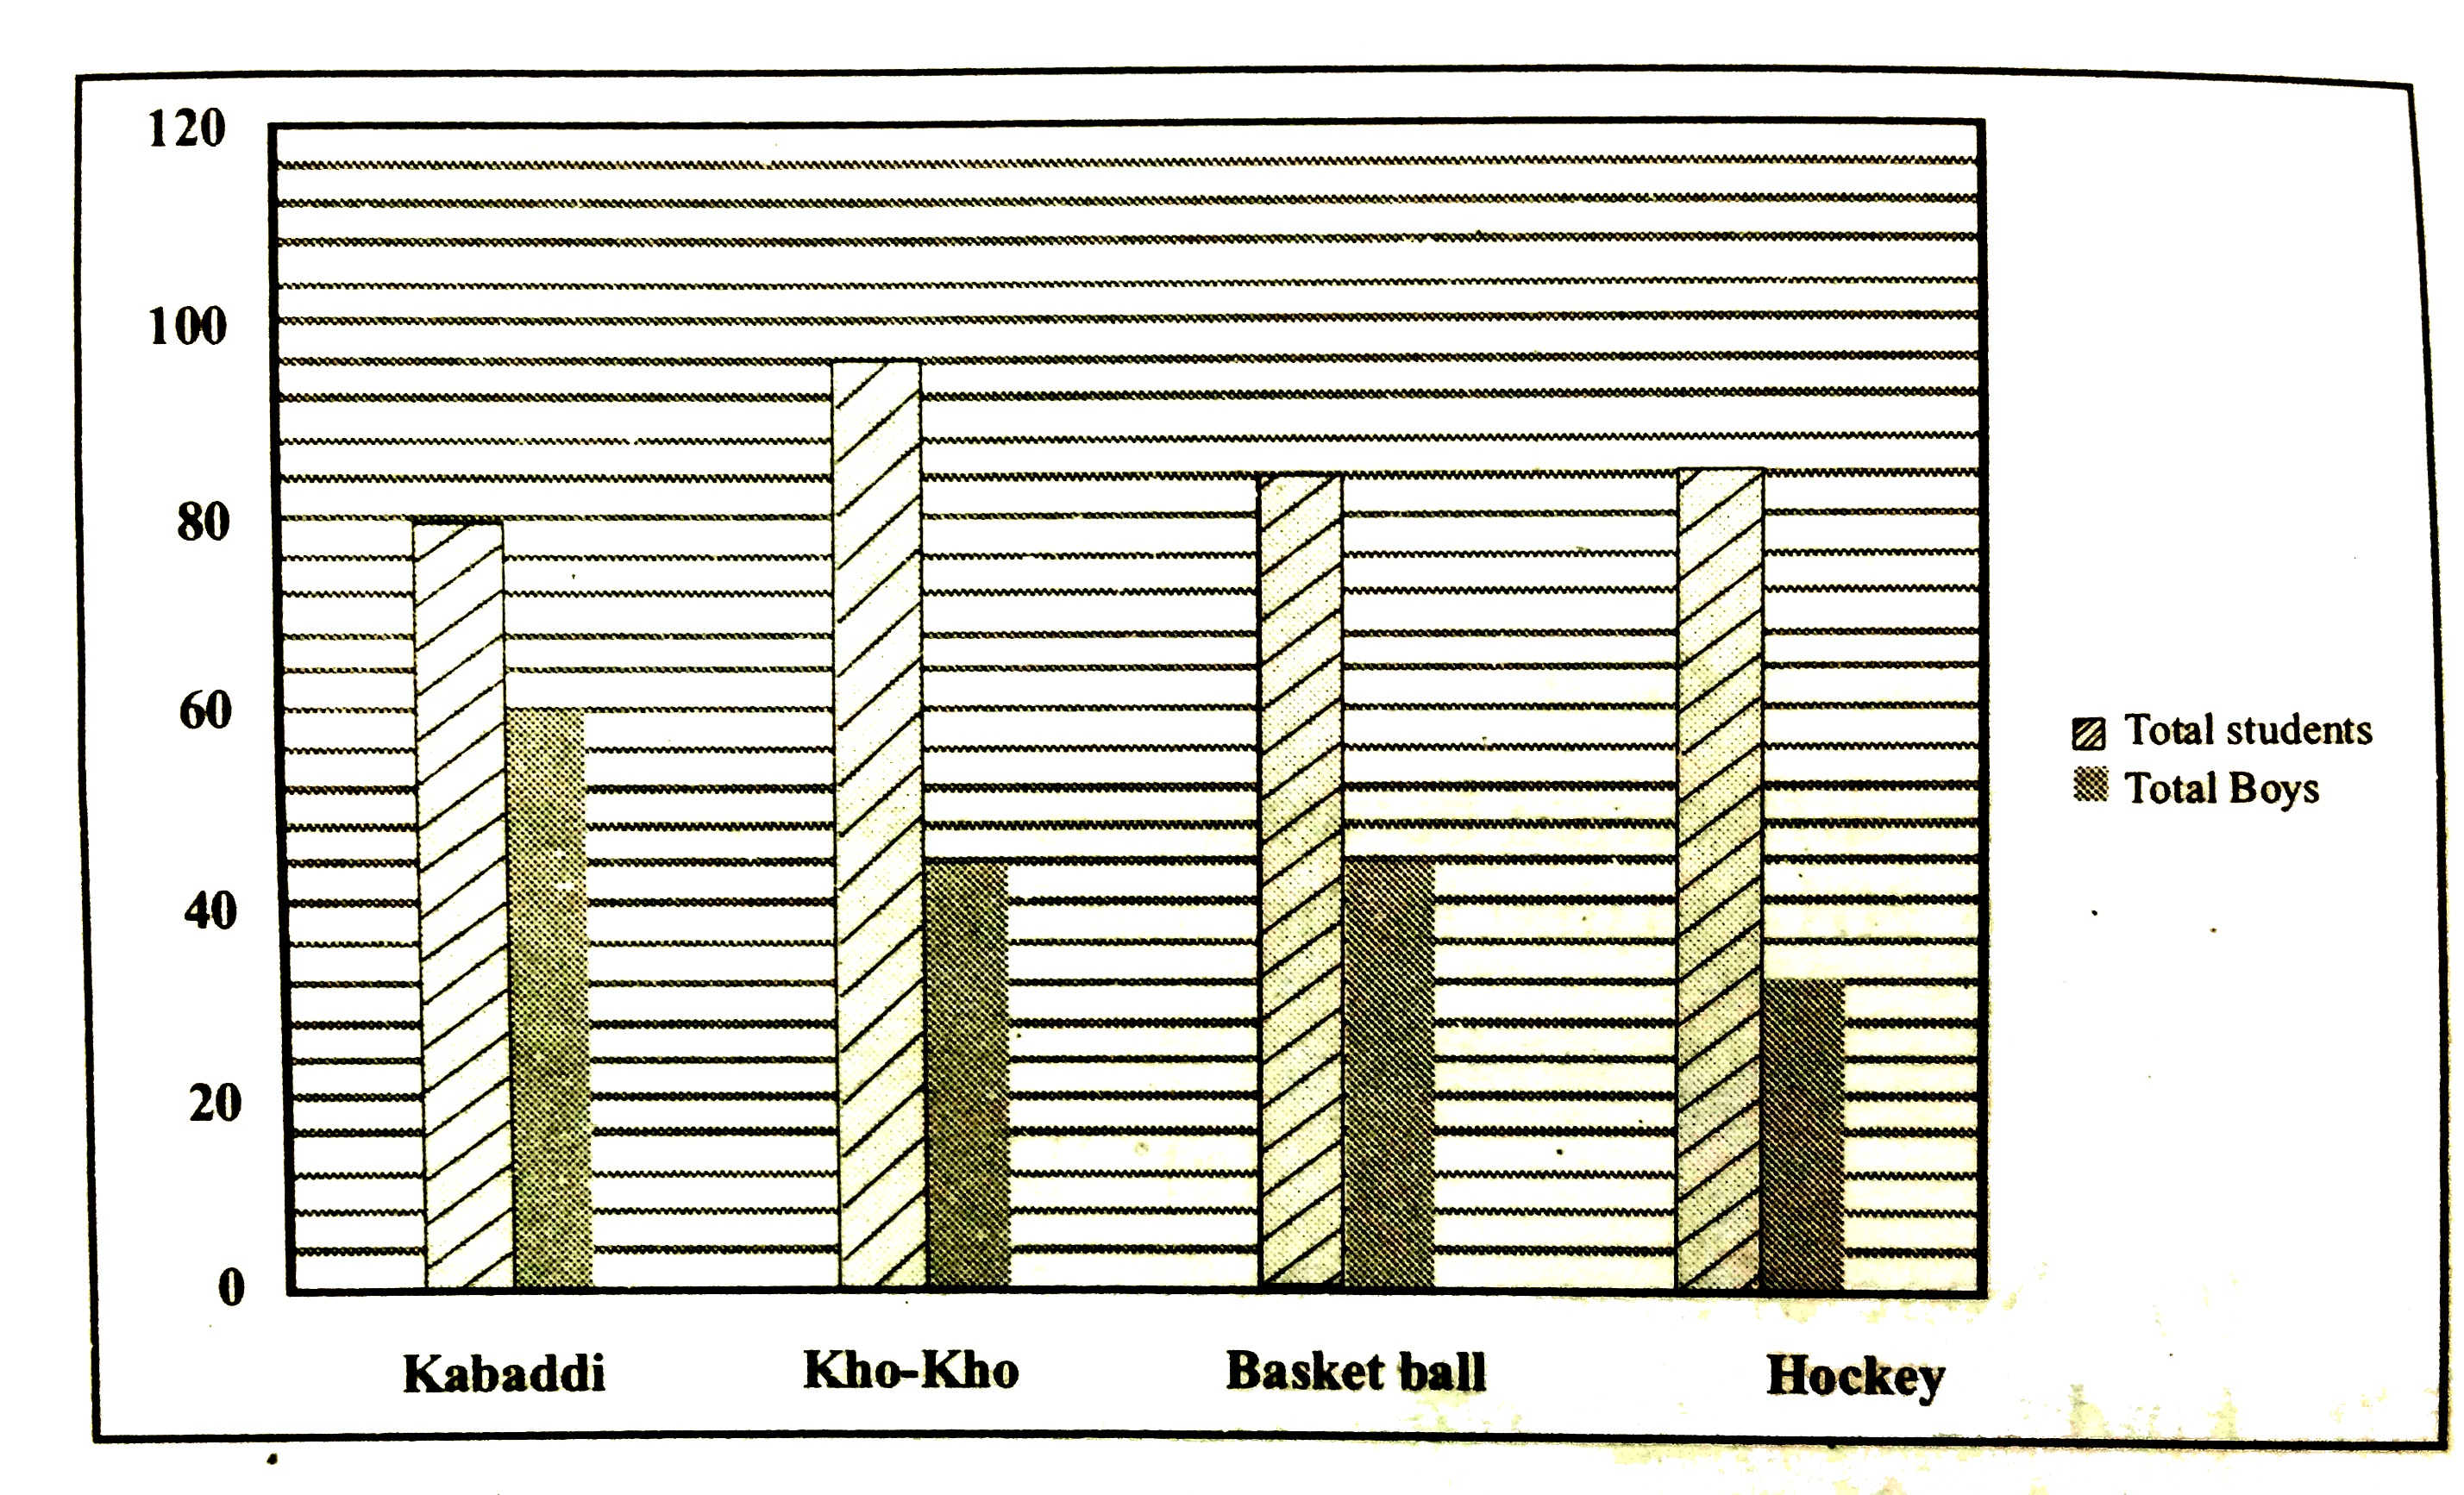
Total number of girls participated in Kho-Kho is approximately what percentage of total number of boys participated in Basket ball ?
View SolutionThe following bar graph shows the total number of students (Boys+Girls) and the total number of boyes who participated in different sports .
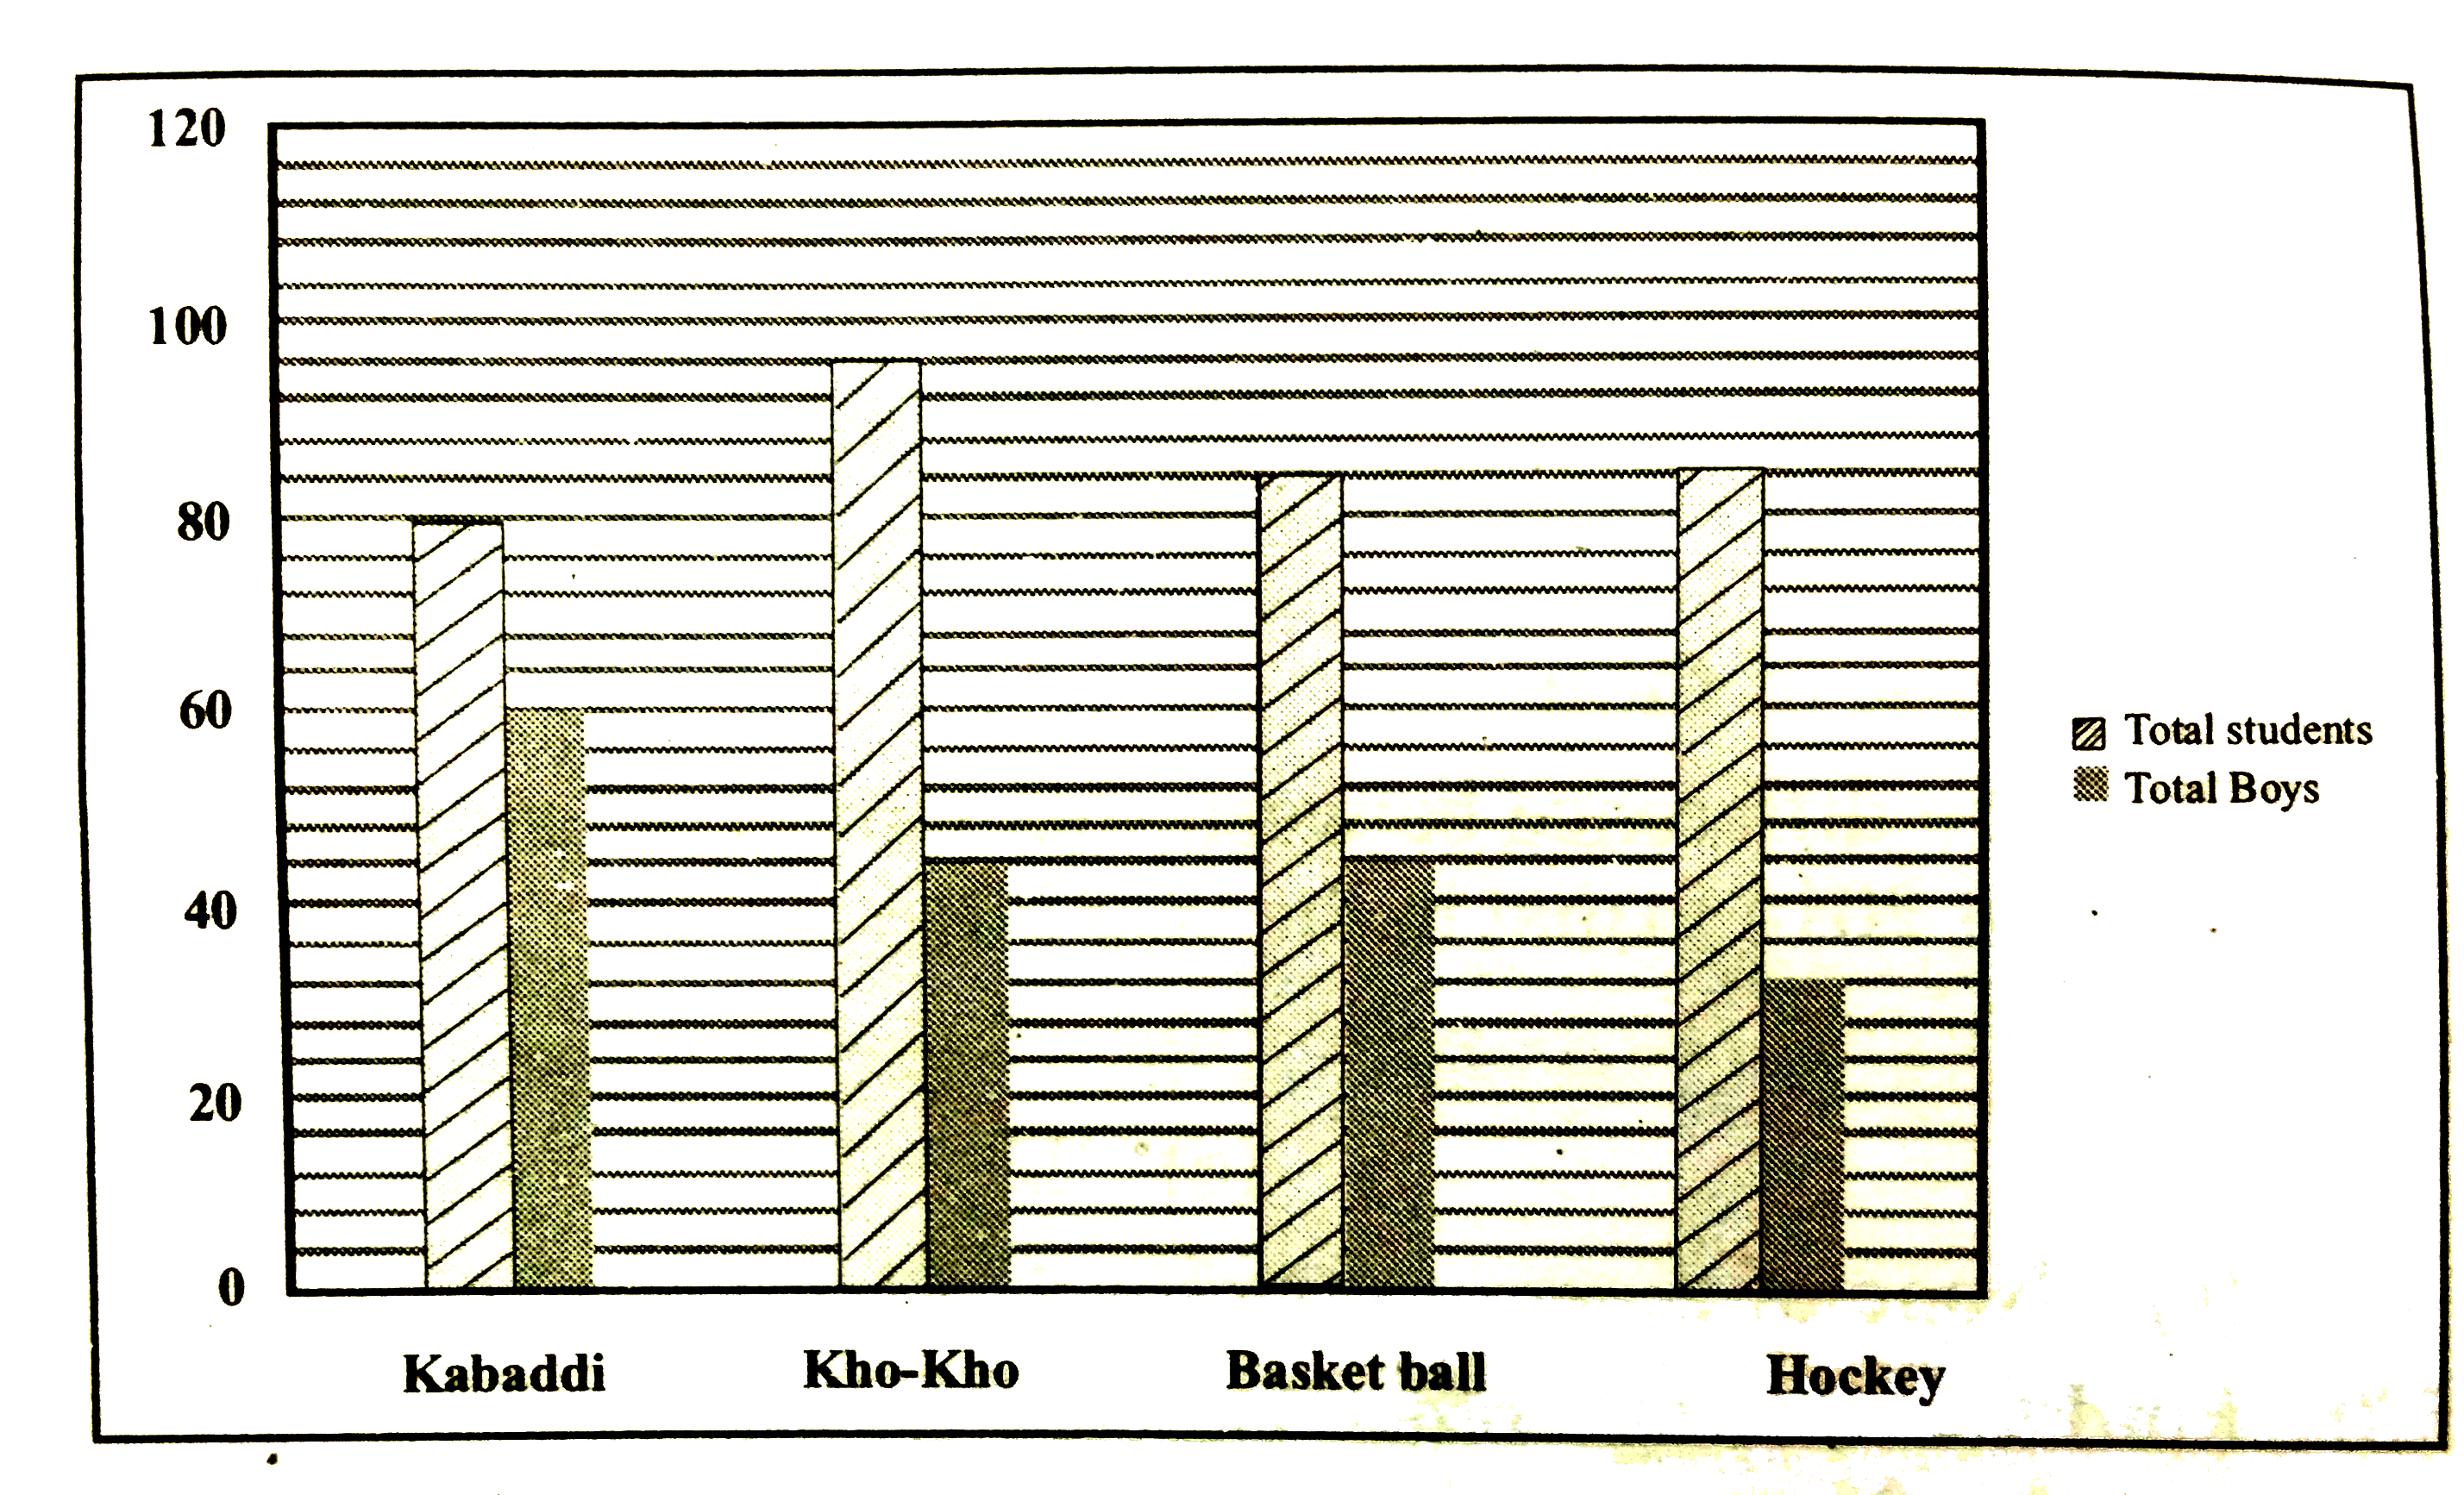
Find the difference between the number of boys participated in Kho-Kho with the number of girls participated in Basket ball ?
View Solution
