The Gupta family spends their monthly income on different heads as shown in the following pie chart.
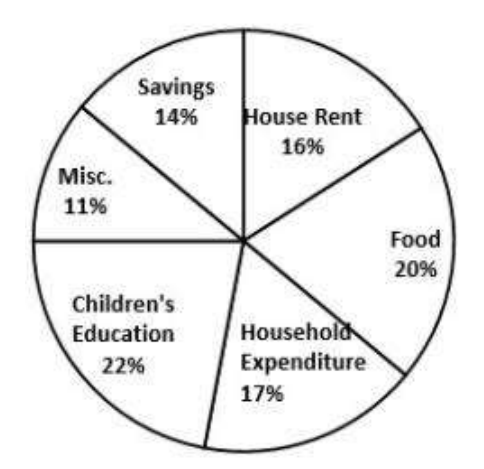
What is the central angle of the combined section for House Rent and Savings?
30∘
100∘
90∘
108∘
The correct Answer is:D
Step by step video, text & image solution for The Gupta family spends their monthly income on different heads as shown in the following pie chart. What is the central angle of the combined section for House Rent and Savings? by Maths experts to help you in doubts & scoring excellent marks in Class 14 exams.
Updated on:21/07/2023Similar Questions
Knowledge Check
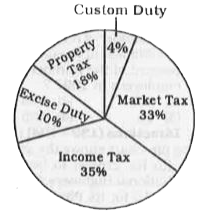
The income of a state under different heads is given in the following pie-chart. Study the chart and answer the questions.
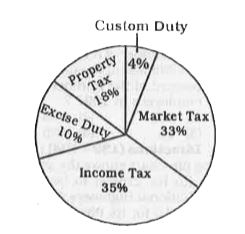
The central angle of the sector representing income tax is :A126∘B135∘C150∘D119∘The income of a state under different heads is given in the following pie-chart. Study the chart and answer the questions.
If the total income in a year be Rs 733 crores then the income (in Rs crores) from 'Income tax' and 'Excise duty' is :A329.85B331.50C331.45D329.80The income of a state under different heads is given in the following pie-chart. Study the chart and answer the questions.
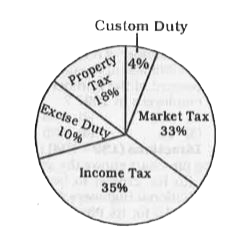
If the income from the market tax in a year be Rs 165 crores then the total income from other sources in (in Rs crore)A325B335C365D345
The following pie-chart shows the monthly expenditure of a family on food, house rent clothing, education, fuel and miscellaneous Study the pie-chart
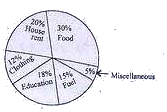
The central angle of the sector for the expenditure on fuel (in degrees) is
View SolutionThe following pie-chart shows the monthly expenditure of a family on food, clothing, rent, miscellaneous expenses and savings. What is the central angle for savings?
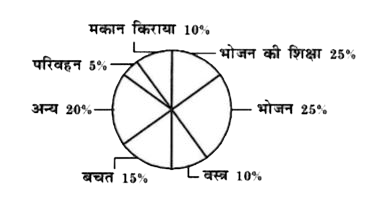
View SolutionThe following pie - chart shows the monthly expenditure of a family on food, clothing, rent, miscellaneous expenses and savings. What is the central angle for savings ?
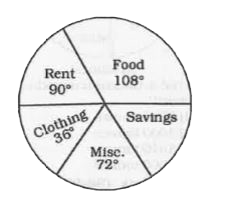
View SolutionThe Expenditure of a family in a month is represented by a Pie-chart. Read it carefully to answer the questions.
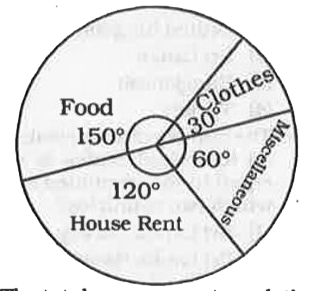
The percentage of money spent on food compared to house rent is
View SolutionThe pie chart given below shows the spending of a family on various heads during a month. Study the graph and answer the following questions.
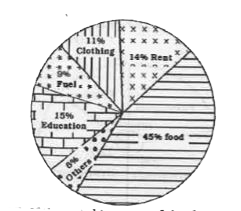
If the total income of the family is Rs 25,000, then the amount spent on Rent and Food together is
View Solution

