Study the following bar graph and answer the question given below
The given bar graph represents the total number of applications received for the B.Com course by two different colleges A and B in five different years
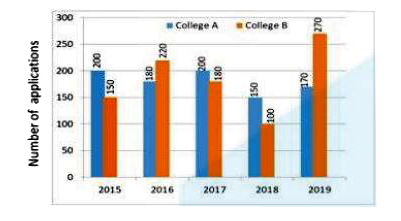
The ratio of the total number of applications received by college a in 2016 and 2017 together to the total number of applications received by college B in 2016 and 2017 together is
18:19
15:17
19:20
15:19
The correct Answer is:C
Step by step video, text & image solution for Study the following bar graph and answer the question given below The given bar graph represents the total number of applications received for the B.Com course by two different colleges A and B in five different years The ratio of the total number of applications received by college a in 2016 and 2017 together to the total number of applications received by college B in 2016 and 2017 together is by Maths experts to help you in doubts & scoring excellent marks in Class 14 exams.
Updated on:21/07/2023Similar Questions
Knowledge Check
Read the following graph carefully and answer the questions given below.
Number of passed students (boys and girls) from different colleges in a year (in thousands)
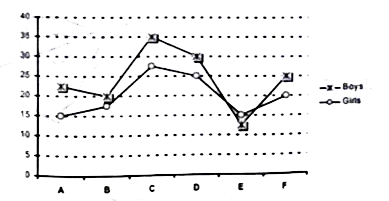
The total number of passed girls from college E and F together is approximately what percent of total number of passed boys from college B and C together ?A58B73C82D64The table given below shows the number of students strudying in five colleges in the given five years.
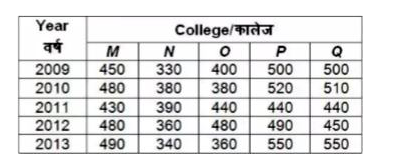
What is the ratio of the total number of students of college N in all years to the total number of students of all the colleges styding in the year 2011?A100 : 107B90 : 107C90 : 119D90 : 127Study the following graph carefully and answer the questions that follow
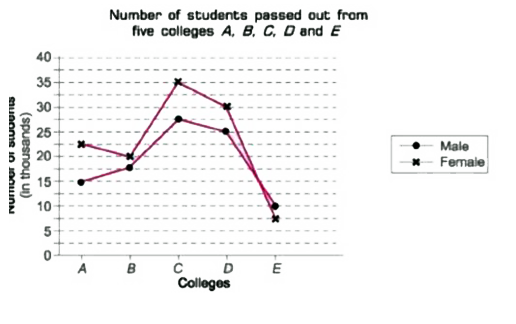
What is the difference between the total number of students passing out from collegee A and the total number o students passing out from college El.A20500BNone of theseC10500D10000
Study the following bar graph and answer the question given
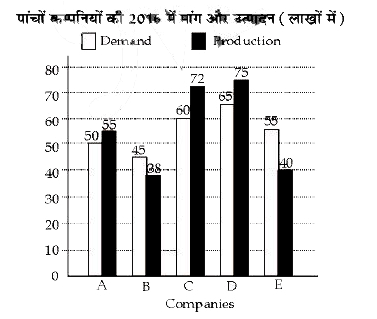
The ratio of the total demand of motorcycles of companies A,C and E to the total production of motorcycles of B and C is:
View SolutionDirections: Refer to the following graph and answer the given questions. Data related to the number of shoes sold by two stores (A and B )during five years:
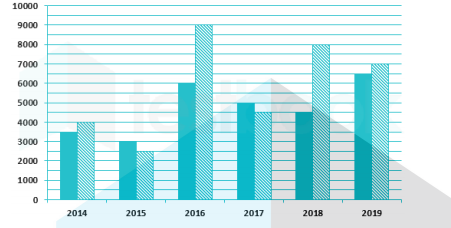
What is the difference between the total number of shoes sold by store A in 2018 and 2019 together and the total number of shoes sold by store B in 2014 and 2015 together?
View SolutionStudy the bar graph and answer the question
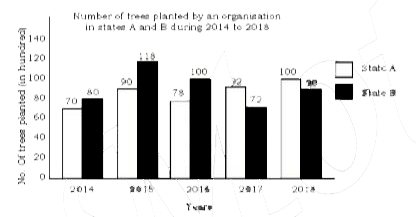
The total number of trees planted in state B in 2015 and 2017 was what percentage less than the total number of trees planted in state A in 2014 2016 and 2017
View SolutionDirections: Refer to the following graph and answer the given questions. Data related to the number of shoes sold by two stores (A and B )during five years:
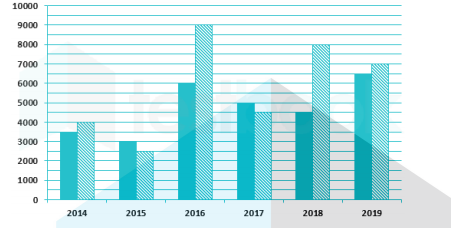
Find the ratio between the total number of shoes sold by stores A and B together in 2016 to the total number of shoes sold by stores A and B together in 2018?
View SolutionThe table given below shows the number of students enrolled in different courses of different colleges.
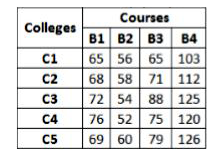
What is the difference in the total number of students enrolled in colleges C3 and C4?
View Solution

