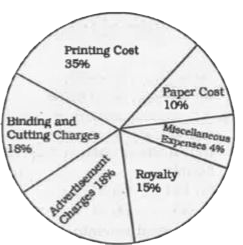
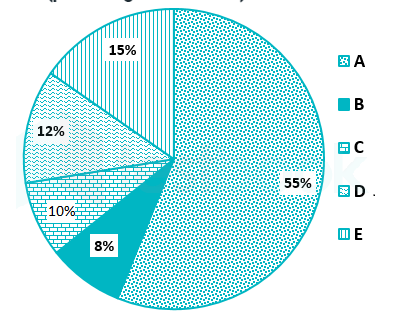
Study the following pie chart and table and answer the question given below.
The given chart represents the percentage distribution of the population of six villages A, B, C, D., E and F in 2016.
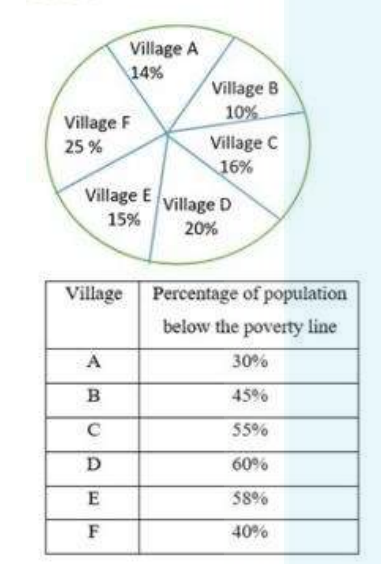
The difference in the central angles of villages B and E is:
The correct Answer is:C
Step by step video, text & image solution for Study the following pie chart and table and answer the question given below. The given chart represents the percentage distribution of the population of six villages A, B, C, D., E and F in 2016. The difference in the central angles of villages B and E is: by Maths experts to help you in doubts & scoring excellent marks in Class 14 exams.
Updated on:21/07/2023Similar Questions
Knowledge Check
Study the following Pie-Chart carefully to answer the questions given below.
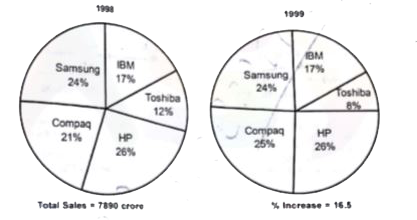
IBM's sales in 1998 is what percentage of the sales of Samsung in 1999 ?A0.4634B0.5234C0.57D0.608Study the following pie chart carefully and answer the questions. The pie chart represents the percentage of people involved in various occupations.

The ratio of the people involved in service to that in industry isA1:2B2:3C3:4D3:2Study the following pie chart carefully and answer the questions. The pie chart represents the percentage of people involved in various occupations.

The angle made by the people involved in service in the given pie-chart isA36∘B90∘C72∘D108∘
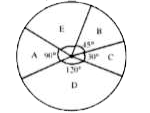
Study the following pie-chart and answer the given question.
The pie-chart shows the Budget Expenditure of a company in the year 2018 (percentage distribution) on different heads AB.C,D & E.
The central angle of the sector representing expenditure on head E is:
View SolutionStudy the following Pie-Chart carefully to answer the questions given below.
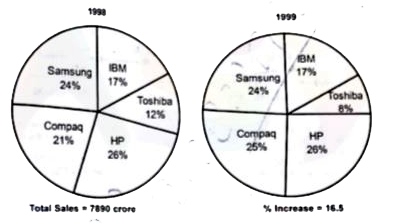
The percentage increase/decrease in the sales of Toshiba in 1999 is approximately-
View SolutionStudy the following pie chart carefully and answer the questions. The pie chart represents the percentage of people involved in various occupations.

The difference between the maximum number of people involved and minimum number of people involved in various professions is
View SolutionStudy the following line chart carefully and answer the questions given below it. The following line chart represents the number of employees recrulted in different years in a company.
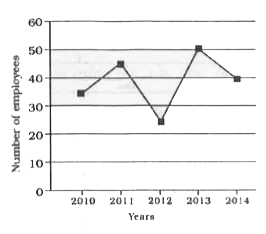
If the number of employees before 2010 was 640, what was percentage increase in 2010?
View SolutionStudy the following pie-charts carefully to answer the questions.
Percentage break-up of number of children in five different villages
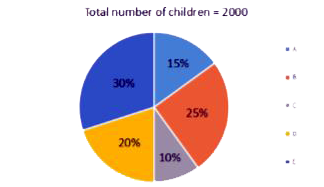
What is the total number of children in village B and E ?
View Solution

