Study the following pie chart and table and answer the question given below.
The given chart represents the percentage distribution of the population of six villages A, B, C, D, E and F in 2016.
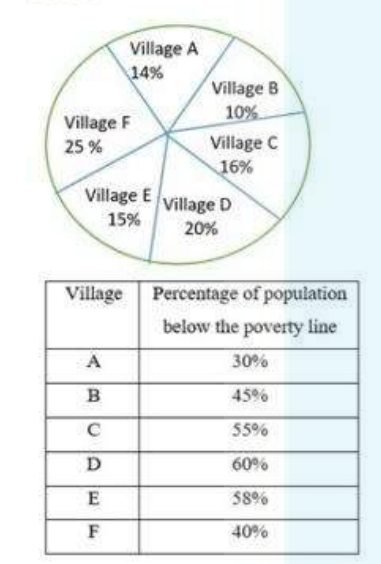
If the population below the poverty line in village D is 12408. then the population below the poverty line in village F is:
10340
10240
10440
10300
The correct Answer is:A
Step by step video, text & image solution for Study the following pie chart and table and answer the question given below. The given chart represents the percentage distribution of the population of six villages A, B, C, D, E and F in 2016. If the population below the poverty line in village D is 12408. then the population below the poverty line in village F is: by Maths experts to help you in doubts & scoring excellent marks in Class 14 exams.
Similar Questions
Study the pie chart given below and answer the question that follow
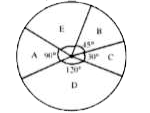
Which heads is allocated maximum funds?View SolutionStudy the following pie chart carefully and answer the questions. The pie chart represents the percentage of people involved in various occupations.
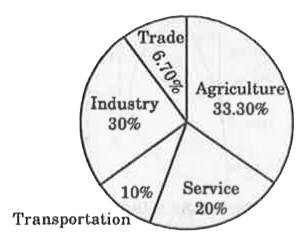
The angle made by the people involved in service in the given pie-chart isView Solution
Knowledge Check
- Question 1 - Select One
Study the following Pie-Chart carefully to answer the questions given below.
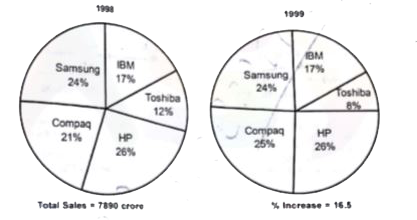
IBM's sales in 1998 is what percentage of the sales of Samsung in 1999 ?A0.4634B0.5234C0.57D0.608 - Question 2 - Select One
The following table shows the percentage distribution of the population of five states, A,B,C,D and E on the basis of the poverty line and also on the basis of sex.
निम्नलिखित तालिका गरीबी रेखा तथा लिंग के आधार पर पाँच राज्यों A,B,C, D तथा E की आबादी के प्रतिशत वितरण को दर्शाती है | If the population of males below the poverty line for State C is 3 million, then what is the total
population of State C?
यदि राज्य C में गरीबी रेखा से नीचे पुरुषों की आबादी 30 लाख है, तो राज्य C की कुल आबादी कितनी है ?A24.486 millionB23.361 millionC25.617 millionD26.316 million - Question 3 - Select One
Study the following Pie-Chart carefully to answer the questions given below.
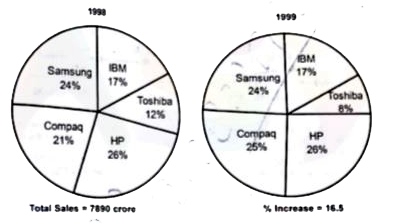
The percentage increase/decrease in the sales of Toshiba in 1999 is approximately-A0.16B0.61C0.22D0.68
The following pie chart shows proportion of population of seven villages in 2009. Study the pie chart and answer the questions that follow :
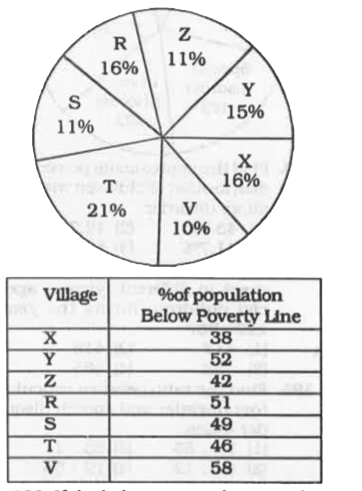
If the population of the village 'R' is 32000, then the below poverty line population of village 'Y' isView SolutionThe following pie chart shows proportion of population of seven villages in 2009. Study the pie chart and answer the questions that follow :
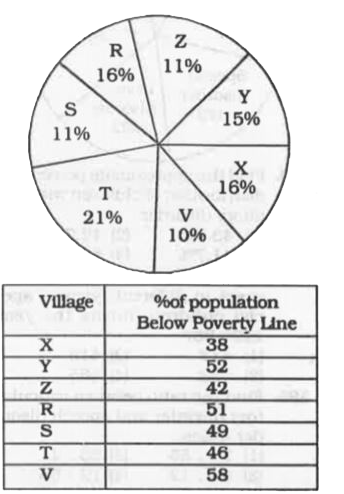
If the below poverty line population of the village 'X' is 12160, then the population of village 'S' isView SolutionWhat percentage of India population is below the official poverty line ?
View SolutionWhat percentage of India population is below the official poverty line ?
View SolutionStudy the following line chart carefully and answer the questions given below it. The following line chart represents the number of employees recrulted in different years in a company.
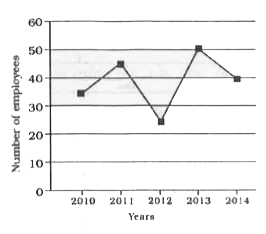
If the number of employees before 2010 was 640, what was percentage increase in 2010?View Solution
