Study the given pie chart and answer the question that follows. The pie chart shows the distribution (degree-wise) of the number of players who play five sports A, B, C, D and E (assuming each player plays only one sport)
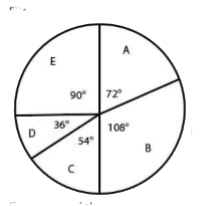
If the number of players who play sport C is 162, then the difference between the total number of players who play sport A and E is:
72
36
90
54
The correct Answer is:D
Step by step video, text & image solution for Study the given pie chart and answer the question that follows. The pie chart shows the distribution (degree-wise) of the number of players who play five sports A, B, C, D and E (assuming each player plays only one sport) If the number of players who play sport C is 162, then the difference between the total number of players who play sport A and E is: by Maths experts to help you in doubts & scoring excellent marks in Class 14 exams.
Updated on:21/07/2023Similar Questions
Study the pie-chart and answer the question.
Distribution (degree wise ) of the total number of employeesofa company in its five offices A,B,C,D&E.
Total Number of employees = 9200
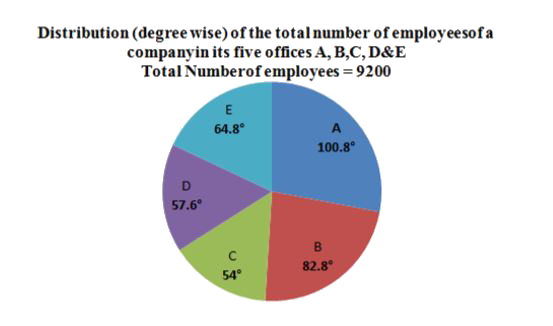
Total number of employees of the company in offices C and D exceeds the number of employees in office B by x, where X lies between:
View SolutionGiven below are two pie charts which show the percentage distribution of cricket players and football players in 6 sports club out of the total cricket and football players respectively in these six sports club.
Note : (I) If it is said but that number of players playing either football or circket then it means sum of players playing football and circket.
(2).Number of players plays both games
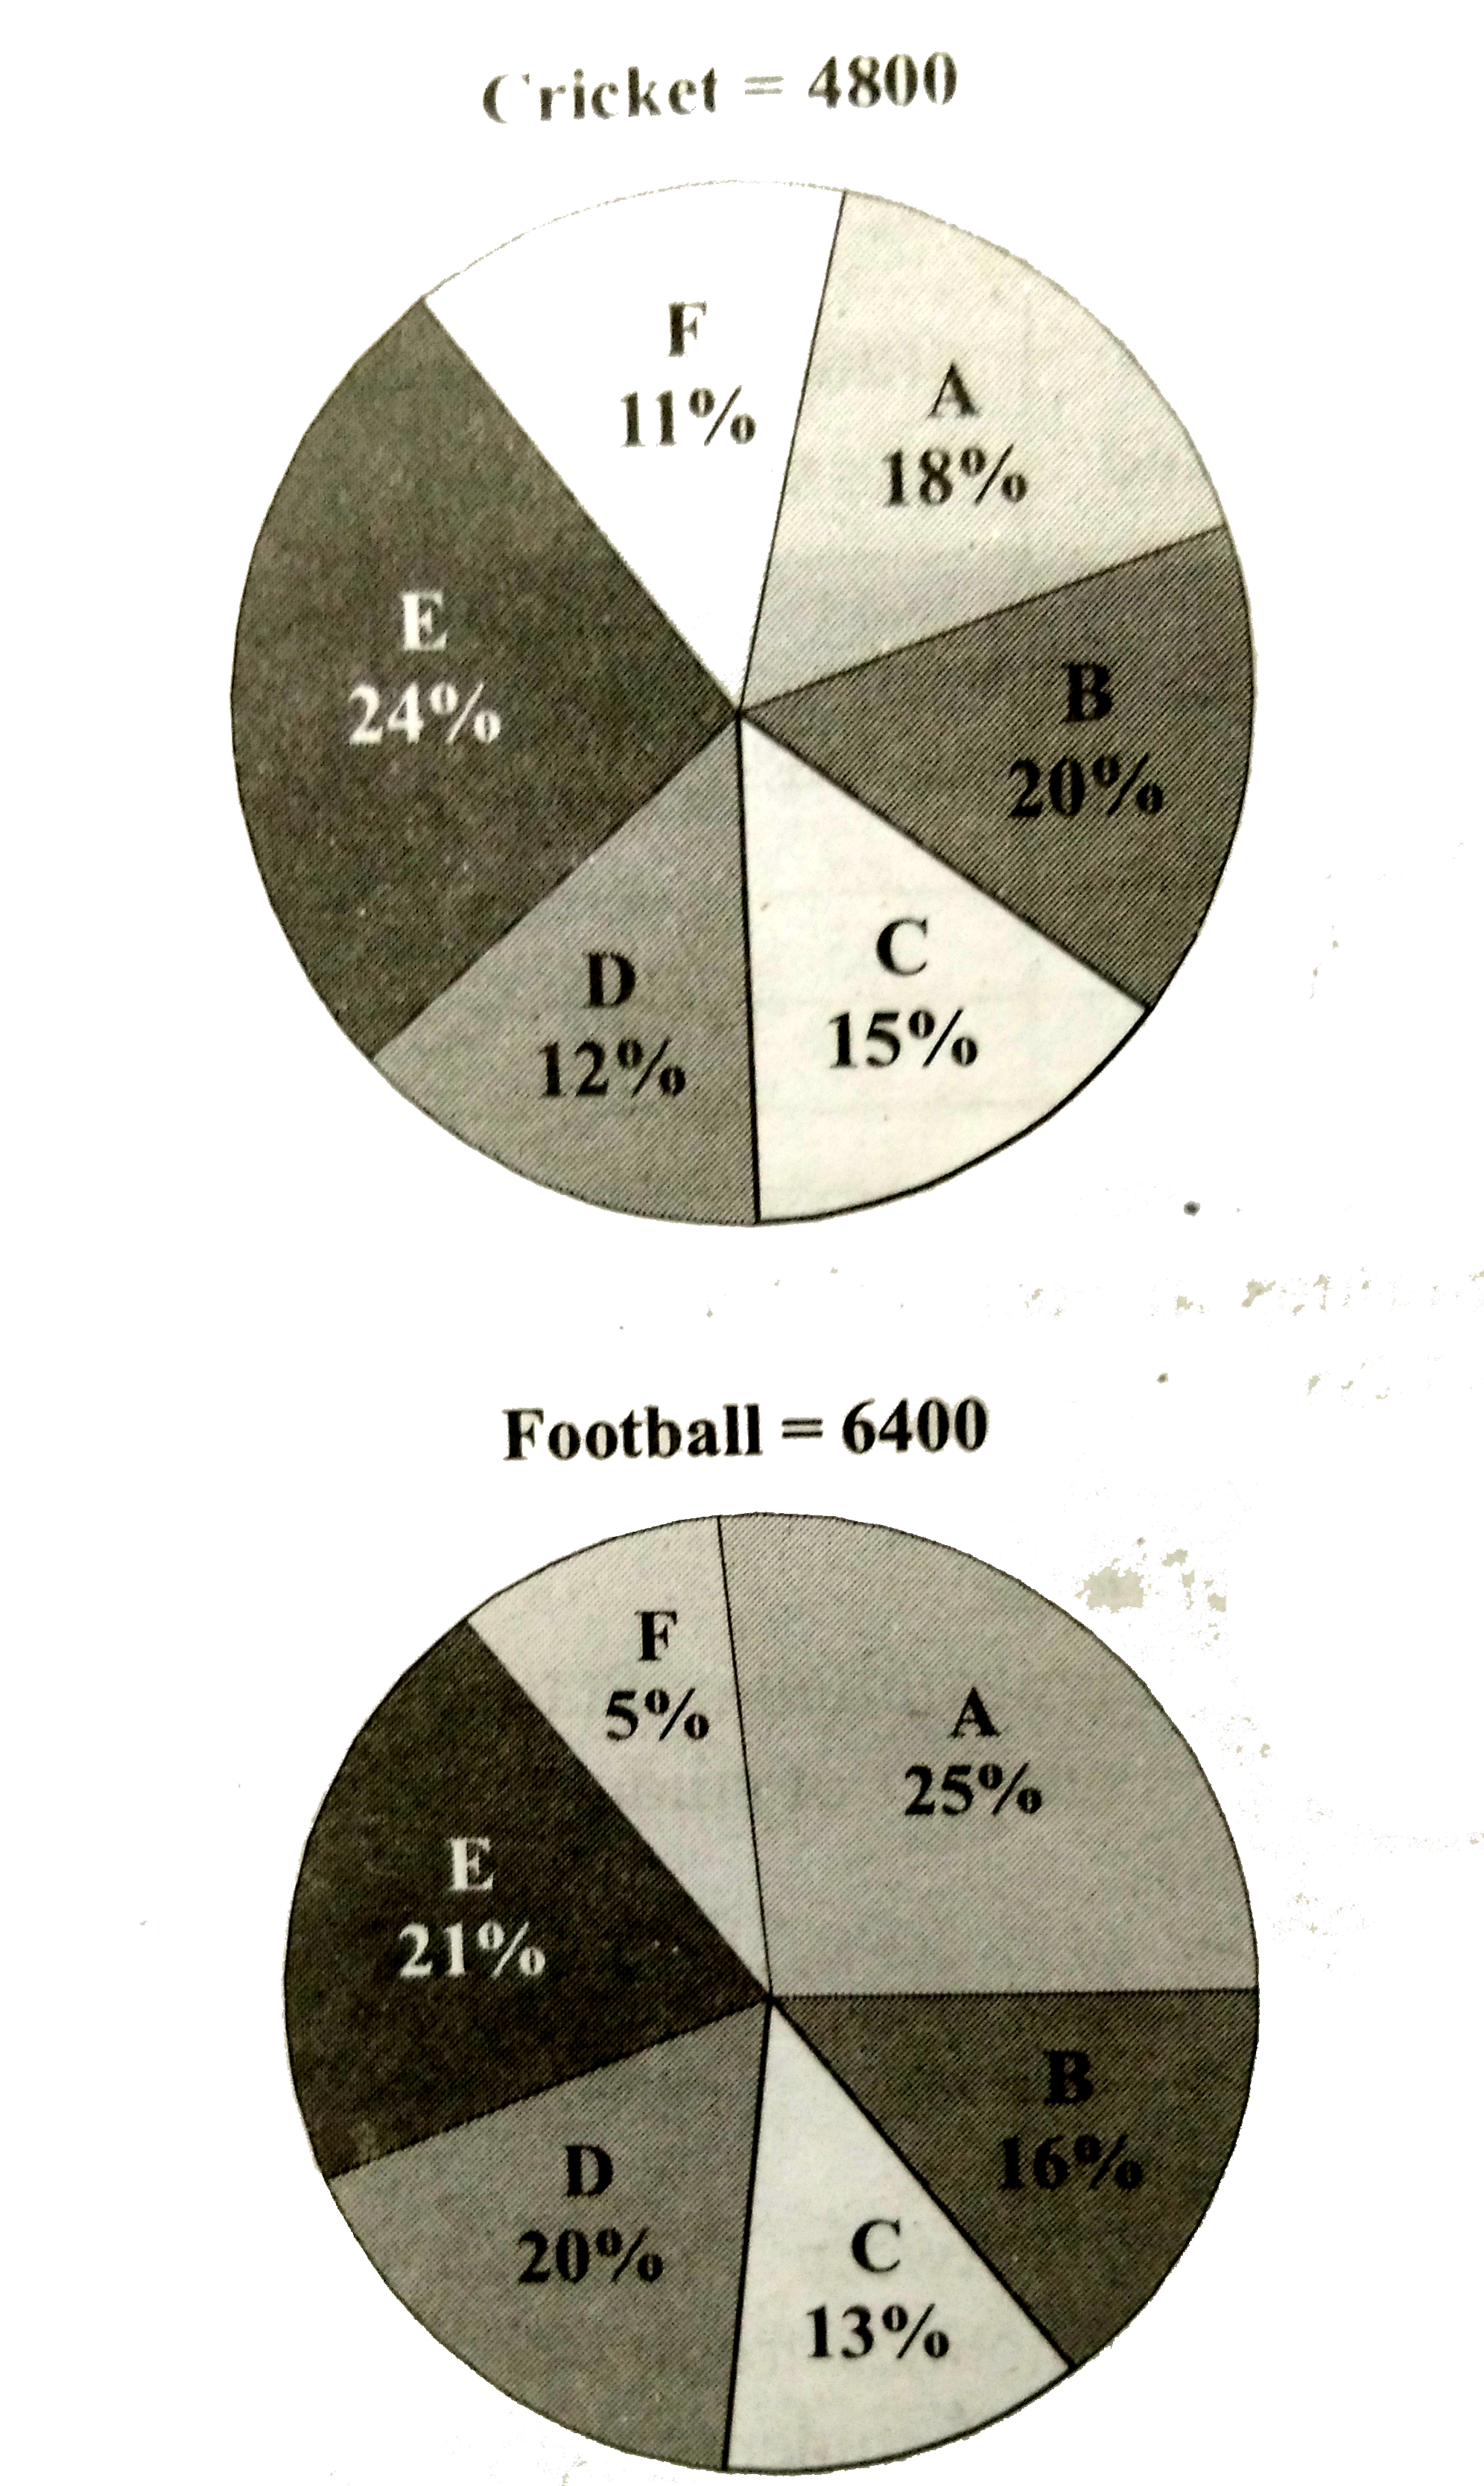
What is the difference between the total number of players playing either Football or Cricket from club D and those playing Football from club C and E together ?
View Solution
Knowledge Check
In a badminton each player played one game with ll the other players. Number of players participated in the tournament if they played 105 games is
A35B15C12D10Observe the following diagram and answer the question. Find the number of students who play any two of the three sports.
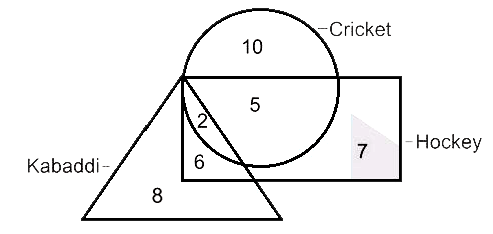 A9B15C11D13
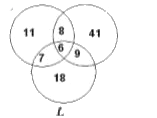
The above Venn diagram represent the students who play 3 sports M, N and L in a class. Total number of students who play game M is :A7B11C32D21
The pie chart given below shows the number of students who play five sports like Hockey, Tennis Cricket, Golf and Polo. The total number of students is 1080.
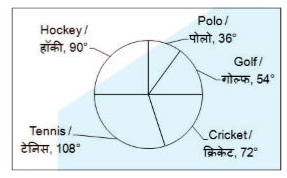
What is the difference between the number of students who play Tennis and those who play Polo?
View Solution66 games were played in a tournament where each player placed one against the rest. The number of players are
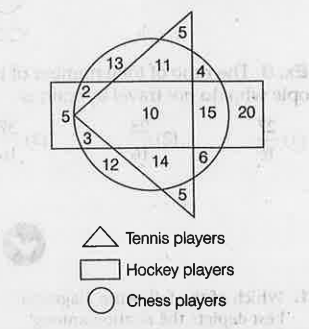
View SolutionStudy the following diagram and answer questions based on it.
The number of Non-Chess players is how much more than the players who play both Chess and Tennis?
View Solution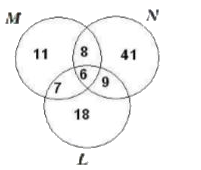
The above venn diagram represent the students who play 3 sport M,N and L in a class:
Total number of students who play game N is:
View SolutionComprehension:
Study the following diagram and answer questions based on it.
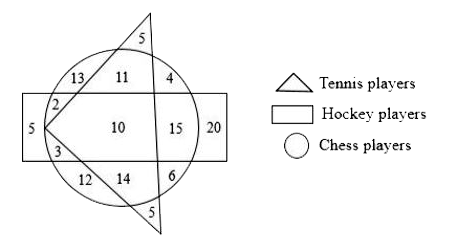
The number her of tennis players who are not hockey players is
View Solution
