माइकोराइजा दिखाता है
परजीविता
सहभोजिता
सहोपकारिता
इनमें से कोई नहीं
The correct Answer is:C
Step by step video, text & image solution for माइकोराइजा दिखाता है by Biology experts to help you in doubts & scoring excellent marks in Class 12 exams.
Topper's Solved these Questions
- BOOK - JHARKHAND BOARD PREVIOUS YEAR PAPERSCHAPTER - प्रश्न पत्र 2020EXERCISE - BOTANY (खण्ड-ब : अतिलघु उत्तरीय प्रश्न)3videos
प्रश्न पत्र 2020
- BOOK - JHARKHAND BOARD PREVIOUS YEAR PAPERSCHAPTER - प्रश्न पत्र 2020EXERCISE - BOTANY (खण्ड-स : लघु उत्तरीय प्रश्न)3videos
प्रश्न पत्र 2020
- BOOK - JHARKHAND BOARD PREVIOUS YEAR PAPERSCHAPTER - प्रश्न पत्र 2010EXERCISE - ZOOLOGY (GROUP-D)4videos
प्रश्न पत्र 2010
- BOOK - JHARKHAND BOARD PREVIOUS YEAR PAPERSCHAPTER - प्रश्न पत्र 2022EXERCISE - खण्ड -ग (दीर्घ उत्तरीय प्रश्न)5videos
प्रश्न पत्र 2022
Similar Questions
पारिस्थितिकी अनुक्रमण को परिभाषित करें।
05:05View Solutionनिम्नांकित चित्र में A, B एवं C का नामकरण करें :
 02:47View Solution
एकसंकर क्रॉस का प्रयोग करते हुए डॉमिनेन्स के नियम का उल्लेख करें ।
46:12View Solutionसमष्टि क्या है एवं इसके क्या गुण हैं ? समष्टि वृद्धि को प्रभावित करने वाले कारकों की चर्चा करें।
View Solutionमाना एक ऊर्ध्वाधर मीनार AB ऐसी है कि उसका सिरा A भूमि पर है। माना AB का मध्य-बिन्दु C है और भूमि पर स्थित बिन्दु P ऐसा है कि AP=2AB यदि ∠BPC=β है, तो tanβ बराबर है
View Solutionयदि cot x-tan x = 2 है, तो व्यापक हल है (यहाँ, n एक पूर्णांक है)
View Solutionरेखा क्या है ? रेखाखण्ड क्या है ? किरण क्या है ? आओं सीखें
01:15View Solution'दुविधा - हत साहस है, दिखता है पंथ नहीं' कथन में किस यथार्थ का चित्रण है ?
01:27View Solutionजहाँ अंधकार है वहीं प्रकाश है' यह किस पाठ से संकलित है?
01:21View Solutionनींद उचट जाती है किसकी रचना है?
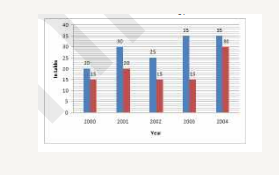
02:29View SolutionIn the given bar graph, the Blue bar shows the income and the Red bar shows the expenditure of a company. Study the graph and answer the question that follows
दिए गए दंड आरेख में, नीला दंड एक कंपनी की आय दिखाता है और लाल दंड खर्च (लाख रुपये में) को दर्शाता है। आरेख का अध्ययन करें और उस प्रश्न का उत्तर दें जो नीचे पूछा गया है। The income in 2001 was equal to the expenditure in the year:
2001 में आय किस वर्ष के व्यय के बराबर है :01:54View SolutionIn the given bar graph, the Blue bar shows the income and the Red bar shows the expenditure of a company. Study the graph and answer the question that follows
दिए गए दंड आरेख में, नीला दंड एक कंपनी की आय दिखाता है और लाल दंड खर्च (लाख रुपये में) को दर्शाता है। आरेख का अध्ययन करें और उस प्रश्न का उत्तर दें जो नीचे पूछा गया है। The expenditure from 2001 to 2002 decreased by:
2001 से 2002 तक व्यय में कितनी कमी आई है?01:46View SolutionIn the given bar graph, the Blue bar shows the income and the Red bar shows the expenditure of a company. Study the graph and answer the question that follows
दिए गए दंड आरेख में, नीला दंड एक कंपनी की आय दिखाता है और लाल दंड खर्च (लाख रुपये में) को दर्शाता है। आरेख का अध्ययन करें और उस प्रश्न का उत्तर दें जो नीचे पूछा गया है। The percentage decrease in the income of the company in 2002 as compared to that in 2001 is:
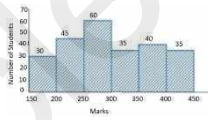
2001 की तुलना में 2002 में कंपनी की आय में कितने प्रतिशत में कमी आई है:View SolutionStudy the given histogram that shows the marks obtained by students in an examination and answer the question that follows:
दिए गए हिस्टोग्राम का अध्ययन करें जो एक परीक्षा में छात्रों द्वारा प्राप्त किए गए अंकों को दिखाता है और निम्न प्रश्न का उत्तर दे| The number of students who obtained less than 200 marks is:
200 से कम अंक प्राप्त करने वाले छात्रों की संख्या है:View SolutionSelect the venn diagram that best illustrates the relationship between the following classes. वेन आरेख का चयन करें जो निम्नलिखित वर्गों के बीच के संबंधों को सबसे अच्छा दिखाता है। Scooters, Vehicles, Auto-rickshaws स्कूटर, वाहन, ऑटो-रिक्शा
View SolutionSelect the Venn diagram that best illustrates the relationship between the following: Australia, Sydney, Amsterdam. वेन आरेख का चयन करें जो निम्नलिखित के बीच संबंधों को सबसे अच्छा दिखाता है: ऑस्ट्रेलिया, सिडनी, एम्स्टर्डम
View Solution
