Refer to following pie chart carefully and answer the given questions: Percentage wise Distribution of a total of 1800 animals sold by a pet shop in 6 years
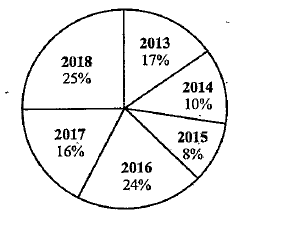
What is the central angle corresponding to the number of animals sold in the year 2016 ?
86.4∘
78.2∘
90∘
79.8∘
The correct Answer is:A
Step by step video, text & image solution for Refer to following pie chart carefully and answer the given questions: Percentage wise Distribution of a total of 1800 animals sold by a pet shop in 6 years What is the central angle corresponding to the number of animals sold in the year 2016 ? by Maths experts to help you in doubts & scoring excellent marks in Class 14 exams.
Updated on:21/07/2023Similar Questions
(Questions 5-9): Study the following pie-chart and table carefully and answer the questions given below: Percentage-wise Distribution of the Number of Mobile Phones Sold by a Shopkeeper During Six Months (FIGURE) What is the ratio of the number of mobile phones sold of Company B during July to those sold during December of the same company? (a) 119:145 (b) 116:135 (c) 119:135 (d) 119:130 (e) None of these
View Solution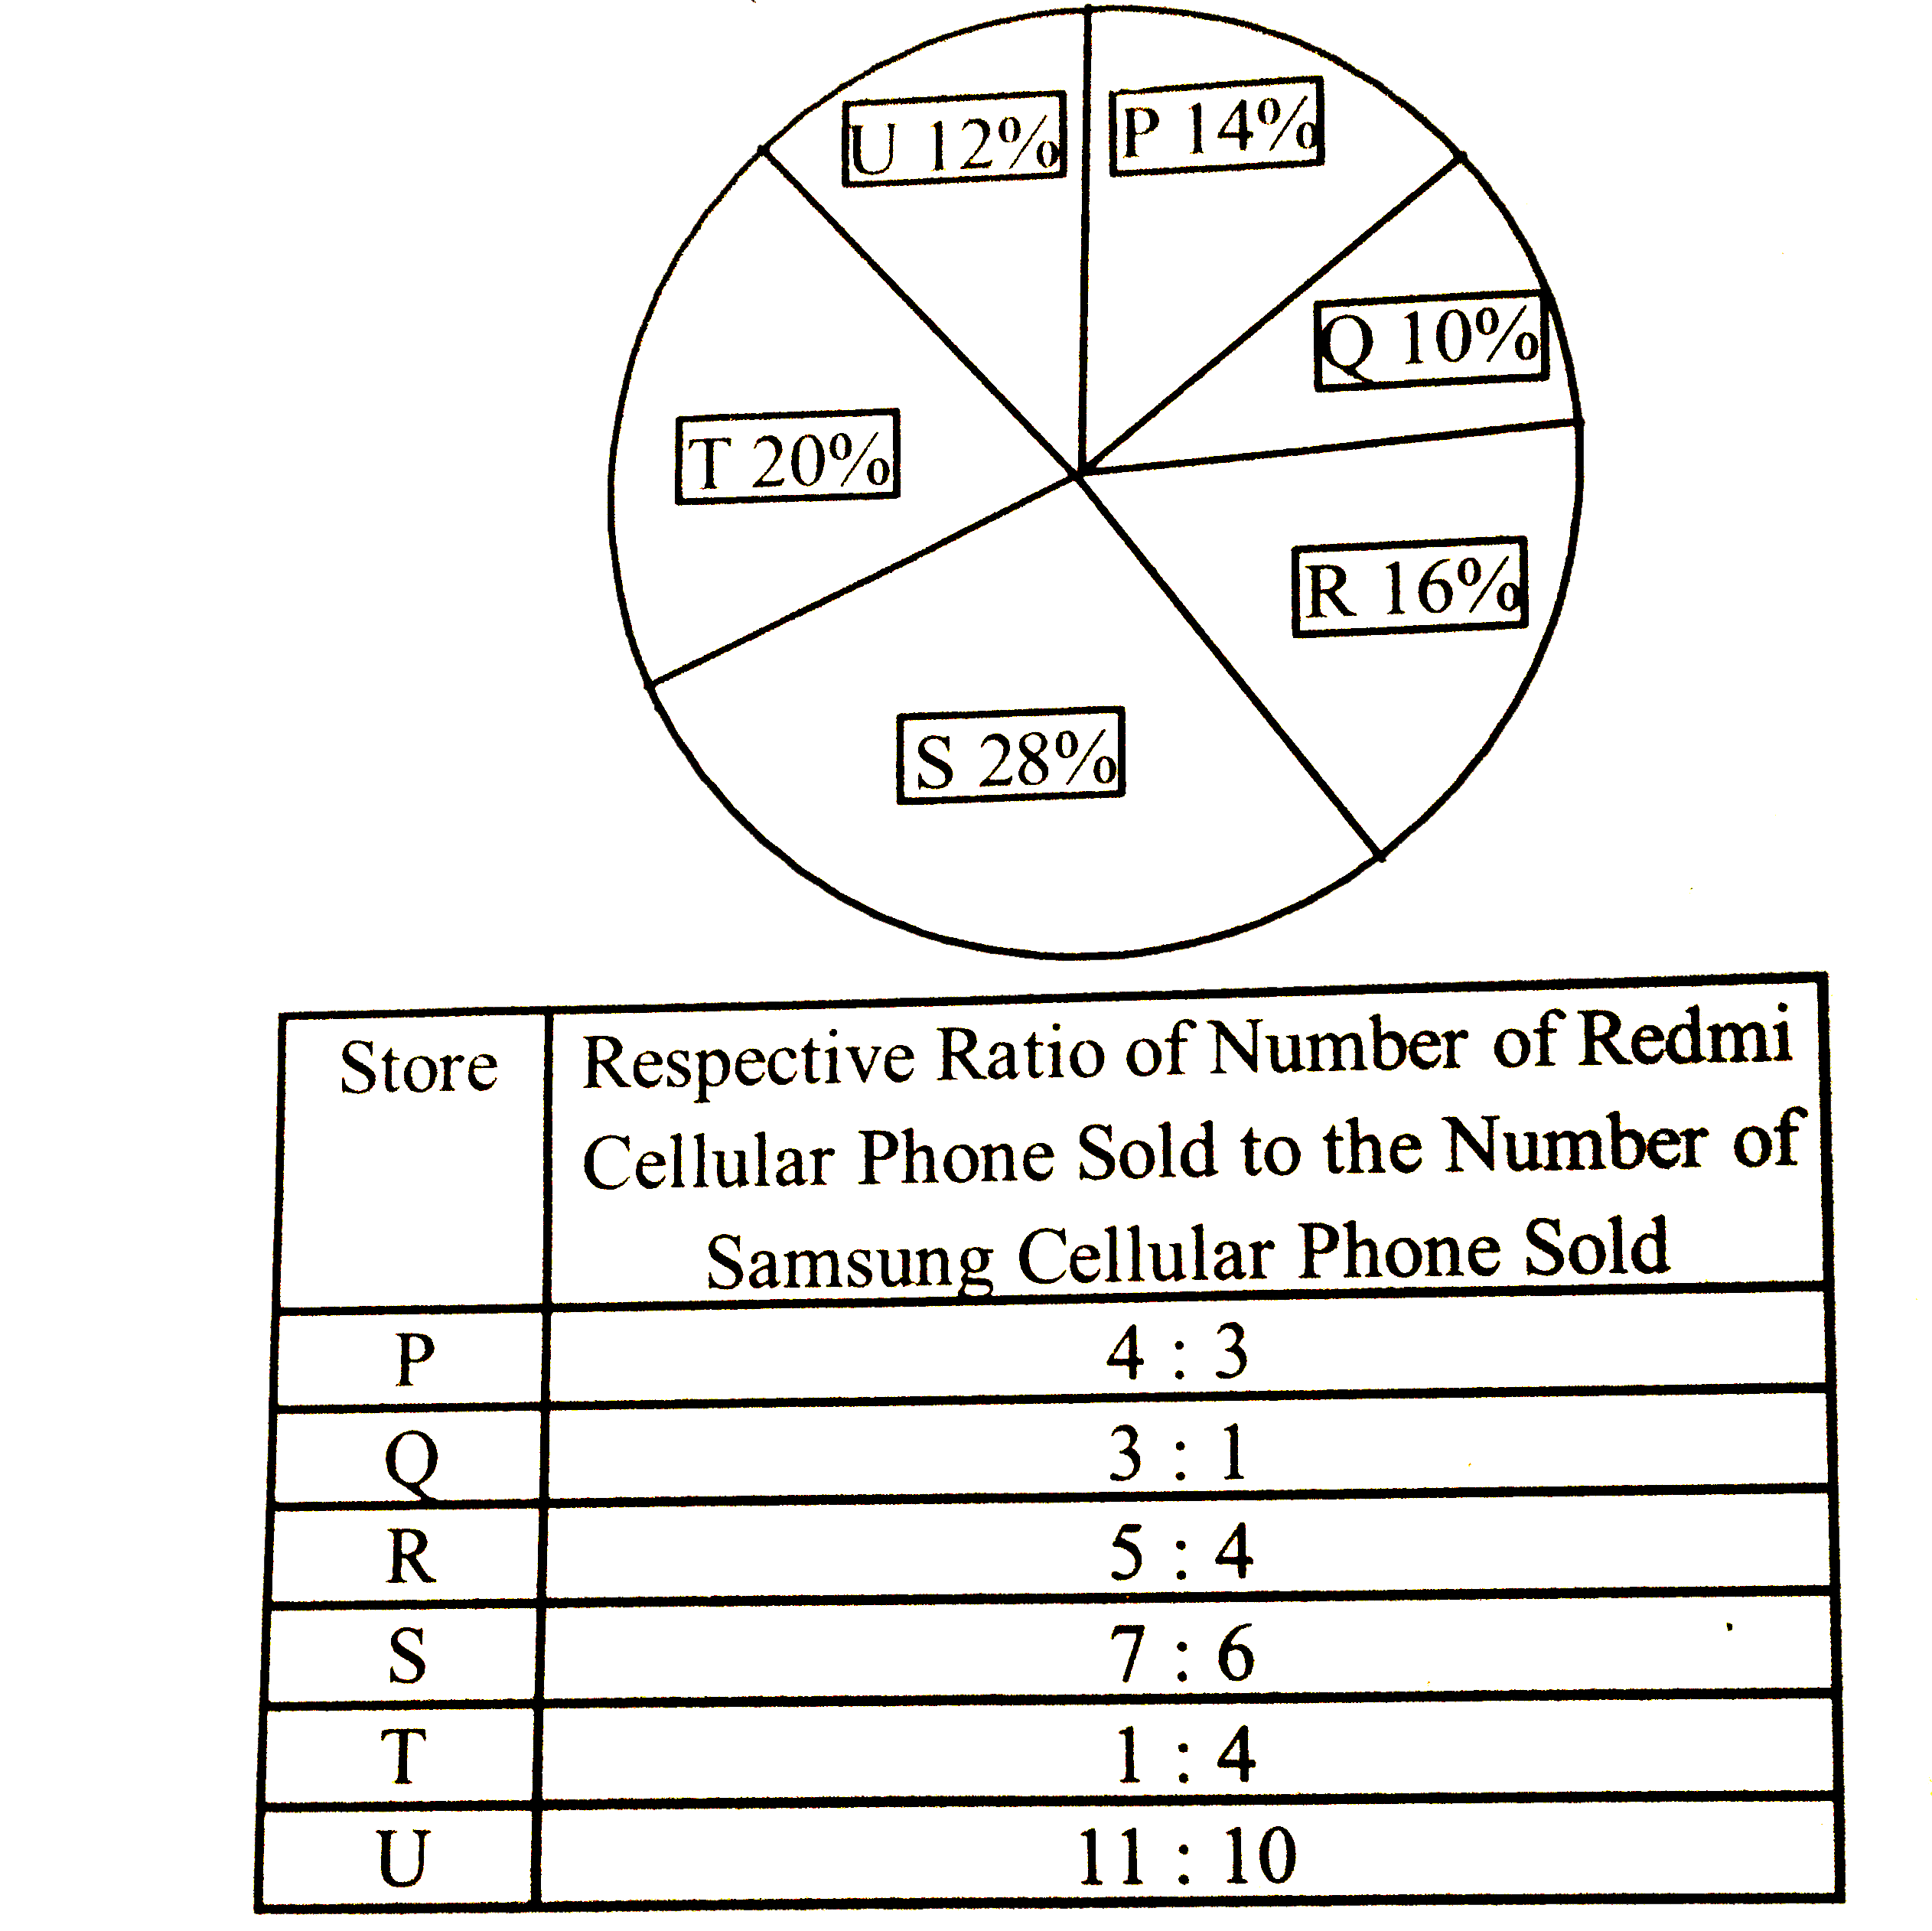
What is the central angle corresponding to total number of cellular phones (both Redmi and Samsung) sold by Store S ?
View Solution
Knowledge Check
Read the following pie-charts carefully to answer the questions.

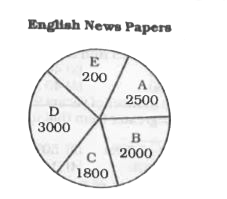
What is the central angle corresponding to the sale of Hindi newspapers in locality E?A80∘B90∘C60∘D108∘Read the following graph carefully and answer the questions given below.
Percentage of cars of 6 different models produced by a company in two years.
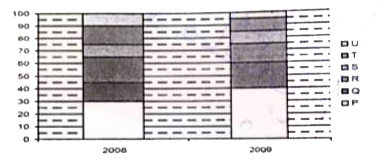
What is the total number of cars of P, Q and T models in year 2008 ?A2,85,000B2,18,000C2,70,000D2,50,000Study the following line chart carefully and answer the questions given below it. The following line chart represents the number of employees recrulted in different years in a company.
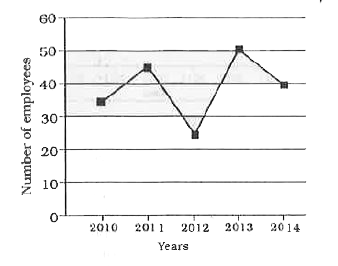
What was the ratio of number of employees recruited in the year 2011 to that in the year 2013?A2:3B9:10C10:9D5:9
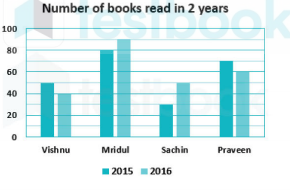
Directions: Read the bar graph carefully and answer the given questions.What is the average of total number of books read by all of them in the year 2016?
View SolutionDirection: Study the following information carefully and answer the given questions: The following pie chart shows the percentage distribution of total number of Apples (Wet +dry)
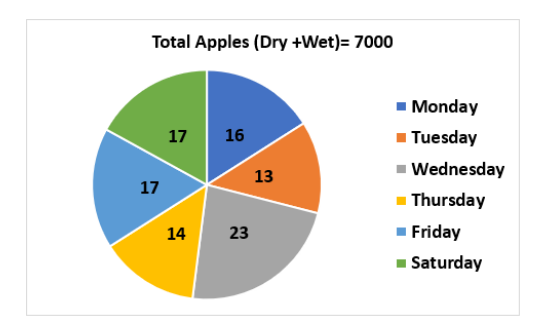
The pie chart2 shows the percentage distribution of total number of Apples (Wet) sold in different days of a week.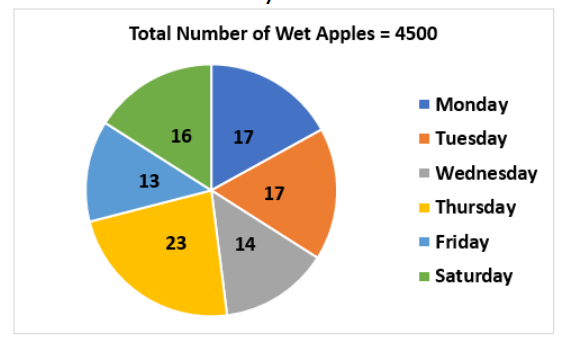
If the Apples (dry) sold on Sunday is 60 % more than the Apples (dry) sold on Saturday. Find the total Apples (dry) sold on Sunday and Saturday together?
View SolutionDirection: Study the following information carefully and answer the given questions: The following pie chart shows the percentage distribution of total number of Apples (Dry +dry)

The pie chart2 shows the percentage distribution of total number of Apples (Wet) sold in different days of a week.
What is the ratio of dry apples sold on Monday to that sold on Saturday?
View SolutionDirection: Study the following information carefully and answer the given questions: The following pie chart shows the percentage distribution of total number of Apples (Dry +dry)

The pie chart2 shows the percentage distribution of total number of Apples (Wet) sold in different days of a week.
Find the difference the Apples (Wet) sold on Tuesday to the apples (Wet + Dry) sold on Thursday?
View SolutionDirection: Study the following information carefully and answer the given questions: The following pie chart shows the percentage distribution of total number of Apples (Dry +dry)

The pie chart2 shows the percentage distribution of total number of Apples (Wet) sold in different days of a week.
What percentage of dry apples sold on Monday and Tuesday together?
View Solution
