Refer to following pie chart carefully and answer the given questions: Percentage wise Distribution of a total of 1800 animals sold by a pet shop in 6 years

What is the difference between the number of animals sold in the years 2013 and 2016 together and that in the years 2015 and 2017 together?
302
296
288
306
The correct Answer is:D
Step by step video, text & image solution for Refer to following pie chart carefully and answer the given questions: Percentage wise Distribution of a total of 1800 animals sold by a pet shop in 6 years What is the difference between the number of animals sold in the years 2013 and 2016 together and that in the years 2015 and 2017 together? by Maths experts to help you in doubts & scoring excellent marks in Class 14 exams.
Similar Questions
Read the following graph carefully and answer the questions given below.
Percentage of cars of 6 different models produced by a company in two years.
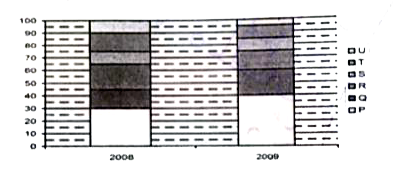
What is the difference between number of T model cars in year 2008 and 2009 ?View SolutionDirections: Refer to the following graph and answer the given questions. Data related to the number of shoes sold by two stores (A and B )during five years:
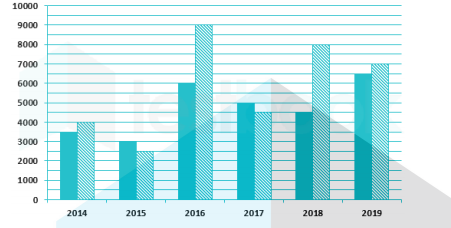
What is the difference between the total number of shoes sold by store A in 2018 and 2019 together and the total number of shoes sold by store B in 2014 and 2015 together?View Solution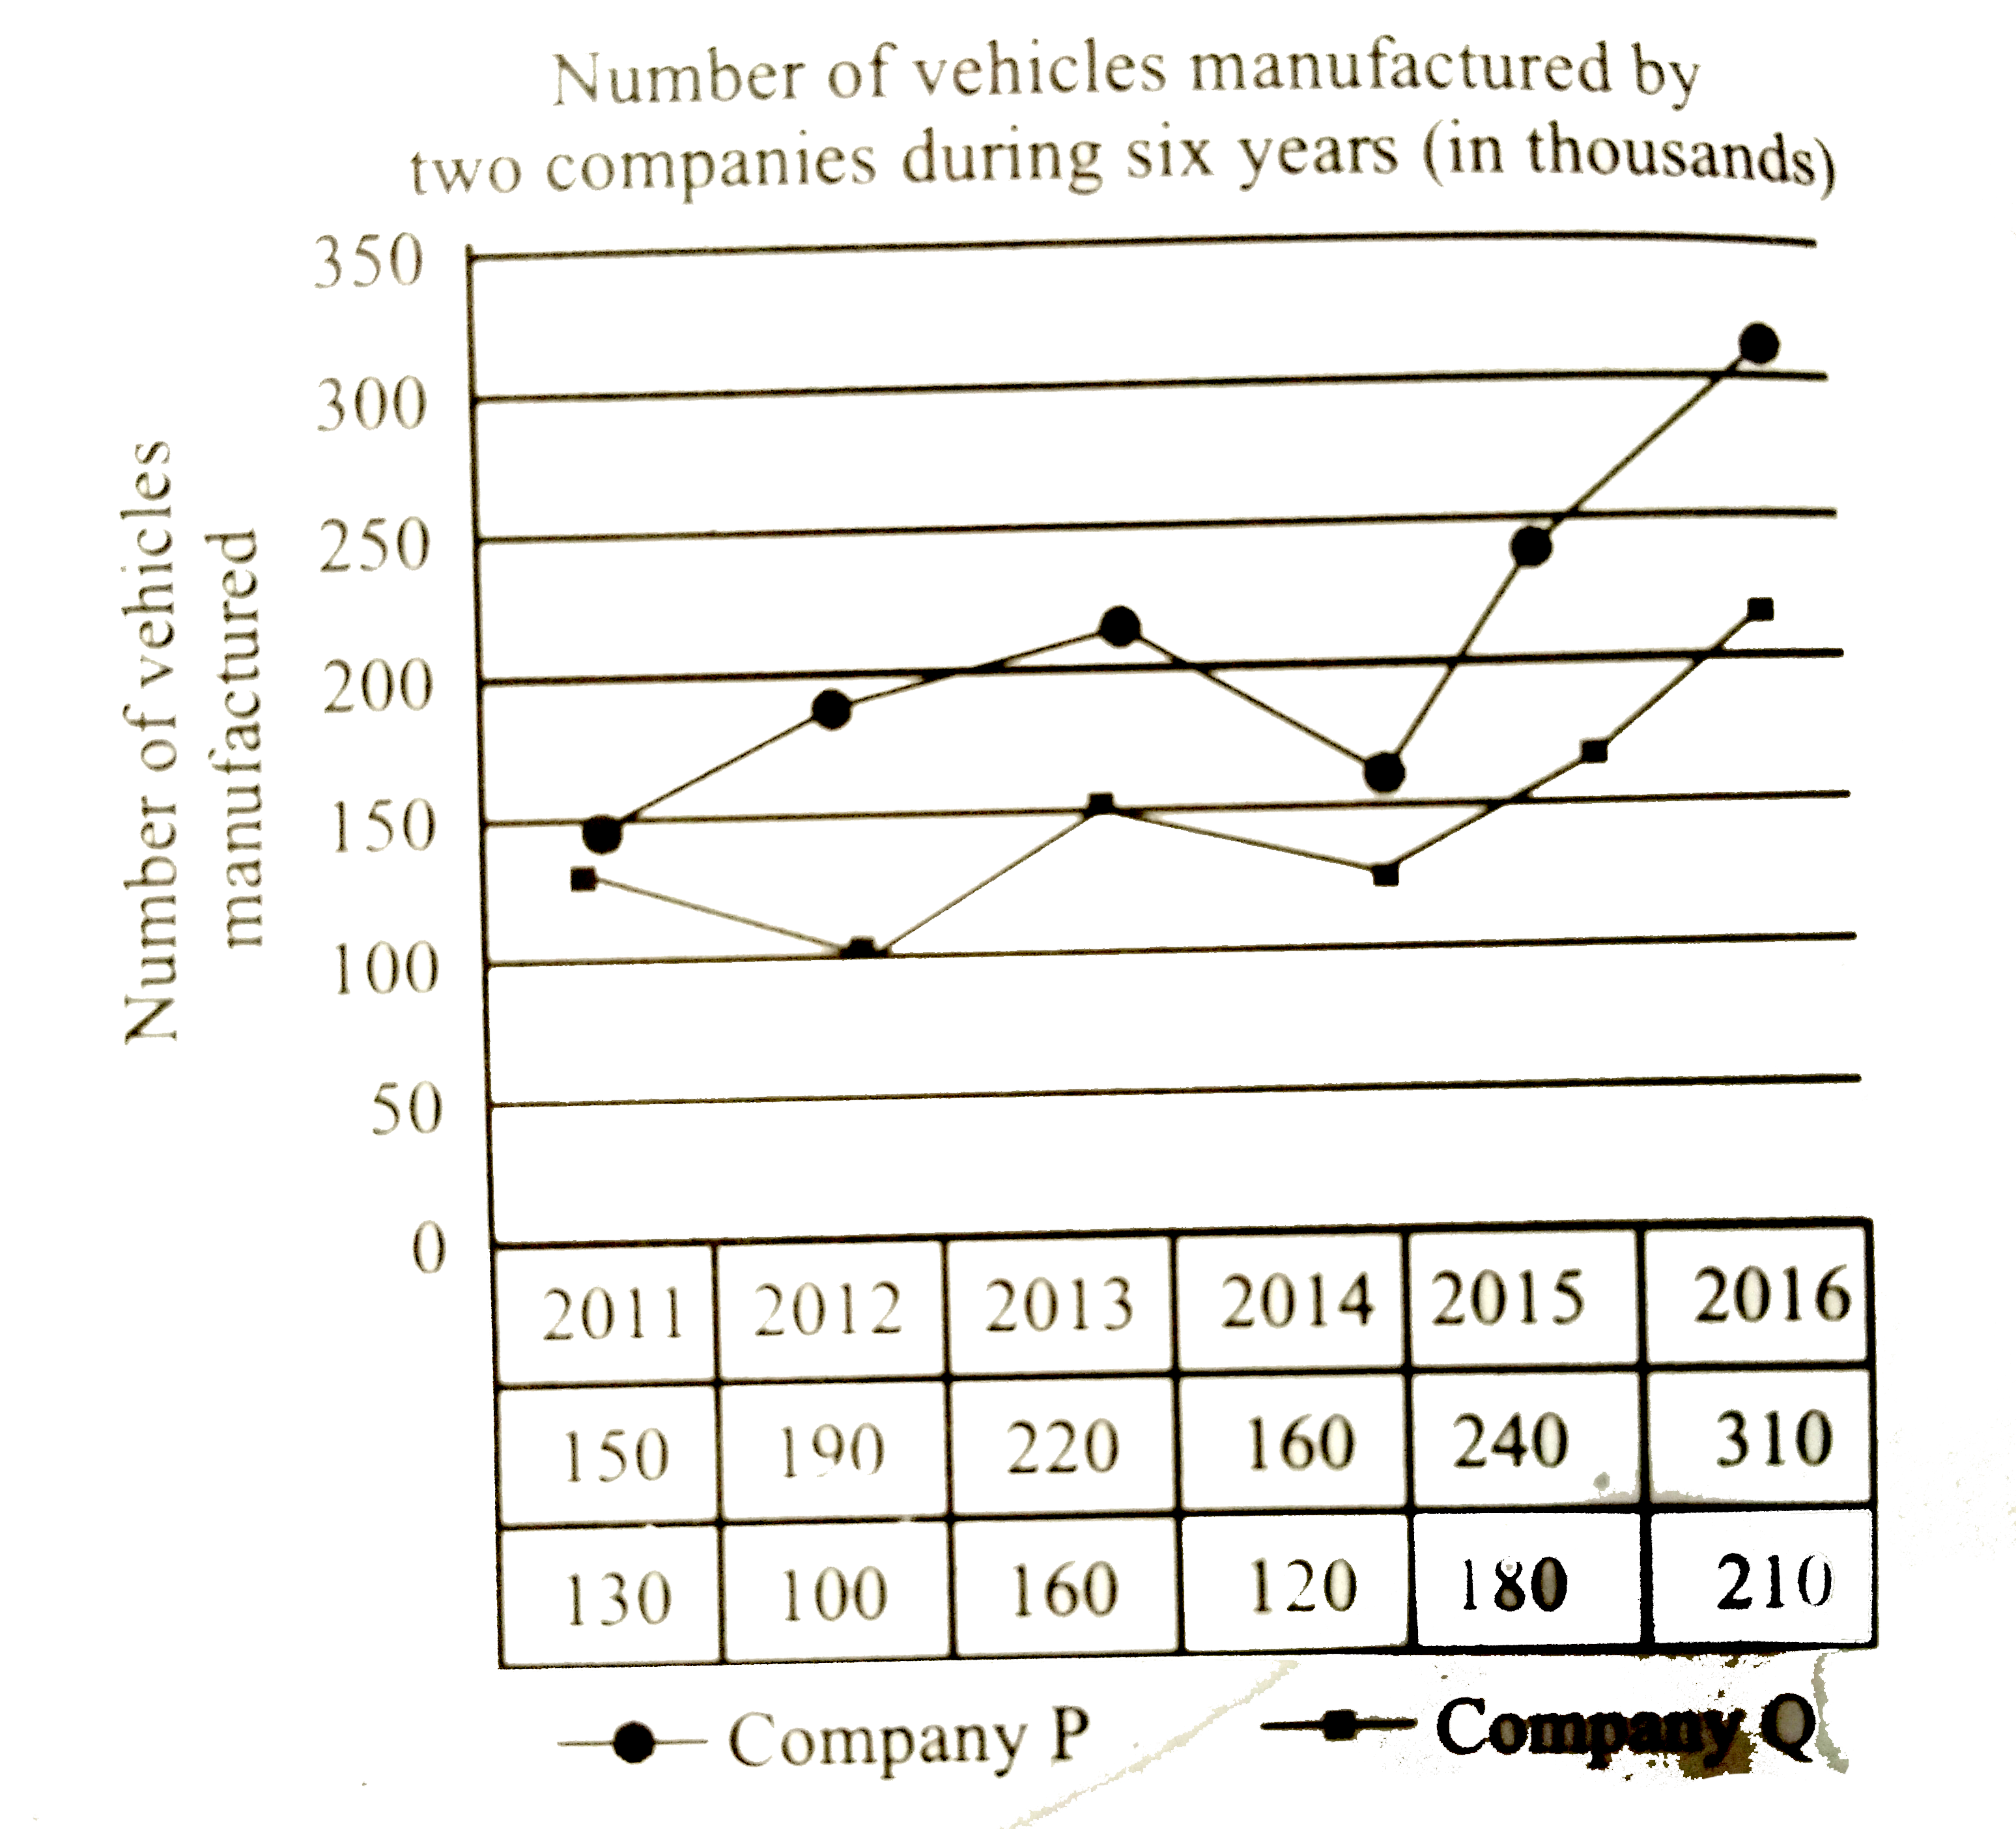
What is the difference between total number of vehicles manufactured by company P in 2013,2014 and 2016 together and company Q in 2014,2015 and 2016 together ? (In thousands)View SolutionDirections: Refer to the following graph and answer the given questions. Data related to the number of shoes sold by two stores (A and B )during five years:
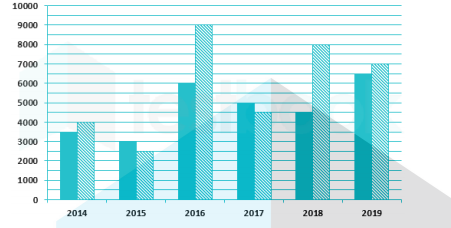
Find the difference between the total number of Shoes sold by Store A and B in all the years together?View SolutionStudy the following graph carefully to answer the questions given below. Expenditure in lakhs) of three different Companies in Five Different Years
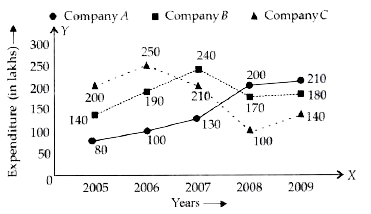
What was the difference between the total expenditure of Company B in the year 2006 and 2008 together and the total expenditure of Company C in the year 2007 and 2009 together?View SolutionStudy the following line chart carefully and answer the questions given below it. The following line chart represents the number of employees recrulted in different years in a company.
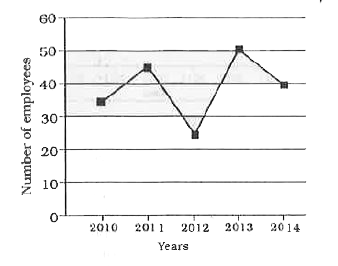
What was the ratio of number of employees recruited in the year 2011 to that in the year 2013?View SolutionRead the following graph carefully and answer the questions given below.
Percentage of cars of 6 different models produced by a company in two years.
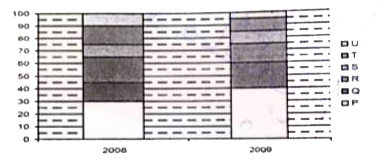
What is the total number of cars of P, Q and T models in year 2008 ?View SolutionDirections: Refer to the following graph and answer the given questions. Data related to the number of shoes sold by two stores (A and B )during five years:
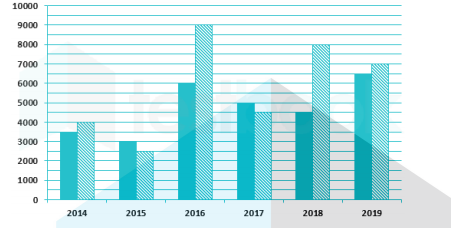
Find the ratio between the total number of shoes sold by stores A and B together in 2016 to the total number of shoes sold by stores A and B together in 2018?View SolutionStudy the following graph carefully and answer the questions that
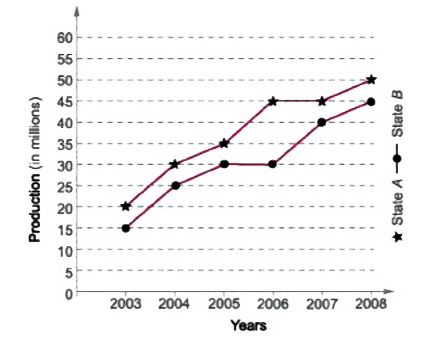
What was the ratio of the total population of State A to that of State B , for all the years together ?View SolutionRead the following table carefully and answer the questions given below. Number of Cars (In thousands) of different models and colours sold in two Metro Cities in a year

What is the difference between the number of blue-colour cars of model 'C' sold in Metro M and number of red-colour cars of model F sold in Metro H?View Solution
