Study the following information and answer the given questions.
The pie chart shows the percentage distribution of the total number of students (Boys + Gir is) enrolled for different activities in school A.

The following pie chart shows the percentage distribution of the total number of girls enrolled for different activities in school A.

Find the ratio of the total number of boy students enrolled for dancing and Swimming together to that of girl students enrolled for Drawing and Karate together
143:212
125:198
133:248
161:264
The correct Answer is:D
Step by step video, text & image solution for Study the following information and answer the given questions. The pie chart shows the percentage distribution of the total number of students (Boys + Gir is) enrolled for different activities in school A. The following pie chart shows the percentage distribution of the total number of girls enrolled for different activities in school A. Find the ratio of the total number of boy students enrolled for dancing and Swimming together to that of girl students enrolled for Drawing and Karate together by Maths experts to help you in doubts & scoring excellent marks in Class 14 exams.
Updated on:21/07/2023Similar Questions
Direction: Study the following information carefully and answer the given questions: The following pie chart shows the percentage distribution of total number of Apples (Dry +dry)
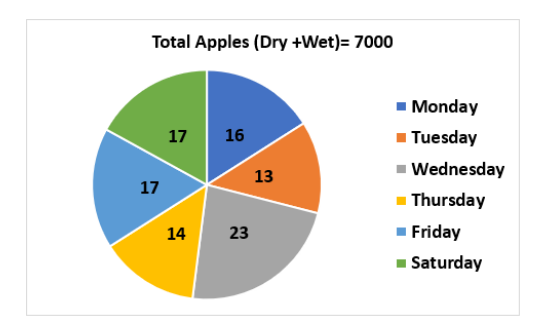
The pie chart2 shows the percentage distribution of total number of Apples (Wet) sold in different days of a week.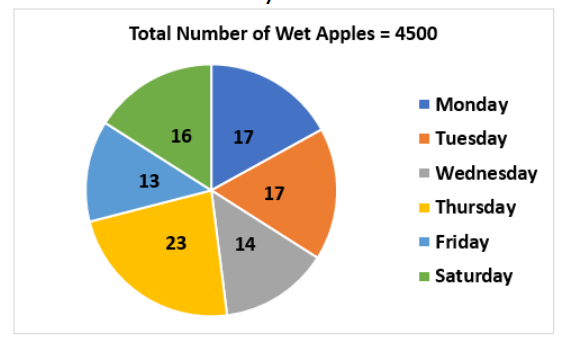
What is the ratio of dry apples sold on Monday to that sold on Saturday?
View SolutionDirection: Study the following information carefully and answer the given questions: The following pie chart shows the percentage distribution of total number of Apples (Dry +dry)

The pie chart2 shows the percentage distribution of total number of Apples (Wet) sold in different days of a week.
Find the difference the Apples (Wet) sold on Tuesday to the apples (Wet + Dry) sold on Thursday?
View Solution
Knowledge Check
The pie-chart shows the percentage-wise distribution of the number of students in five different schools P,Q,R,S and T .
The total number of students in all five schools together is 10,500 .
Study the pie -chart and answer the question .
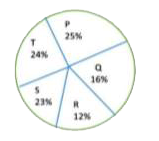
The number of students in school R is what per cent of the total number of students in schools Q and T together ?A40%B35%C25%D30%The following pie chart shows the hourly distribution of all the major activities of a student.
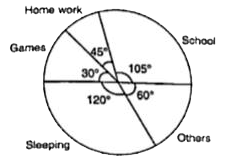
The percentage of time which he spends in school is :A38%B30%C40%D25%
Direction: Study the following information carefully and answer the given questions: The following pie chart shows the percentage distribution of total number of Apples (Dry +dry)

The pie chart2 shows the percentage distribution of total number of Apples (Wet) sold in different days of a week.
What percentage of dry apples sold on Monday and Tuesday together?
View SolutionStudy the following bar graph and answer the questions given below.
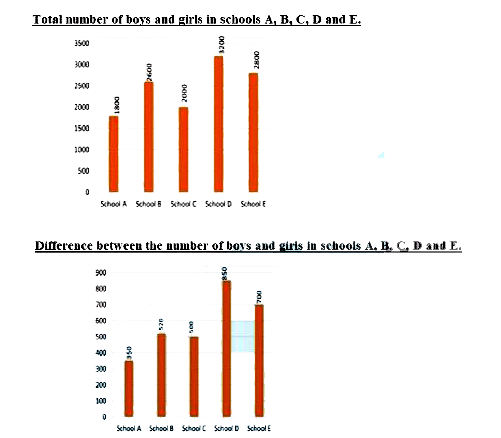
The number of boys in school B is what percentage of the total number of students in that school ?
View SolutionThe following pie chart 1 shows the percentage distribution of total number of tourists from China, Japan and Russia who went for different cities.
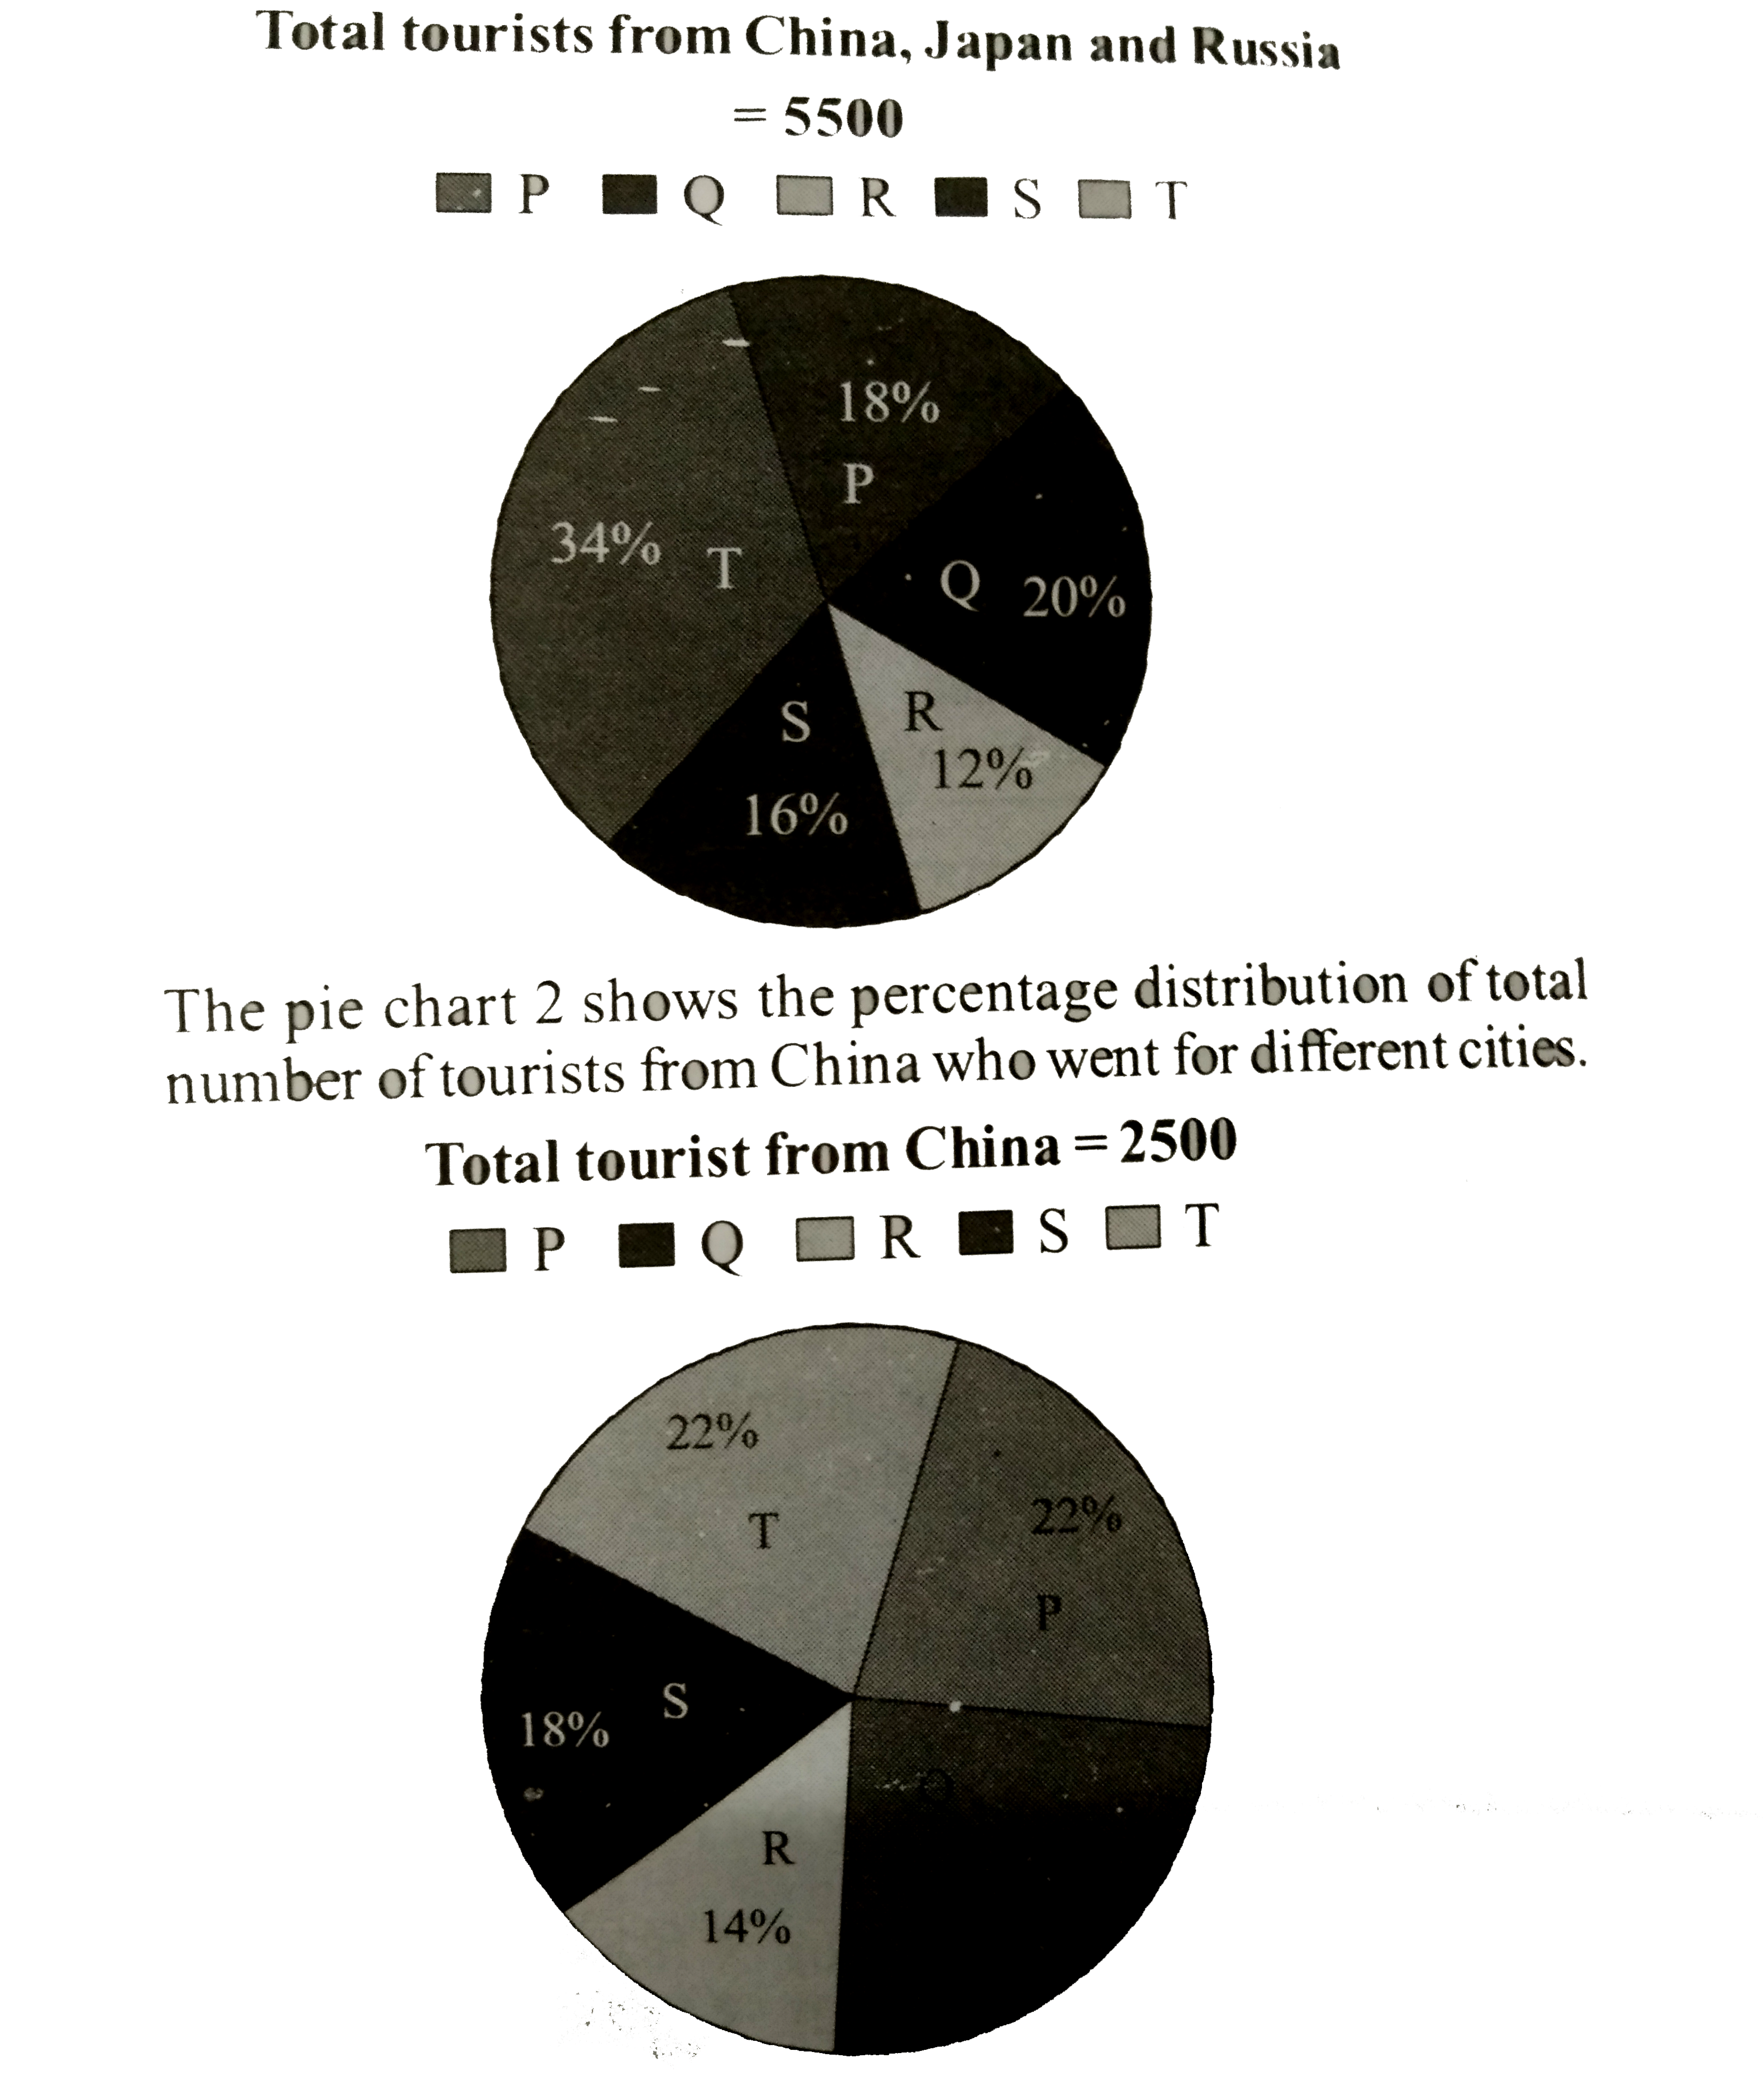
Find the ratio of total number of China tourists form city Q to that of total number of tourists from city S ?
View SolutionThe following pie-chart shows the percentage-wise distribution of the number of students in five different schools P, Q, R, S and T. The total number of students in all five schools together is 8400.
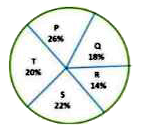
Find the average number of students in schools R and S together.
View SolutionDirection: Study the following information carefully and answer the given questions: The following pie chart shows the percentage distribution of total number of Apples (Wet +dry)

The pie chart2 shows the percentage distribution of total number of Apples (Wet) sold in different days of a week.
If the Apples (dry) sold on Sunday is 60 % more than the Apples (dry) sold on Saturday. Find the total Apples (dry) sold on Sunday and Saturday together?
View SolutionThe following pie chart 1 shows the percentage distribution of total number of tourists from China, Japan and Russia who went for different cities.
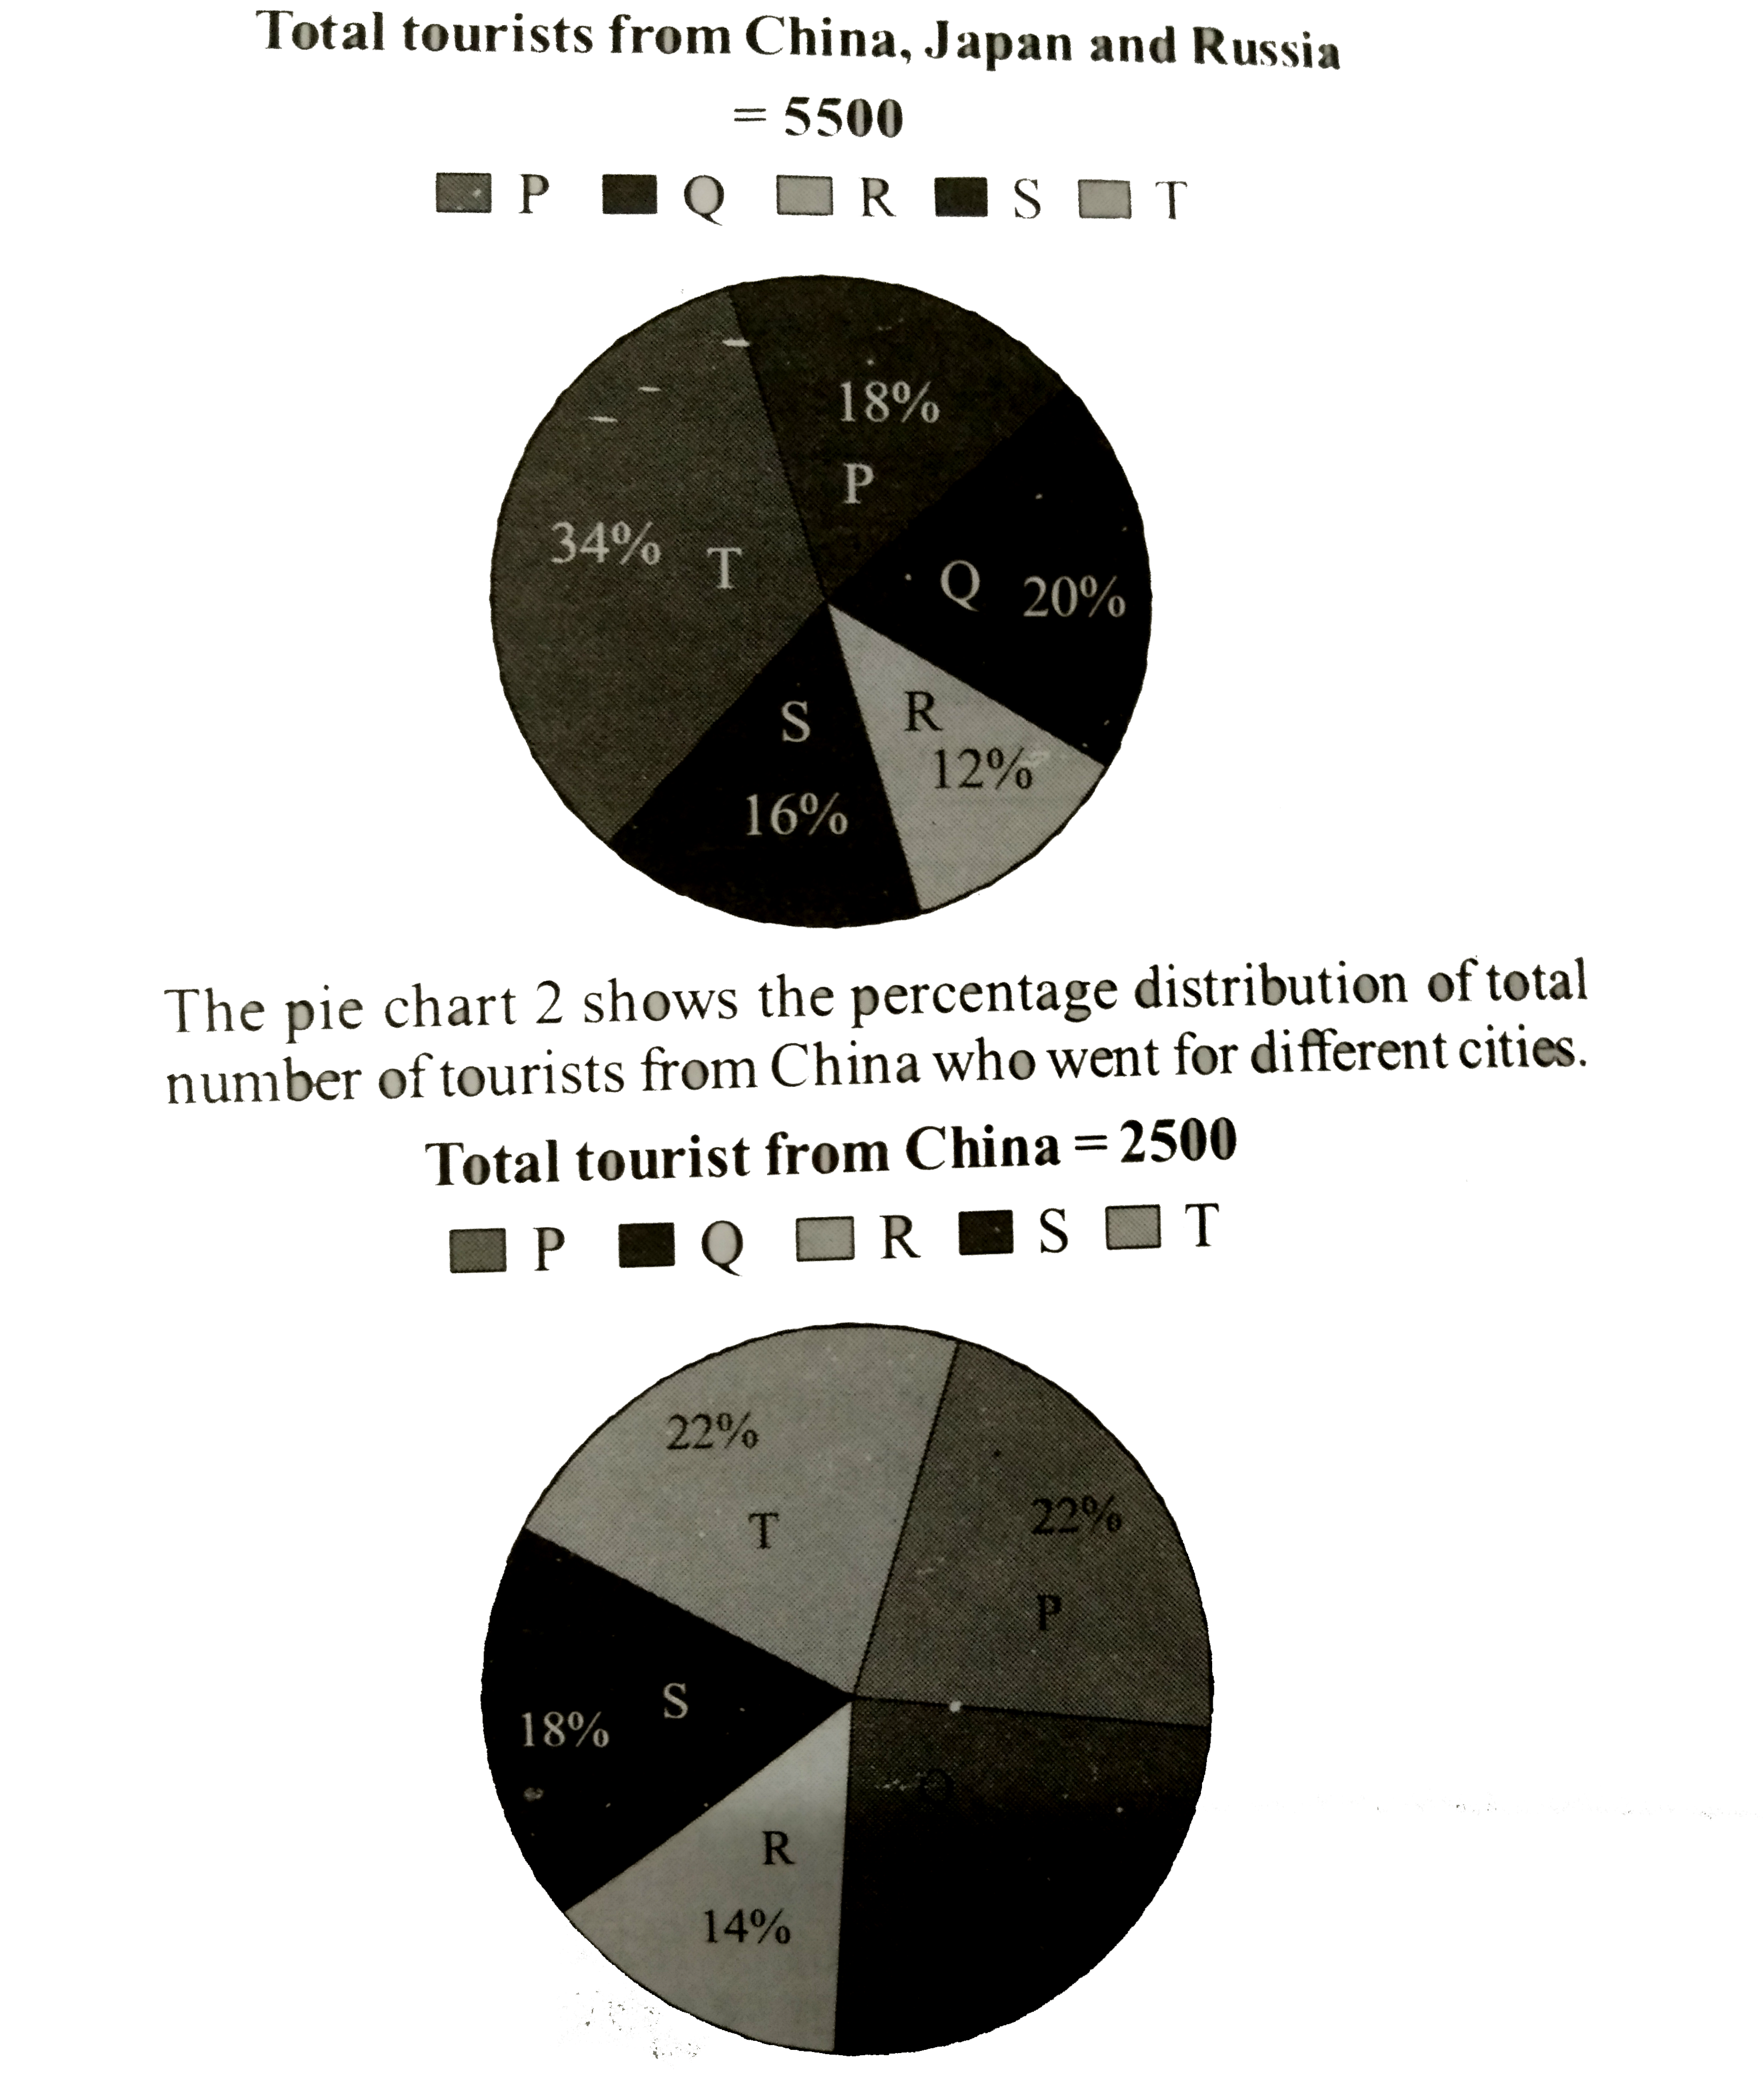
Find the difference between the total number of tourists from Japan and Russia in city. T with the total number of tourists from Japan and Russia in city S ?
View Solution
