Refer the graph and answer the given question
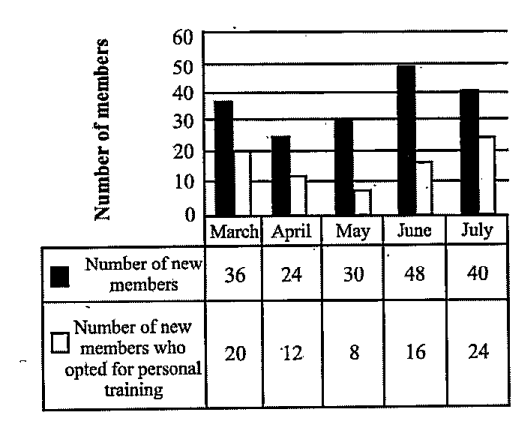
What is the respective ratio between the total number of new members who did not opt for personal training in March and April together and the number of new members who did not opt for personal training in June?
7 : 9
7 : 16
5 : 8
7 : 8
The correct Answer is:D
Step by step video, text & image solution for Refer the graph and answer the given question What is the respective ratio between the total number of new members who did not opt for personal training in March and April together and the number of new members who did not opt for personal training in June? by Maths experts to help you in doubts & scoring excellent marks in Class 14 exams.
Updated on:21/07/2023Similar Questions
Knowledge Check
Study the following graph and answer the questions given below :
No. of students (in thousands) who opted for three different specializations during the given five years in a University
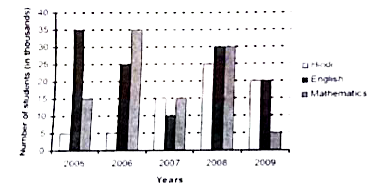
What is the respective ratio between the number of students who opted for English in the years 2006 and 2008 together and the number of students who opted for Hindi in the year 2005 and 2009 together ?A11:5B12:7C11:7D12:5The table below depicts the Number of Books Sold by 5 cities during 5 months . Study the following table and answer the question .
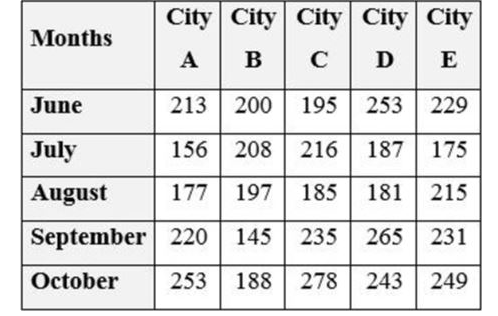
What is the respective ratio between the total number of books sold by City A in July and September together and total number of books sold by City E in August and October together ?
(a)57:49
(b)49:57
(c)58:47
(d)47:58A57:49B49:57C58:47D47:5852% students from a college participated in a survey. What is the respective ratio between the number of students who did not participate in the survey to the number of students who participated ?
A11:13B12:13C12:17DCannot be determined
The table below depicts the Number of books Sold by 5 cities during 5 months. Study the following table and answer the questions.
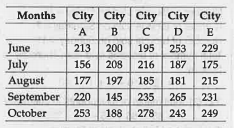
what is the respective ratio between the total number of books sold by City A in July and September together and total number of books sold by City E in August and October together ?
View SolutionRead the following graph carefully and answer the questions given below:
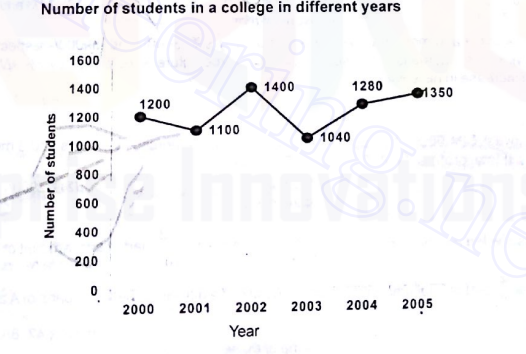
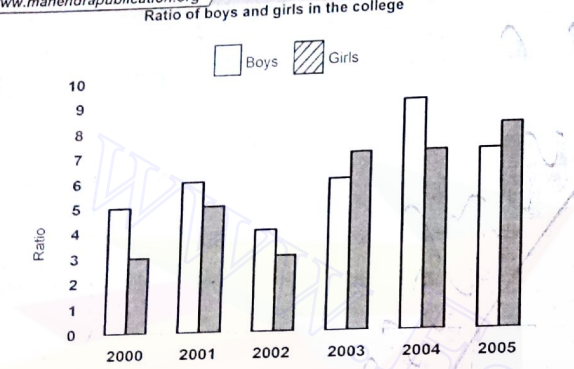
What is the respective ratio of number of boys in the year 2003 and that of girls in the year 2005 ?
View Solution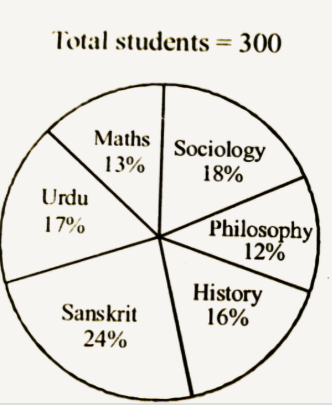
Find the ratio between total number of students who opted for Urdu, Histry and Sociogy together to total number of students who opted for Maths, Urdu and Sanskrit together ?
View SolutionStudy the following graph carefully to answer the questions that follow-----
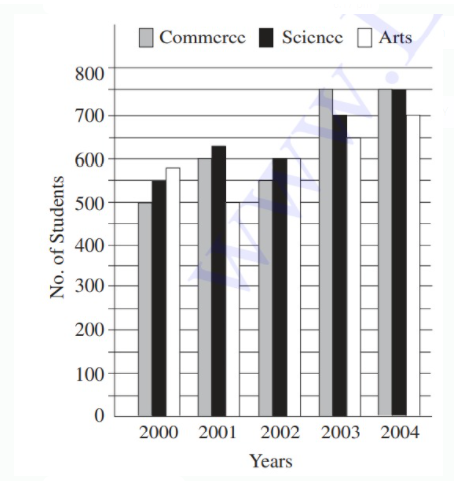
What is the respective ratio of total number of students studying Arts,Commerce and Science in all the years together ?
View SolutionStudy the following graph carefully and answer the questions that follow
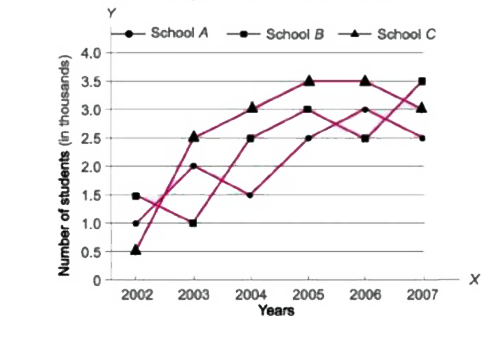
What was the difference between the total number of students in all schools together in the year 2003 and the number of students in school B in the year 2005 ?
View Solution

