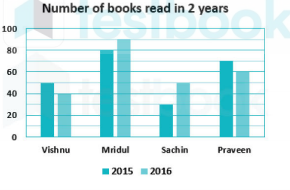
Refer the graph and answer the given question
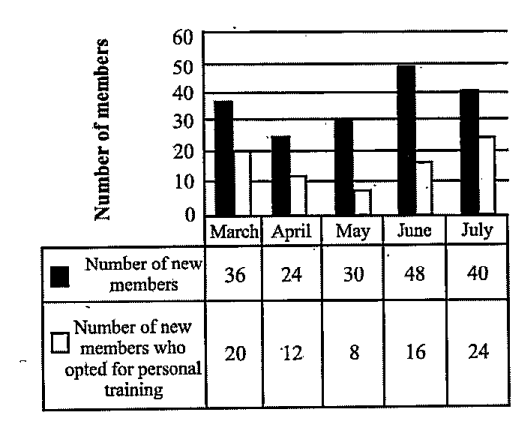
Out of the new members who joined in june what percent opted for personal training?
28(23)
33(13)
31(13)
29(23)
The correct Answer is:B
Step by step video, text & image solution for Refer the graph and answer the given question Out of the new members who joined in june what percent opted for personal training? by Maths experts to help you in doubts & scoring excellent marks in Class 14 exams.
Similar Questions
Knowledge Check
- Question 1 - Select One
Study the following graph carefully and answer the given questions.
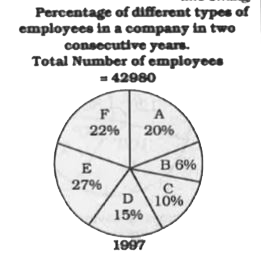
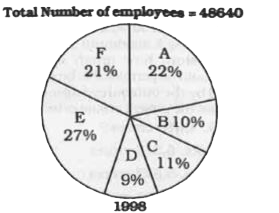
If the number of A type employees in 1998 was approximately what percent of the number of A type employees in 1997 ?A140B115C95D125 - Question 2 - Select One
Study the graph carefully and answer the questions below it -----
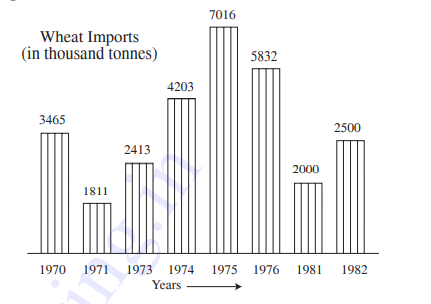
The increase in imports in 1982 was what percent of the imports in 1981 ?A25B5C125D80
Directions: Refer to the following graph and answer the given questions. Data related to the number of shoes sold by two stores (A and B )during five years:
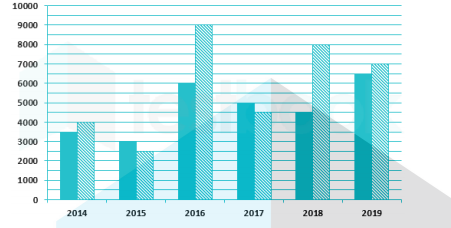
The number of shoes sold by store A decreased by what percent from 2017 to 2018?View SolutionDirection: Study the following information carefully and answer the given questions. The table shows the total number of invited person and the percentage of person who attended the events (A, B, C, D, E) respectively.
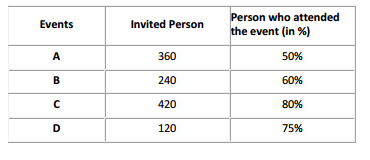
What is the ratio of the number of persons who attended event B to the number of persons who attended the event C?View SolutionRead the graph and answer the following questions
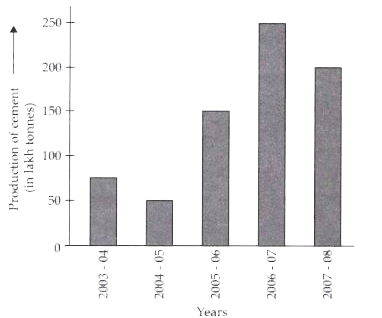
What information is conveyed by the bar graphView SolutionDirection: Study the following information carefully and answer the given questions. The table shows the total number of invited person and the percentage of person who attended the events (A, B, C, D, E) respectively.
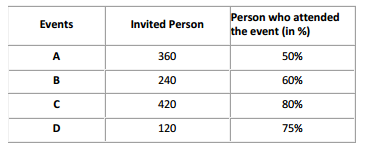
Find the percentage of persons who attended the event A is how much more than the number of persons who attended the event D.View SolutionThe following bar graph shows the number of students (in hundreds) who have opted for different courses A, B, C and D in 3 years in a college. Study the graph and answer the question.
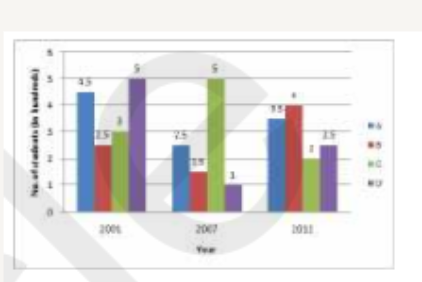 What is the ratio of the number of students who were admitted to course A in the year 2007 to that
of students who were admitted to course C in the year 2012? View Solution
What is the ratio of the number of students who were admitted to course A in the year 2007 to that
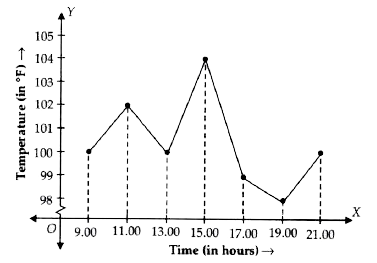
of students who were admitted to course C in the year 2012? View SolutionObserve the graph and answer the following questions.
The information given by the graph is:
 View Solution

