What is ratio of number of jute bags sold by shop B and total number of canvas and leather bags together sold by shop D
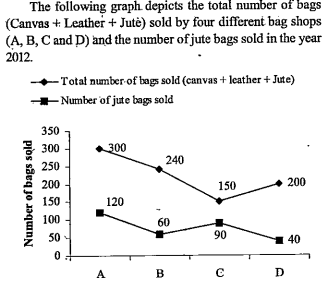
3:8
8:3
3:10
3:2
The correct Answer is:A
Step by step video, text & image solution for What is ratio of number of jute bags sold by shop B and total number of canvas and leather bags together sold by shop D by Maths experts to help you in doubts & scoring excellent marks in Class 14 exams.
Similar Questions
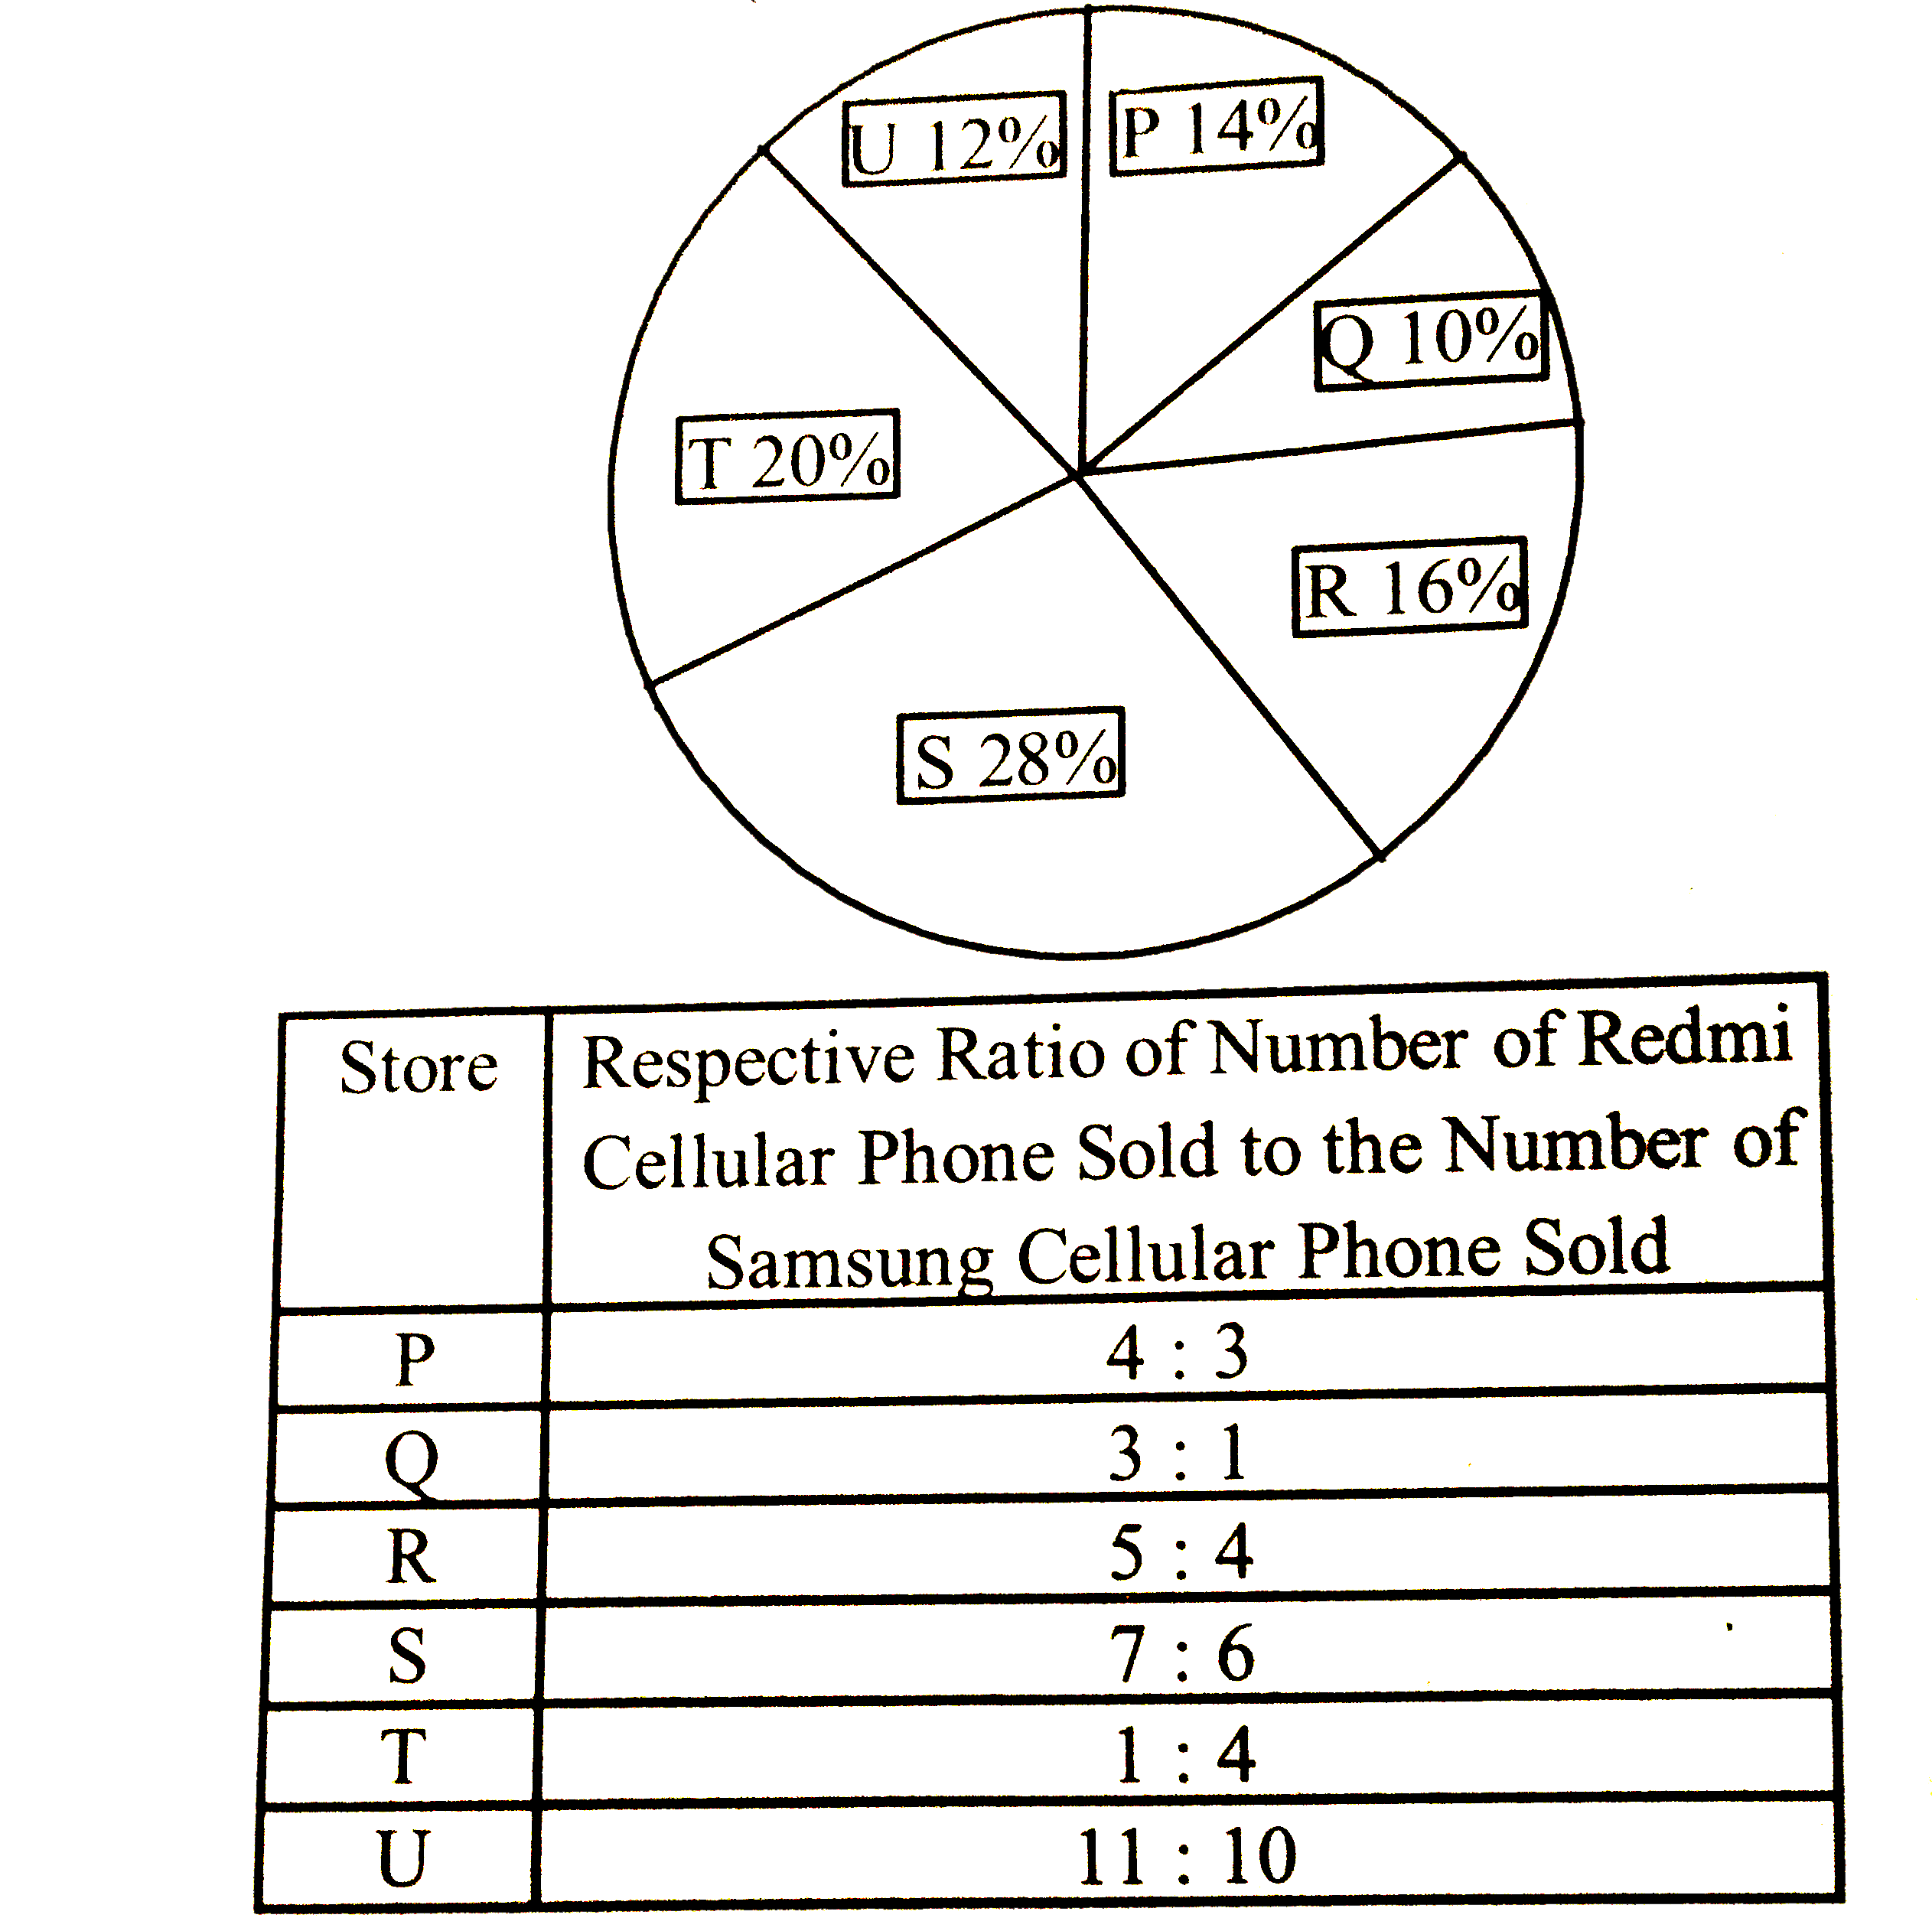
What is the respective ratio between number of Redmi cellular phones sold by stor S and total number of Samsung cellular phones sold by stores T and U together ?View SolutionDirection: The given bar graph shows the number of pens sold by two shops A & B in four consecutive months. Study the following data and answer the following questions:
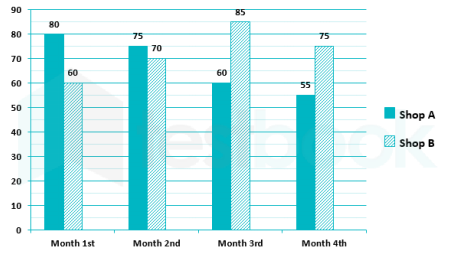
Find the ratio of the number of pens sold by shop A in months 1st and 3rd together to the number of pens sold by shop B in months 2nd and 4th together.View Solution
Knowledge Check
- Question 1 - Select One
The given table represents the sale (in thousands) of cars by four companies A,B,C and D in six years. Study the table and answer the questions that follow:
दी गयी तालिका चार कंपनियों - A, B, C और D के द्वारा छः वर्षों में की गयी कारों की बिक्री ( हज़ार में ) दर्शाती है | इस तालिका का अध्ययन करें तथा फिर पूछे गए प्रश्नों के उत्तर दें |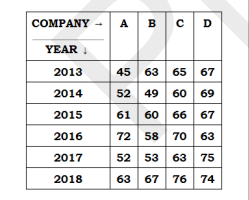 What is the ratio of total number of cars sold by companies A,B and D in 2017 to the total number
of cars sold by all companies in 2018?
कंपनी A, B और D के द्वारा 2017 में बेची गयी कारों की कुल संख्या तथा 2018 में सभी कंपनियों के द्वारा बेची गयी कारों की कुल संख्या के बीच क्या अनुपात है ?A3:4B6:13C9:14D18:23 - Question 2 - Select One
Study the given information carefully and answer the questions that follow.
The given below graph shows the percentage distribution of the number of cakes baked by 5 shops (A, B, C, D and E) on a given day. Total number of cakes baked by the 5 shops were 400.
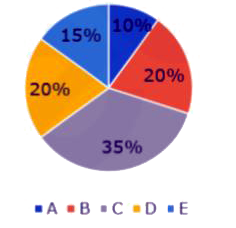
The given below table shows the percentage of cakes ordered from the five shops out of the baked cakes.
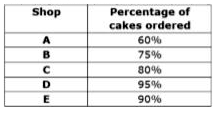
Note:
Number of cakes unsold = Number of cakes baked - Number of cakes ordered
All the ordered cakes are to be considered as cakes sold.
What is the ratio of the number of cakes baked by shop C and the number of cakes sold by shop B?A5:3B8:5C2:5D7:3 - Question 3 - Select One
The table shows the number of cars sold by three showrooms over a period of six year.
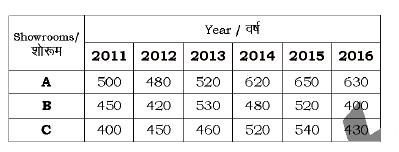
What is the ratio of the total cars sold by showrooms B during the years 2014 and 2016 and the total cars sold by showrooms C during 2015 and 2016?A86:97B88:97C85:97D88:95

What is the ratio of the number of clothes received by shops L and N together on Tuesday to that of by shops M and O together on Monday?View SolutionDirection: The given bar graph shows the number of pens sold by two shops A & B in four consecutive months. Study the following data and answer the following questions:
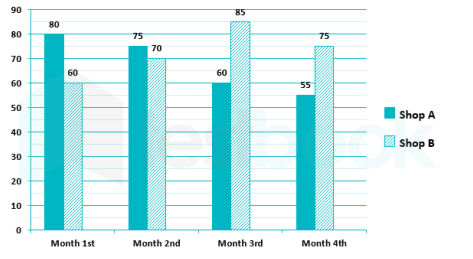
Find the average of the number of pens sold by shop A in 1st and 3rd months and the number of pens sold by shop B in 3rd and 4th month together.View SolutionDirection: The given bar graph shows the number of pens sold by two shops A & B in four consecutive months. Study the following data and answer the following questions:
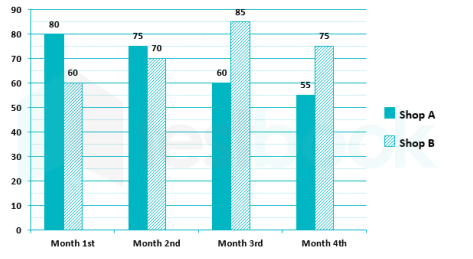
Find that the number of pens sold by shop A in 1st month is how much percent more than the number of pens sold by shop A in 3rd month.View SolutionThe given bar graph shows the sale of different brands of shirts in a shop in one month.
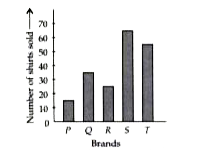
Find the ratio of number of shirts sold of brand S to the number of shirts sold or brand P and R together.
{ ((a),8:9),((b)13:8),((c )11:7),((d)13:6): }View SolutionThe given table represents the number of computers sold by four dealers A,B, C and D during the first six months of 2016. Study the table carefully and answer the questions that follows:
दी गयी तालिका चार विक्रेताओं A, B, C और D के द्वारा 2016 के पहले छः महीनों में बेचे गए कंप्यूटरों की संख्या दर्शाती है | इस तालिका का ध्यानपूर्वक अध्ययन करें तथा पूछे गए प्रश्नों का उत्तर दें |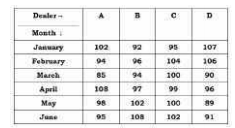 What is the ratio of the total number of computers sold by dealer A in February, April and May to the total number of computers sold by dealer D in March, May and June? /
विक्रेता A के द्वारा फरवरी, अप्रैल और मई में बेचे गए कंप्यूटरों की कुल संख्या तथा विक्रेता D के द्वारा मार्च, मई और जून में बेचे गए कंप्यूटरों की कुल संख्या के बीच क्या अनुपात है ?View Solution
