Refer to the pie chart and answer the given questions.
Percentage distribution of rice to 5 retailers A, B, C, D and E from a granary (having total quantity=800 kg) in
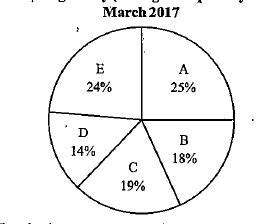
In April 2017, if the quantity of rice distributed to retailer C is increased by 15% and that to retailer D decreased by 20% over the previous month then find the total quantity distributed to C and D together in month April 2017.
264.4 kg
364.4 kg
284.6 kg
254.4 kg
The correct Answer is:A
Step by step video, text & image solution for Refer to the pie chart and answer the given questions. Percentage distribution of rice to 5 retailers A, B, C, D and E from a granary (having total quantity=800 kg) in In April 2017, if the quantity of rice distributed to retailer C is increased by 15% and that to retailer D decreased by 20% over the previous month then find the total quantity distributed to C and D together in month April 2017. by Maths experts to help you in doubts & scoring excellent marks in Class 14 exams.
Updated on:21/07/2023Similar Questions
Study the graph and answer the question
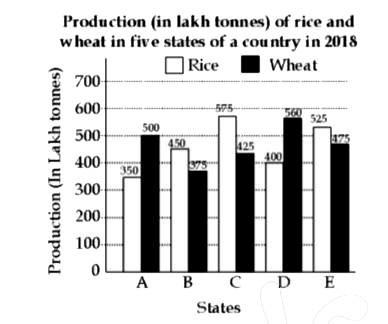
Total production of wheat in states A , B and E is what percentage less than the total production of rice in states C, D and E?
View Solution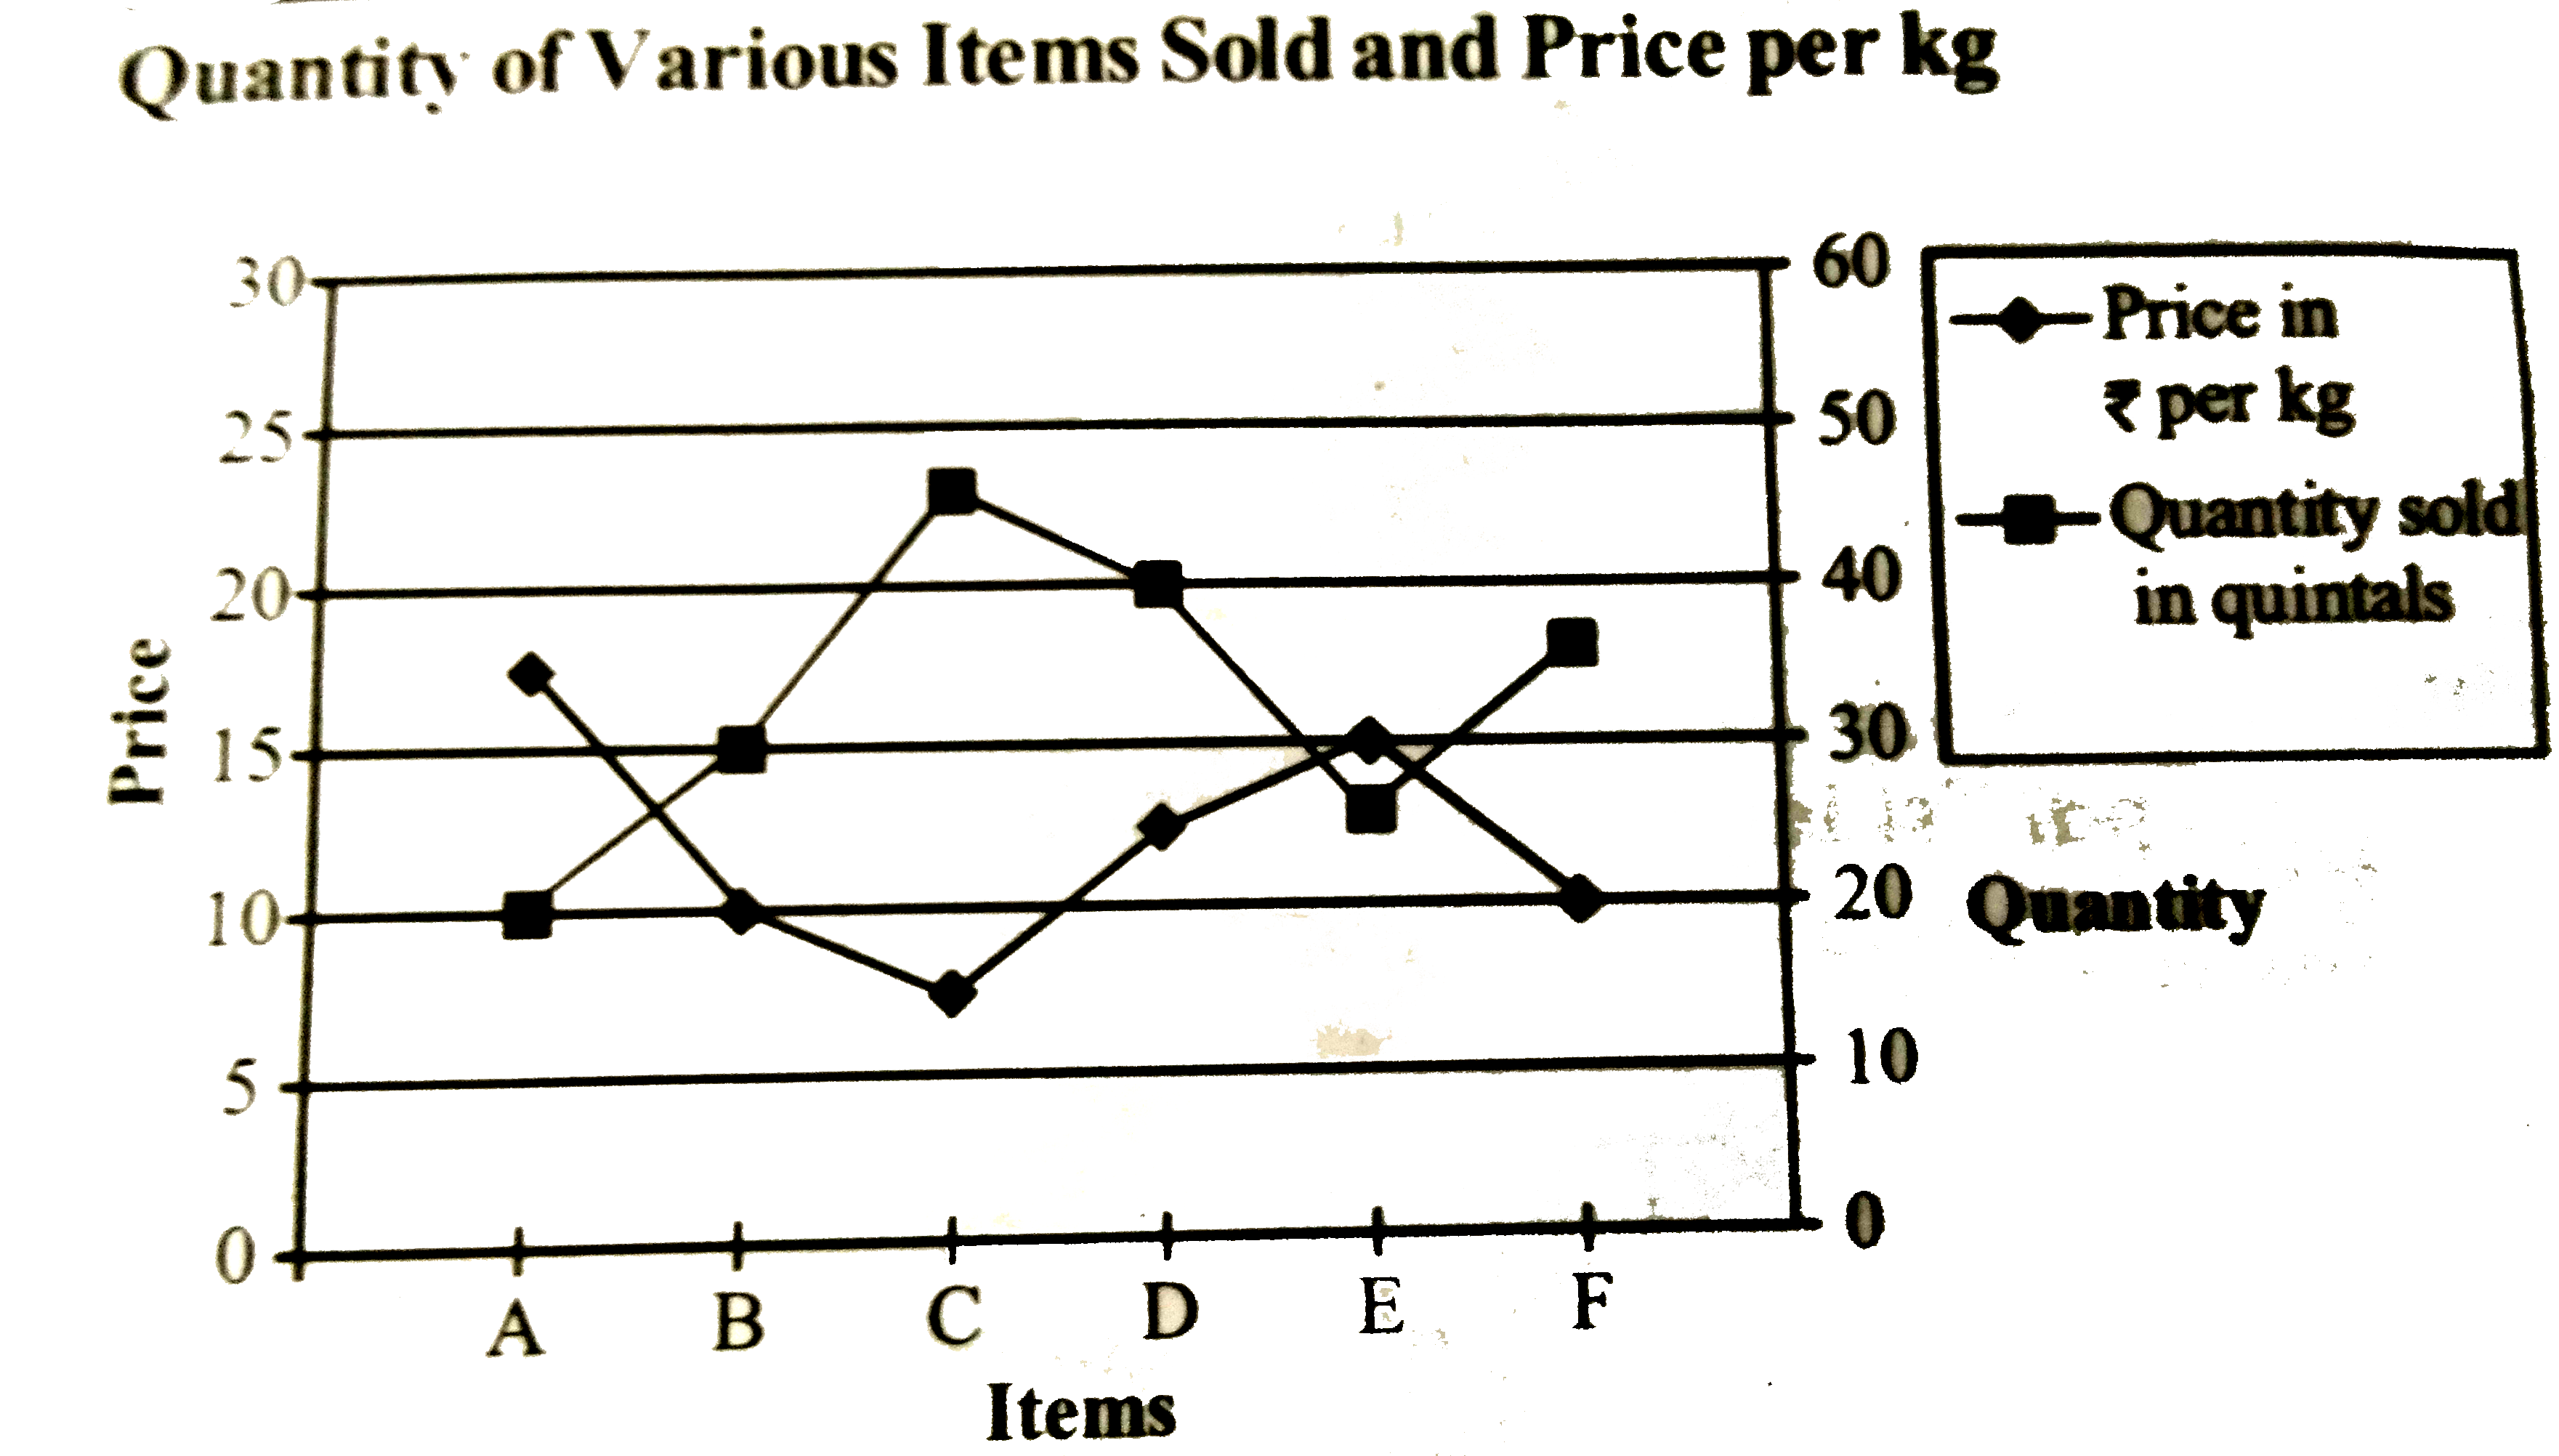
If the price as well the quanity sold is increases by 20% for item A, what is the total value of quantity sold for item
View Solution
Knowledge Check
Study the graph and answer the question.
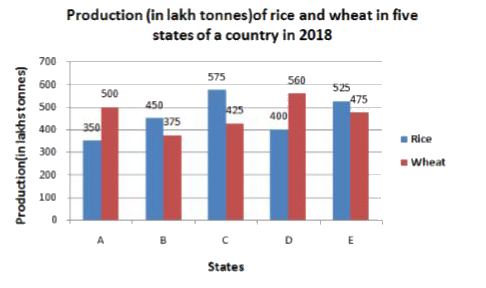
Total production of wheat in states A, B and E is what percentage less than the total production of rice in states C, D and E?A10B12C12.2D11.1The price of oil is increased by 20%. However, the expenditure on it increases by 15%. What is the percentage increase or decrease in the consumption of oil?
A614% decreaseB416% decreasC416% increaseD614% increase
As a result of increase in price by 20%, the quantity demanded decreases by 40%. Comment on PED.
View SolutionReading of pie chart for the % wise distribution of lectures in different subjects
View SolutionThe given pie chart shows the quantity wise sales distribution of five products (A, B, C, D and E) of a company in 2016.
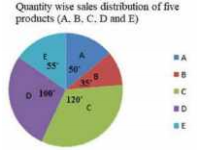 In 2016, if a total of 14616 units were sold, then the number of units of products D sold was:
View SolutionThe given pie chart shows the quantity wise sales distribution of five products (A, B, C, D and E) of a company in 2016.
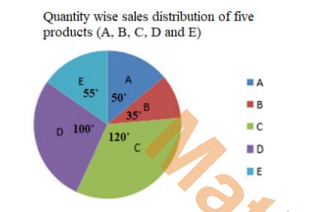 In 2016, if a total of 14616 units were sold, then the number of units of products D sold was:
View Solution75kg 300g of rice is distributed among 15 persons. The quantity of rice received by each person is
View SolutionStudy the pie chart and answer the question. Distribution of the number of employees of a companyworking in 5 department A, B , C, D and E
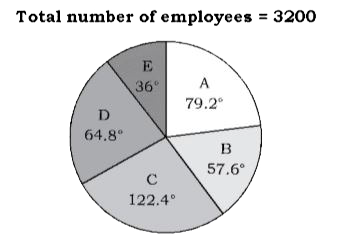
the number of employees working in department C is what percentage more than the total number of employees working in D and E?
View Solution
