Refer to the graph and answer the given questions.
Data related to number of calories burned by two individuals (A and B) on treadmill during 5 days
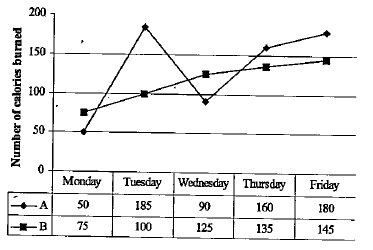
What is the ratio of the total number of calories burned by A and B together on Wednesday to that by the same individuals together on Tuesday?
61:43
43:57
57:43
43:61
The correct Answer is:B
Step by step video & text solution for Refer to the graph and answer the given questions. Data related to number of calories burned by two individuals (A and B) on treadmill during 5 days What is the ratio of the total number of calories burned by A and B together on Wednesday to that by the same individuals together on Tuesday? by Maths experts to help you in doubts & scoring excellent marks in Class 14 exams.
Updated on:21/07/2023Similar Questions
Directions: Refer to the following graph and answer the given questions. Data related to the number of shoes sold by two stores (A and B )during five years:
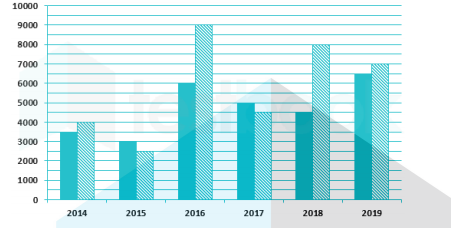
Find the ratio between the total number of shoes sold by stores A and B together in 2016 to the total number of shoes sold by stores A and B together in 2018?
View SolutionDirections: Refer to the following graph and answer the given questions. Data related to the number of shoes sold by two stores (A and B )during five years:
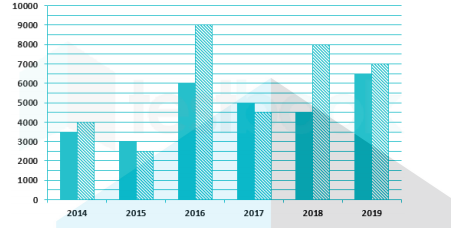
If the respective ratio between the total number of shoes sold by stores A and B together in 2014 and that in 2020 is 5 : 7.What is the total number of shoes sold by stores A and B together in 2020?
View Solution
Knowledge Check
Direction: Study the graph and answer the following question. The graph shows the total number of boys and girls in different classes of a school.
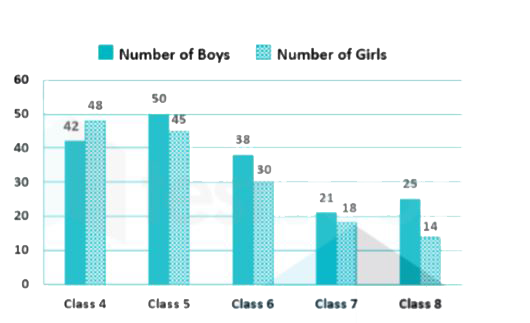
What is the ratio between total number of students in class 4 and number of boys in Class 6 and 7 together?A59:90B59:70C90:59D90:49Direction: Study the graph and answer the following question.
The graph shows the total number of boys and girls in different classes of a school.
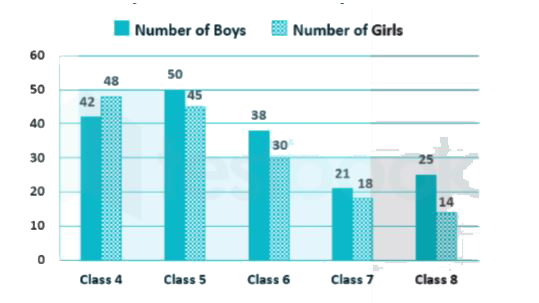
What is the total number of boys in these 5 classes together?A196B148C176D166Study the following graph carefully and answer the questions given below :
Number of students studying in different University in a year (Number in lakhs)
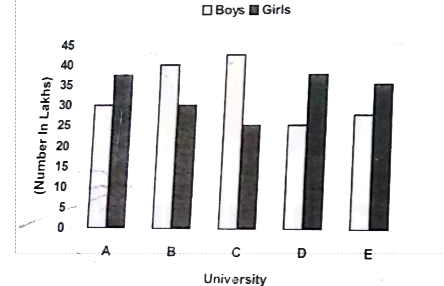
What is the respective ratio of the number of boys from university A and B together to the number of girls in the university C and E together ?A6:7B17:16C16:17D7:6
Directions: Refer to the following graph and answer the given questions. Data related to the number of shoes sold by two stores (A and B )during five years:
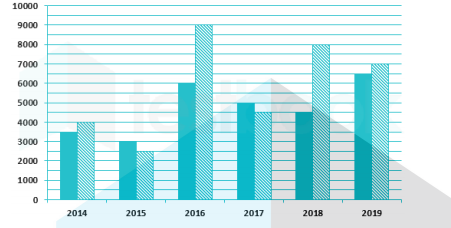
What is the difference between the total number of shoes sold by store A in 2018 and 2019 together and the total number of shoes sold by store B in 2014 and 2015 together?
View SolutionDirections: Refer to the following graph and answer the given questions. Data related to the number of shoes sold by two stores (A and B )during five years:
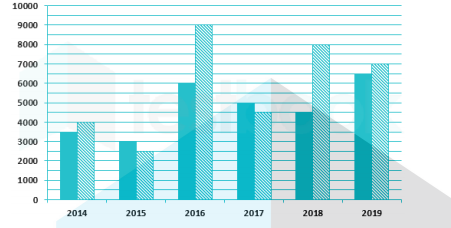
Find the difference between the total number of Shoes sold by Store A and B in all the years together?
View SolutionObserve the bar graph and answer the following questions.
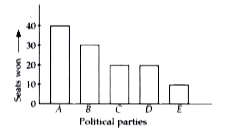
What is the total number of seats won by party A and party B?
View SolutionDirections: Refer to the following graph and answer the given questions. Data related to the number of shoes sold by two stores (A and B )during five years:
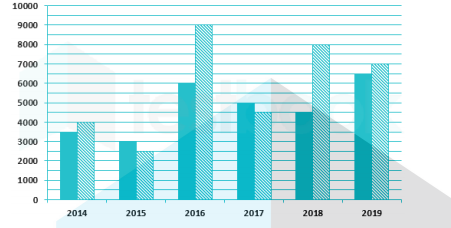
The number of shoes sold by store A decreased by what percent from 2017 to 2018?
View SolutionStudy the following graph carefully to answer these questions-
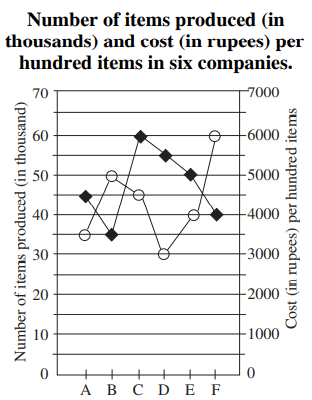
What is the total cost of items produced by companies A and B together?
View Solution
