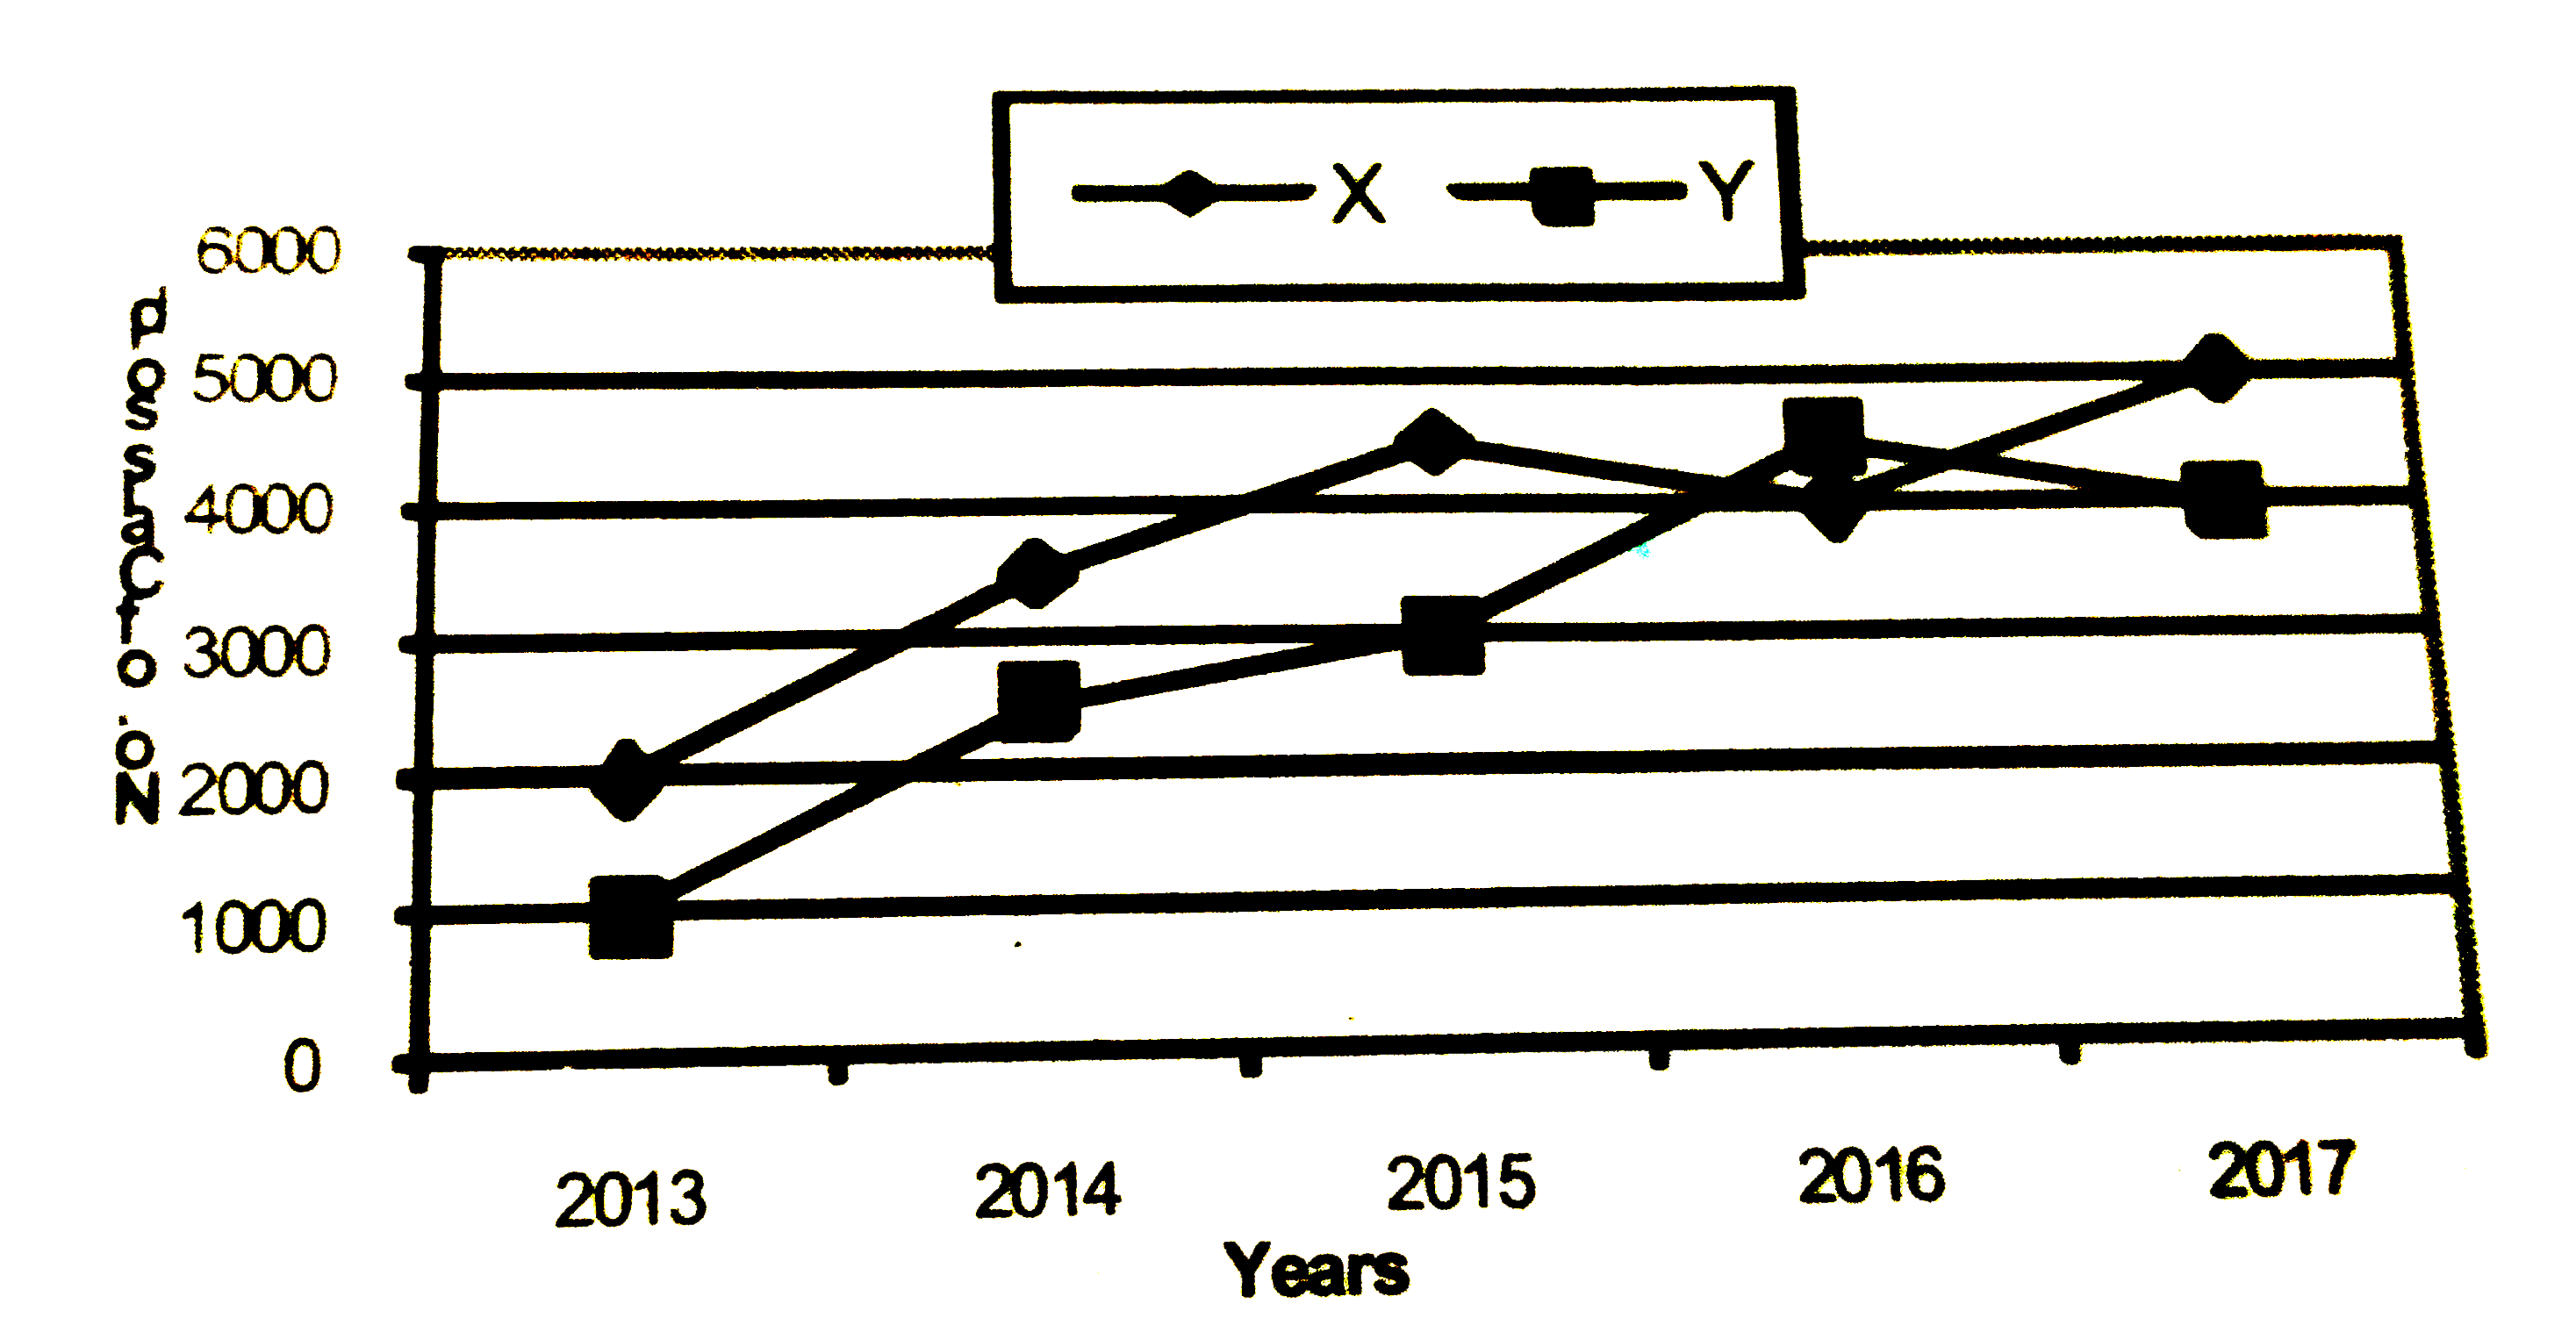
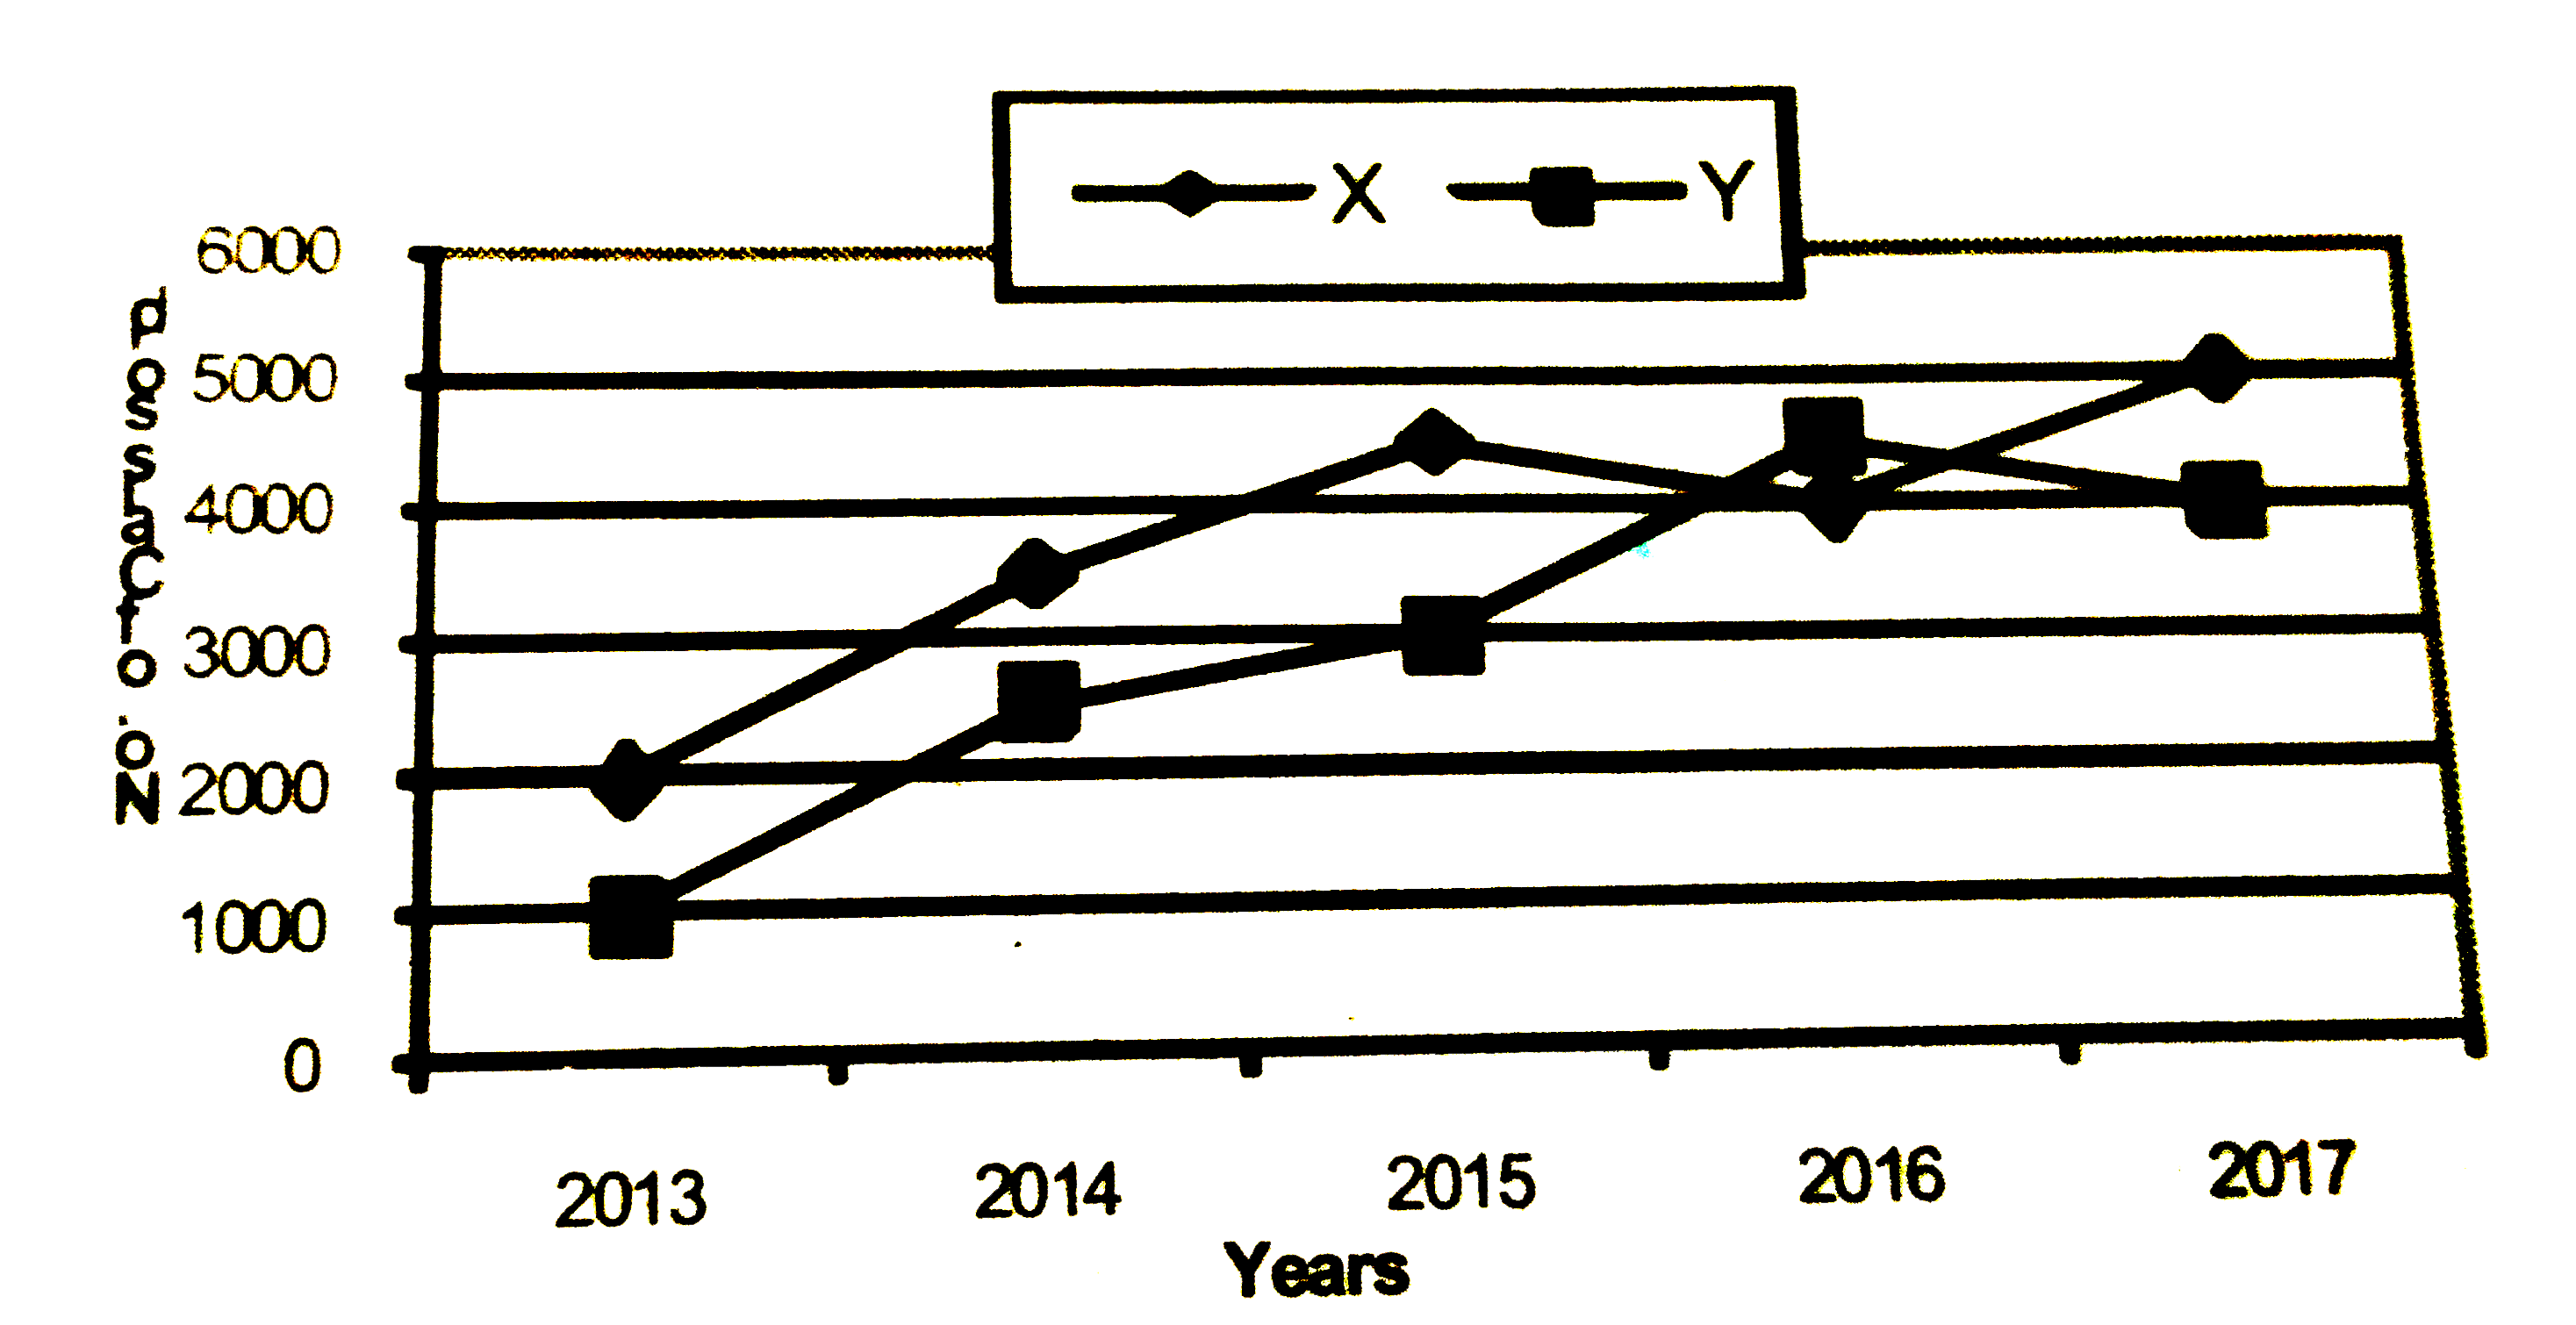
Read the following line graph answer the following questions There are two car manufacturing companies (Company X and Company Y): The sale of cars by these two different
companies is given in different years

If the sale of company X in year 2016 is increased by 20% with respect toyear 2015 and the sale ofcompany Y in year 2016 with respect to year 2015 is decreased by 10% then find the total sale of the company X and Y together in year 2016?
7200
9600
8400
5600
The correct Answer is:B
Step by step video & text solution for Read the following line graph answer the following questions There are two car manufacturing companies (Company X and Company Y): The sale of cars by these two different companies is given in different years If the sale of company X in year 2016 is increased by 20% with respect toyear 2015 and the sale ofcompany Y in year 2016 with respect to year 2015 is decreased by 10% then find the total sale of the company X and Y together in year 2016? by Maths experts to help you in doubts & scoring excellent marks in Class 14 exams.
Updated on:21/07/2023Similar Questions
There are two car manufacturing companies (Company X and Company Y). The sale of cars by these two different companies is given in different years.
If the sale of company X in year 2018 is increased by 20% with respect to yar 2017 and the sale of company Y in years 2018 with respect to year 2017 is decreased by 10% then find the total sale of the company X and Y together in year 2018?
View SolutionThere are two car manufacturing companies (Company X and Company Y). The sale of cars by these two different companies is given in different years.
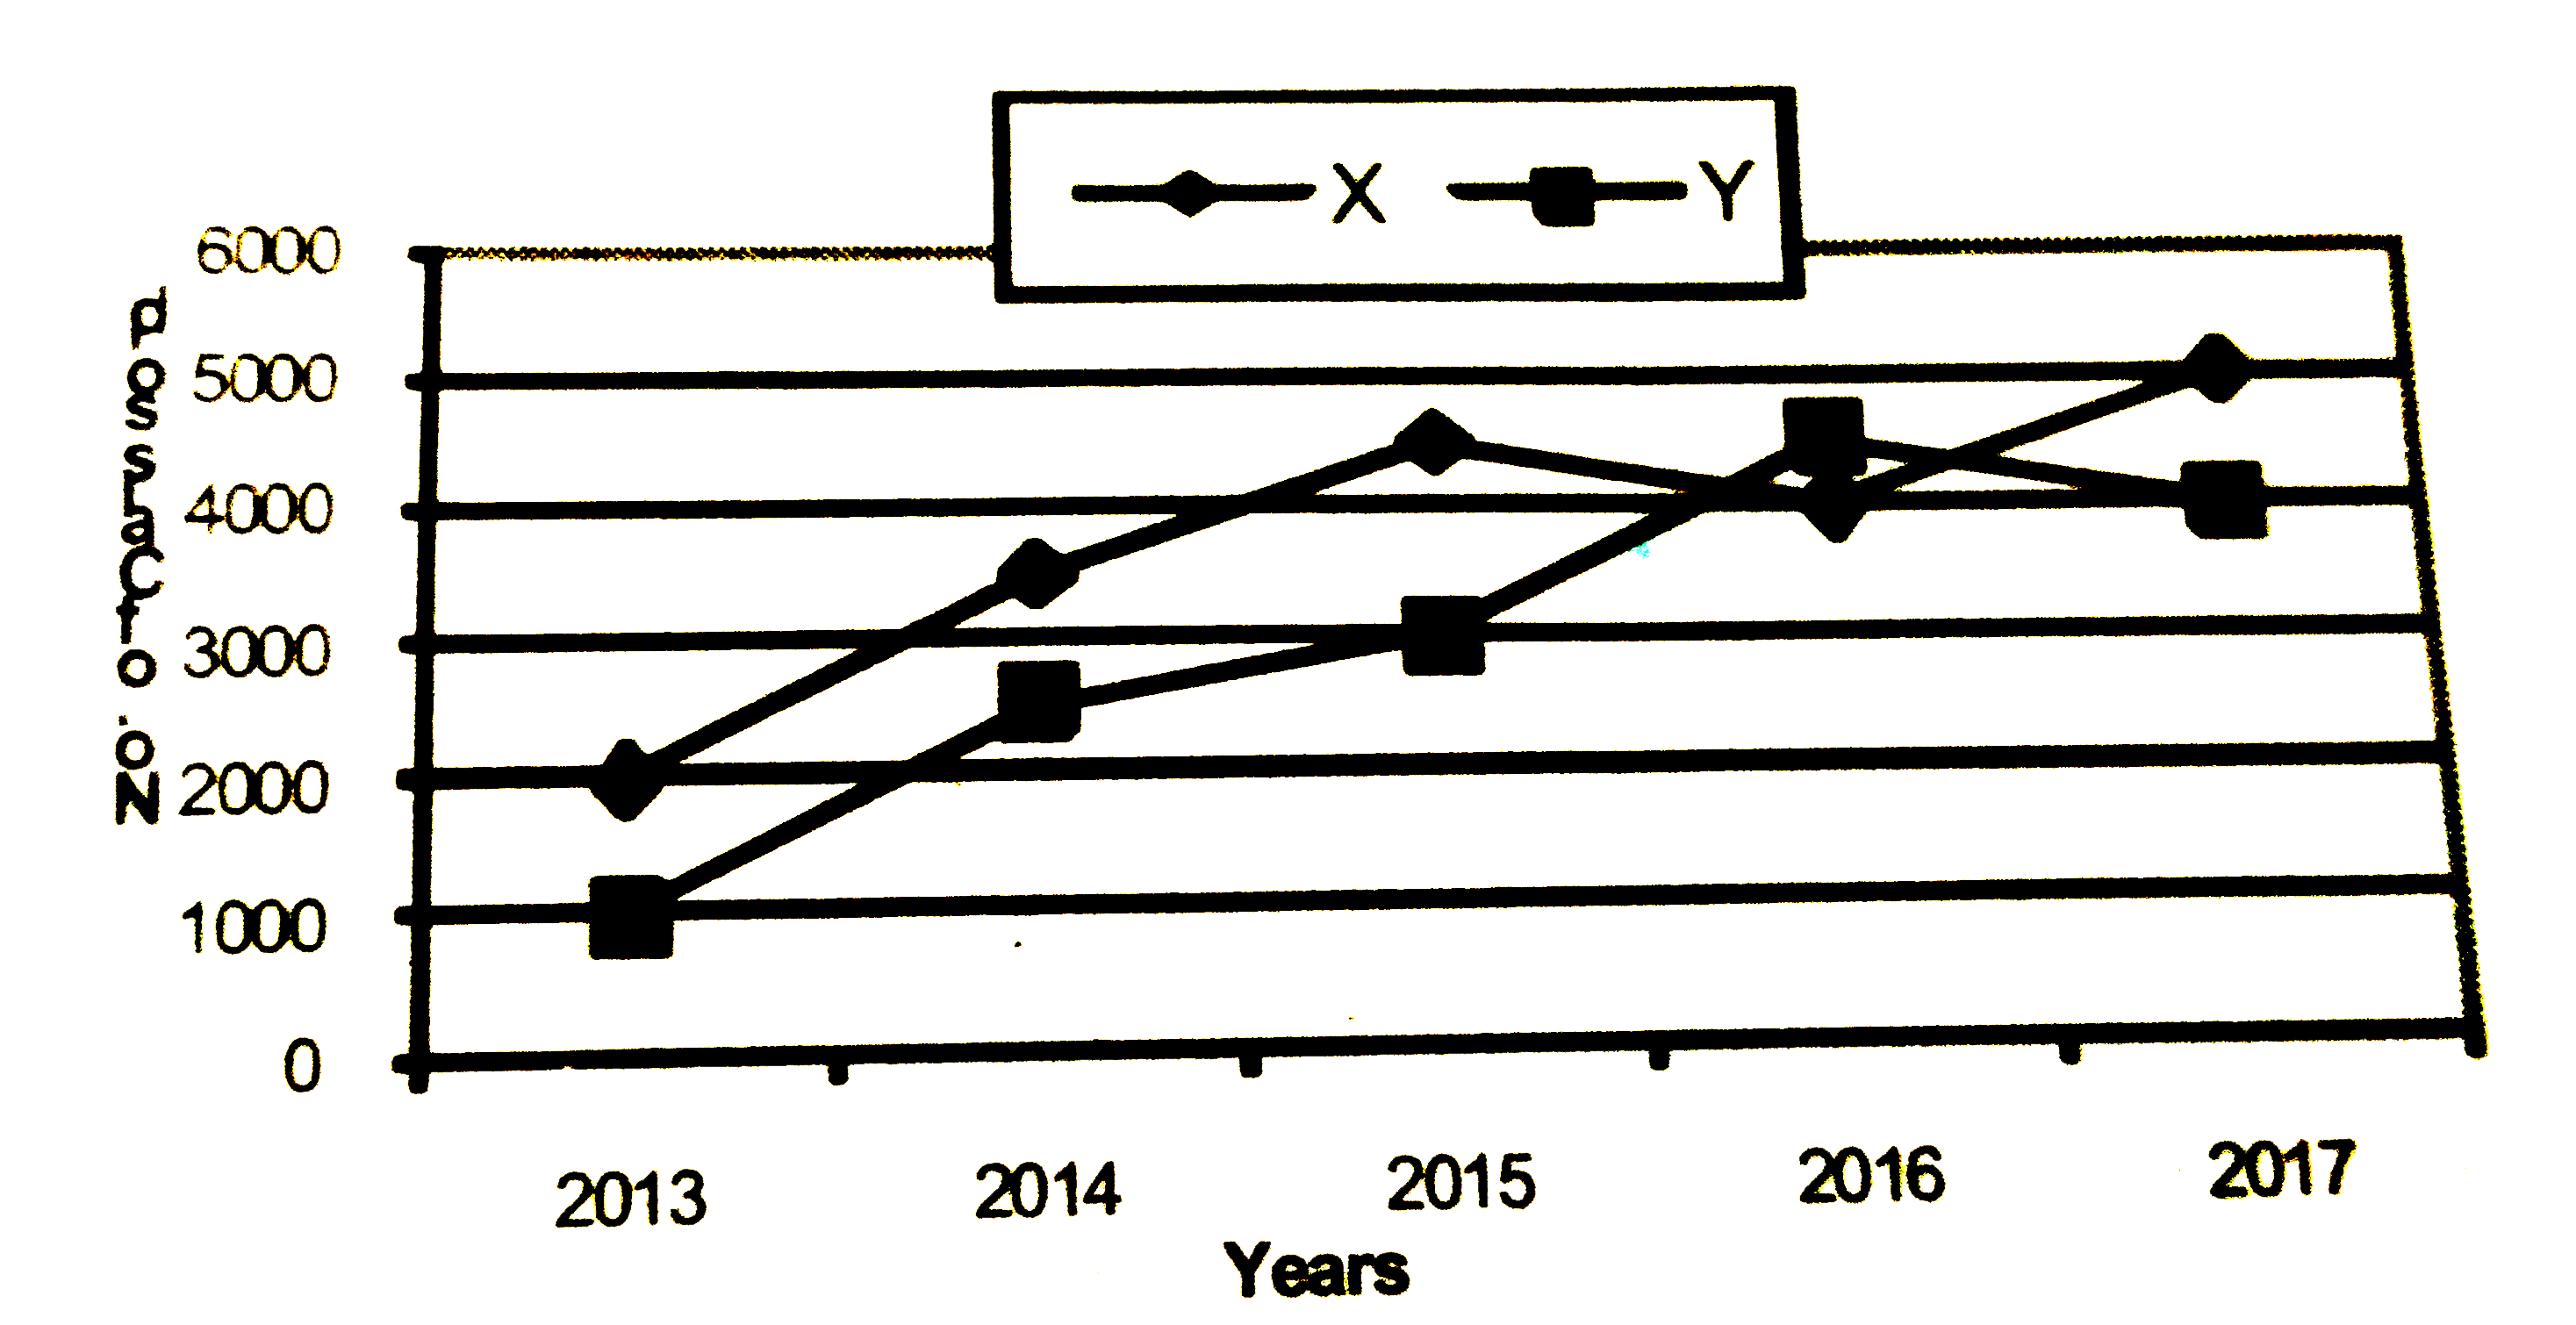
Find the ratio of the sales of company X in years 2013, 2015 and 2017 together to the total sale of company Y in year 2014 and 2016 ? together ?
View Solution
Knowledge Check
Study the following line graph and answer the questions.
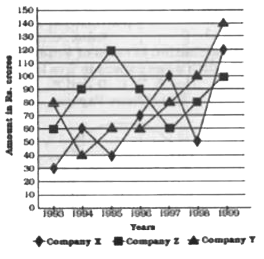
In which year was the difference between the exports of companies Y and Z maximum ?A1994B1997C1995D1996
There are two car manufacturing companies (Company X and Company Y). The sale of cars by these two different companies is given in different years.
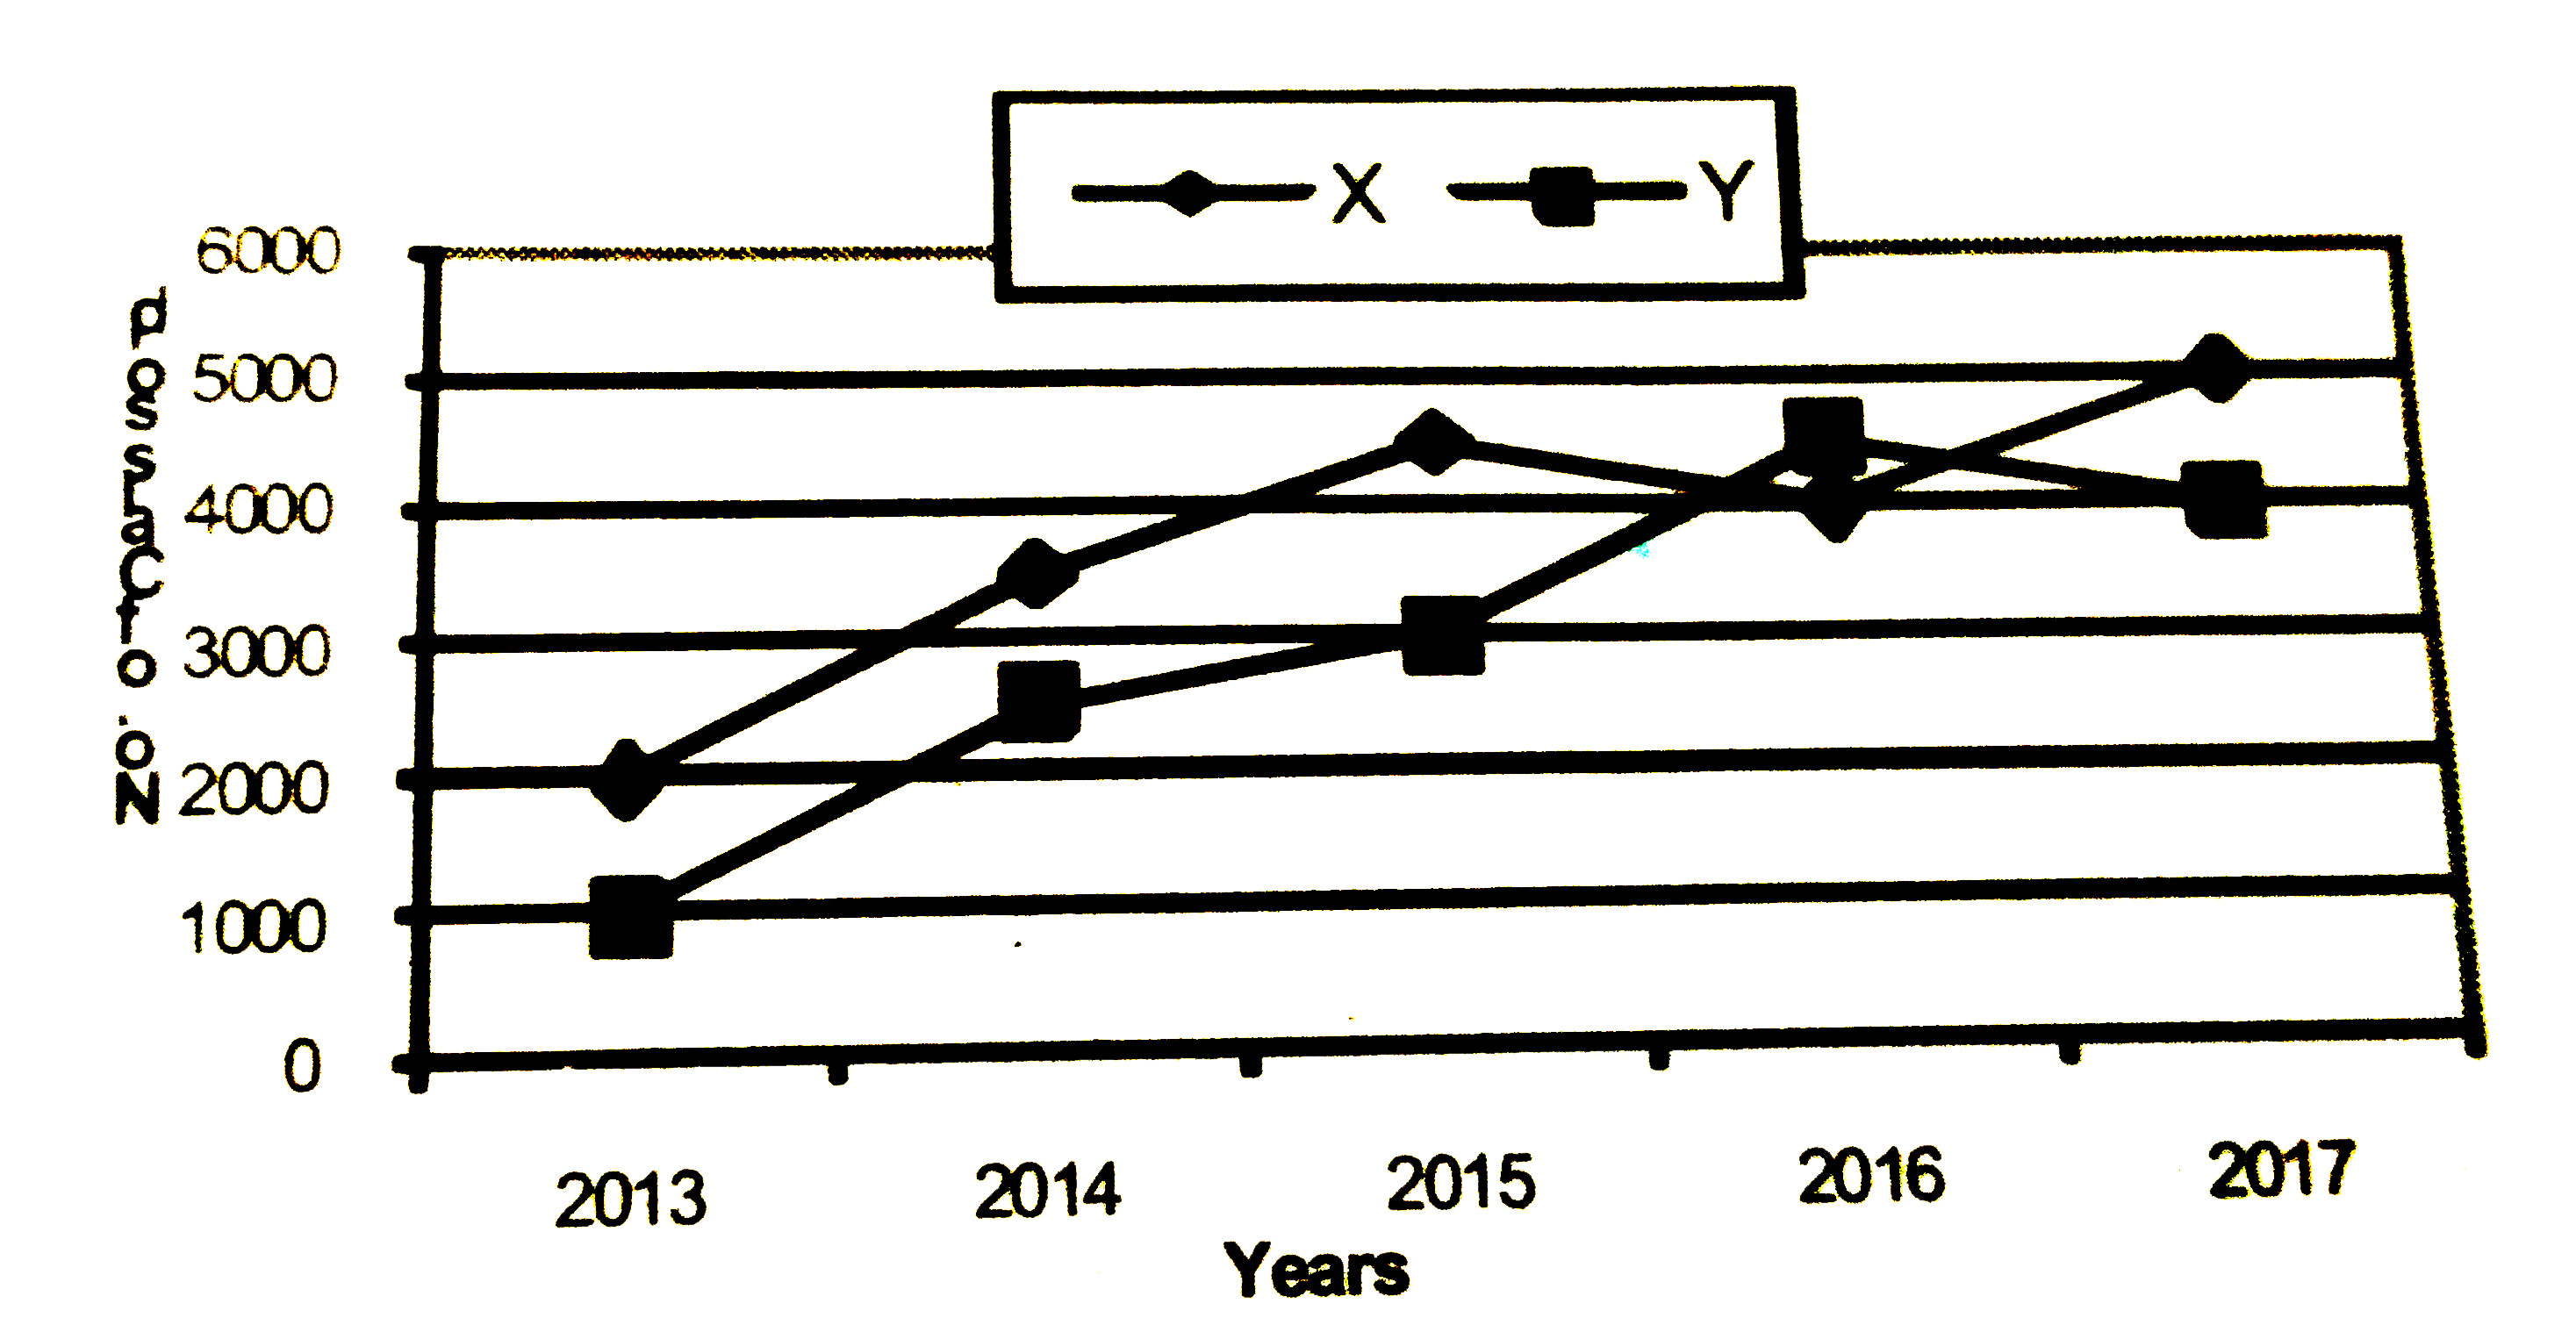
Find the total number of cars sold by both companies from year 2014 to 2016 ?
View SolutionThere are two car manufacturing companies (Company X and Company Y). The sale of cars by these two different companies is given in different years.
Total cars sold by both companies in year 2014 are what percent more/less the total cars sold by both companies in year 2015 ?
View SolutionThere are two car manufacturing companies (Company X and Company Y). The sale of cars by these two different companies is given in different years.
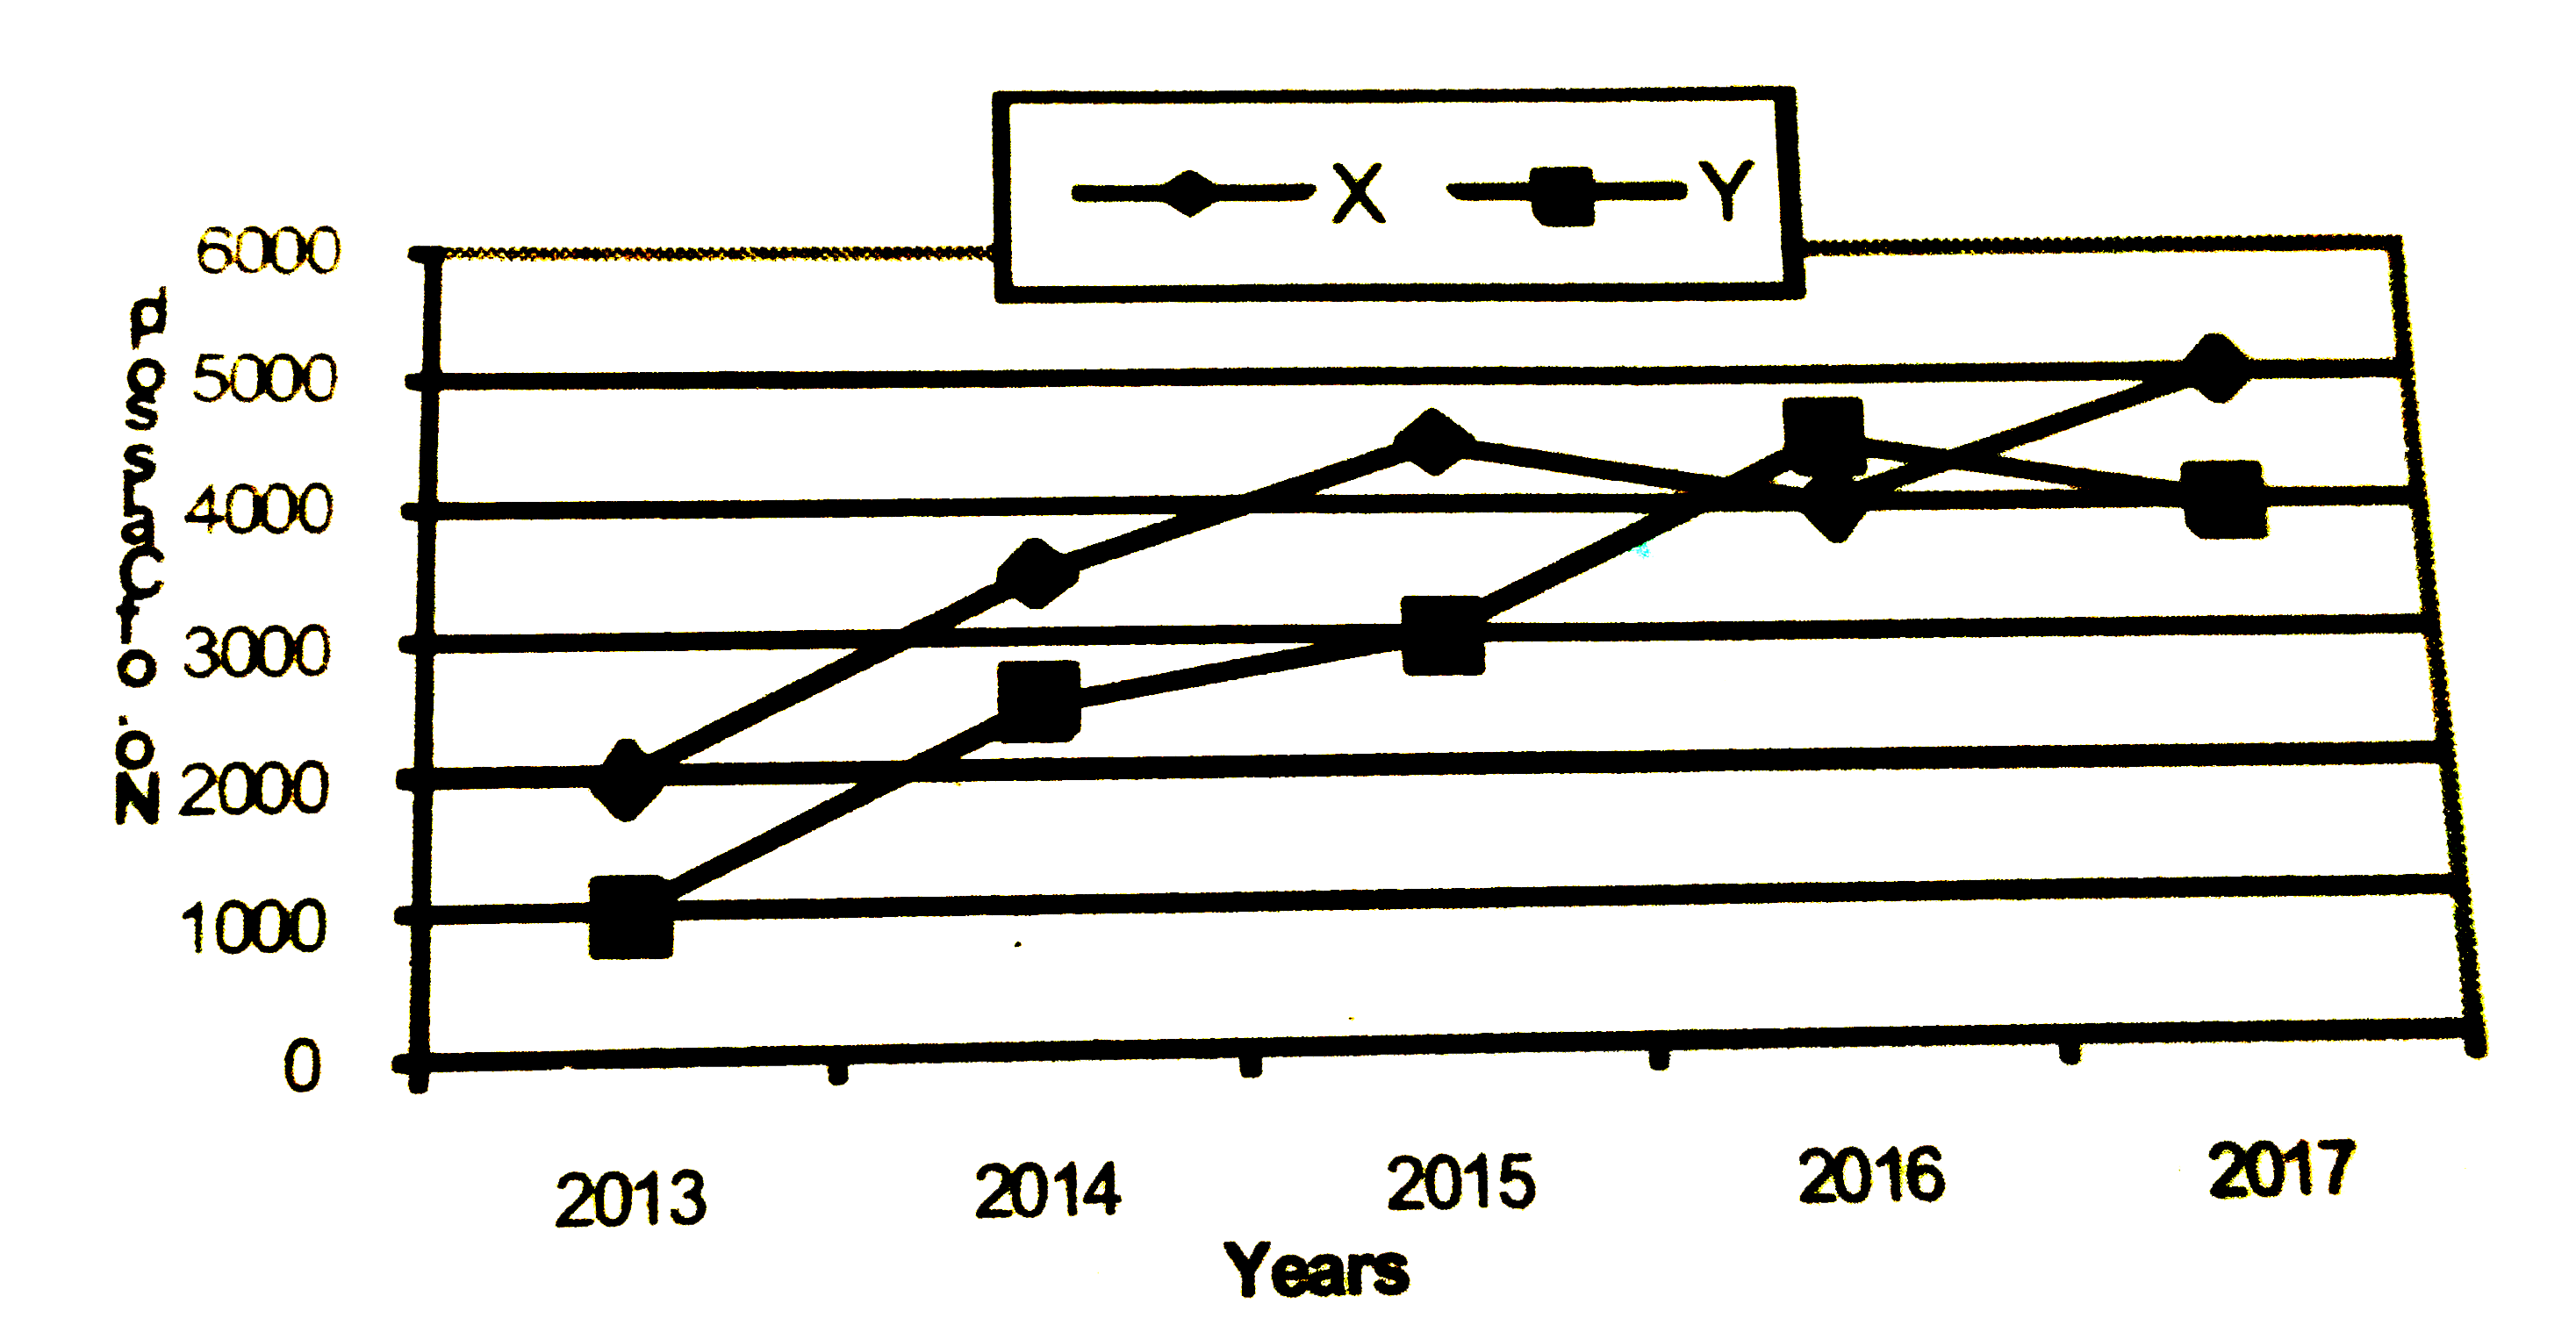
Find the difference between the average number of cars sold by company X & company Y from 2013 to 2017 ?
View SolutionThe sale receipt of a company during a year was Rs. 20956480. Next year, it increased by Rs. 6709570. What was the total sale receipt of the company during these two years ?
View SolutionFormation of table for the production and sales of a company in different years
View SolutionStudy the following graph carefully to answer the questions given below. Expenditure in lakhs) of three different Companies in Five Different Years
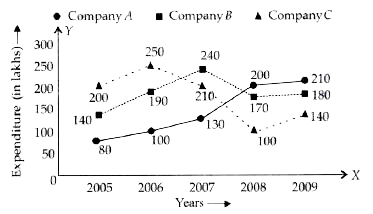
What was the ratio of the expenditure of Company A in the year 2009 to the expenditure of Company B in the year 2005?
View SolutionReading of line graphs containing the profit earned in different year by two company
View Solution
