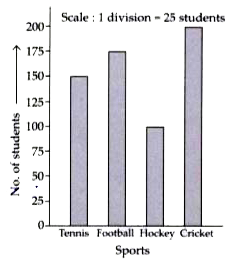
Refer to the graph and answer the given questions
Data regarding the number of students opting for one of the five games at a Sports Academy (having a total strength of 1400 students)
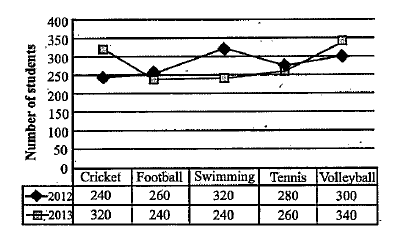
In 2012, number'of students opting for football is what per cent less than those opting for swimming?
1834
1814
2013
1734
The correct Answer is:A
Step by step video, text & image solution for Refer to the graph and answer the given questions Data regarding the number of students opting for one of the five games at a Sports Academy (having a total strength of 1400 students) In 2012, number'of students opting for football is what per cent less than those opting for swimming? by Maths experts to help you in doubts & scoring excellent marks in Class 14 exams.
Updated on:21/07/2023Similar Questions
Knowledge Check
Refer the following data table and answer the following Question.

What percent of students who choose Engineering are girls ?AA)40BB)22.86CC)50DD)100If in the pie chart representing the number of students opting for different streams of study out of a total strength of 1650 students , the central angle of the sector representing arts students is 48∘ then what is the number of students who opted for arts stream ?
A220B240C275D320The pie-chart given below shows the number of students who like the five beverages Pepsi, Coke, Fanta, Frooti and Dew. The total number of students is 540.
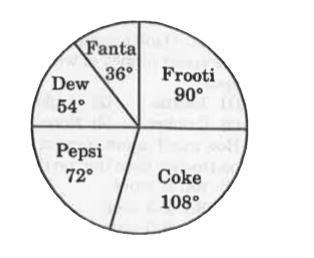
What is the total number of students who like Frooti and Pepsi?A135B108C288D243
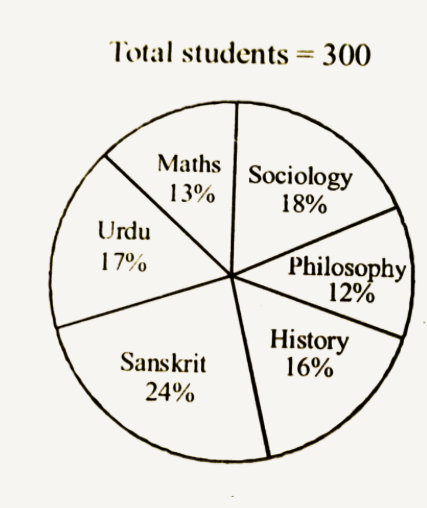
Find the central angle of total number of students who opted for History ?
View Solution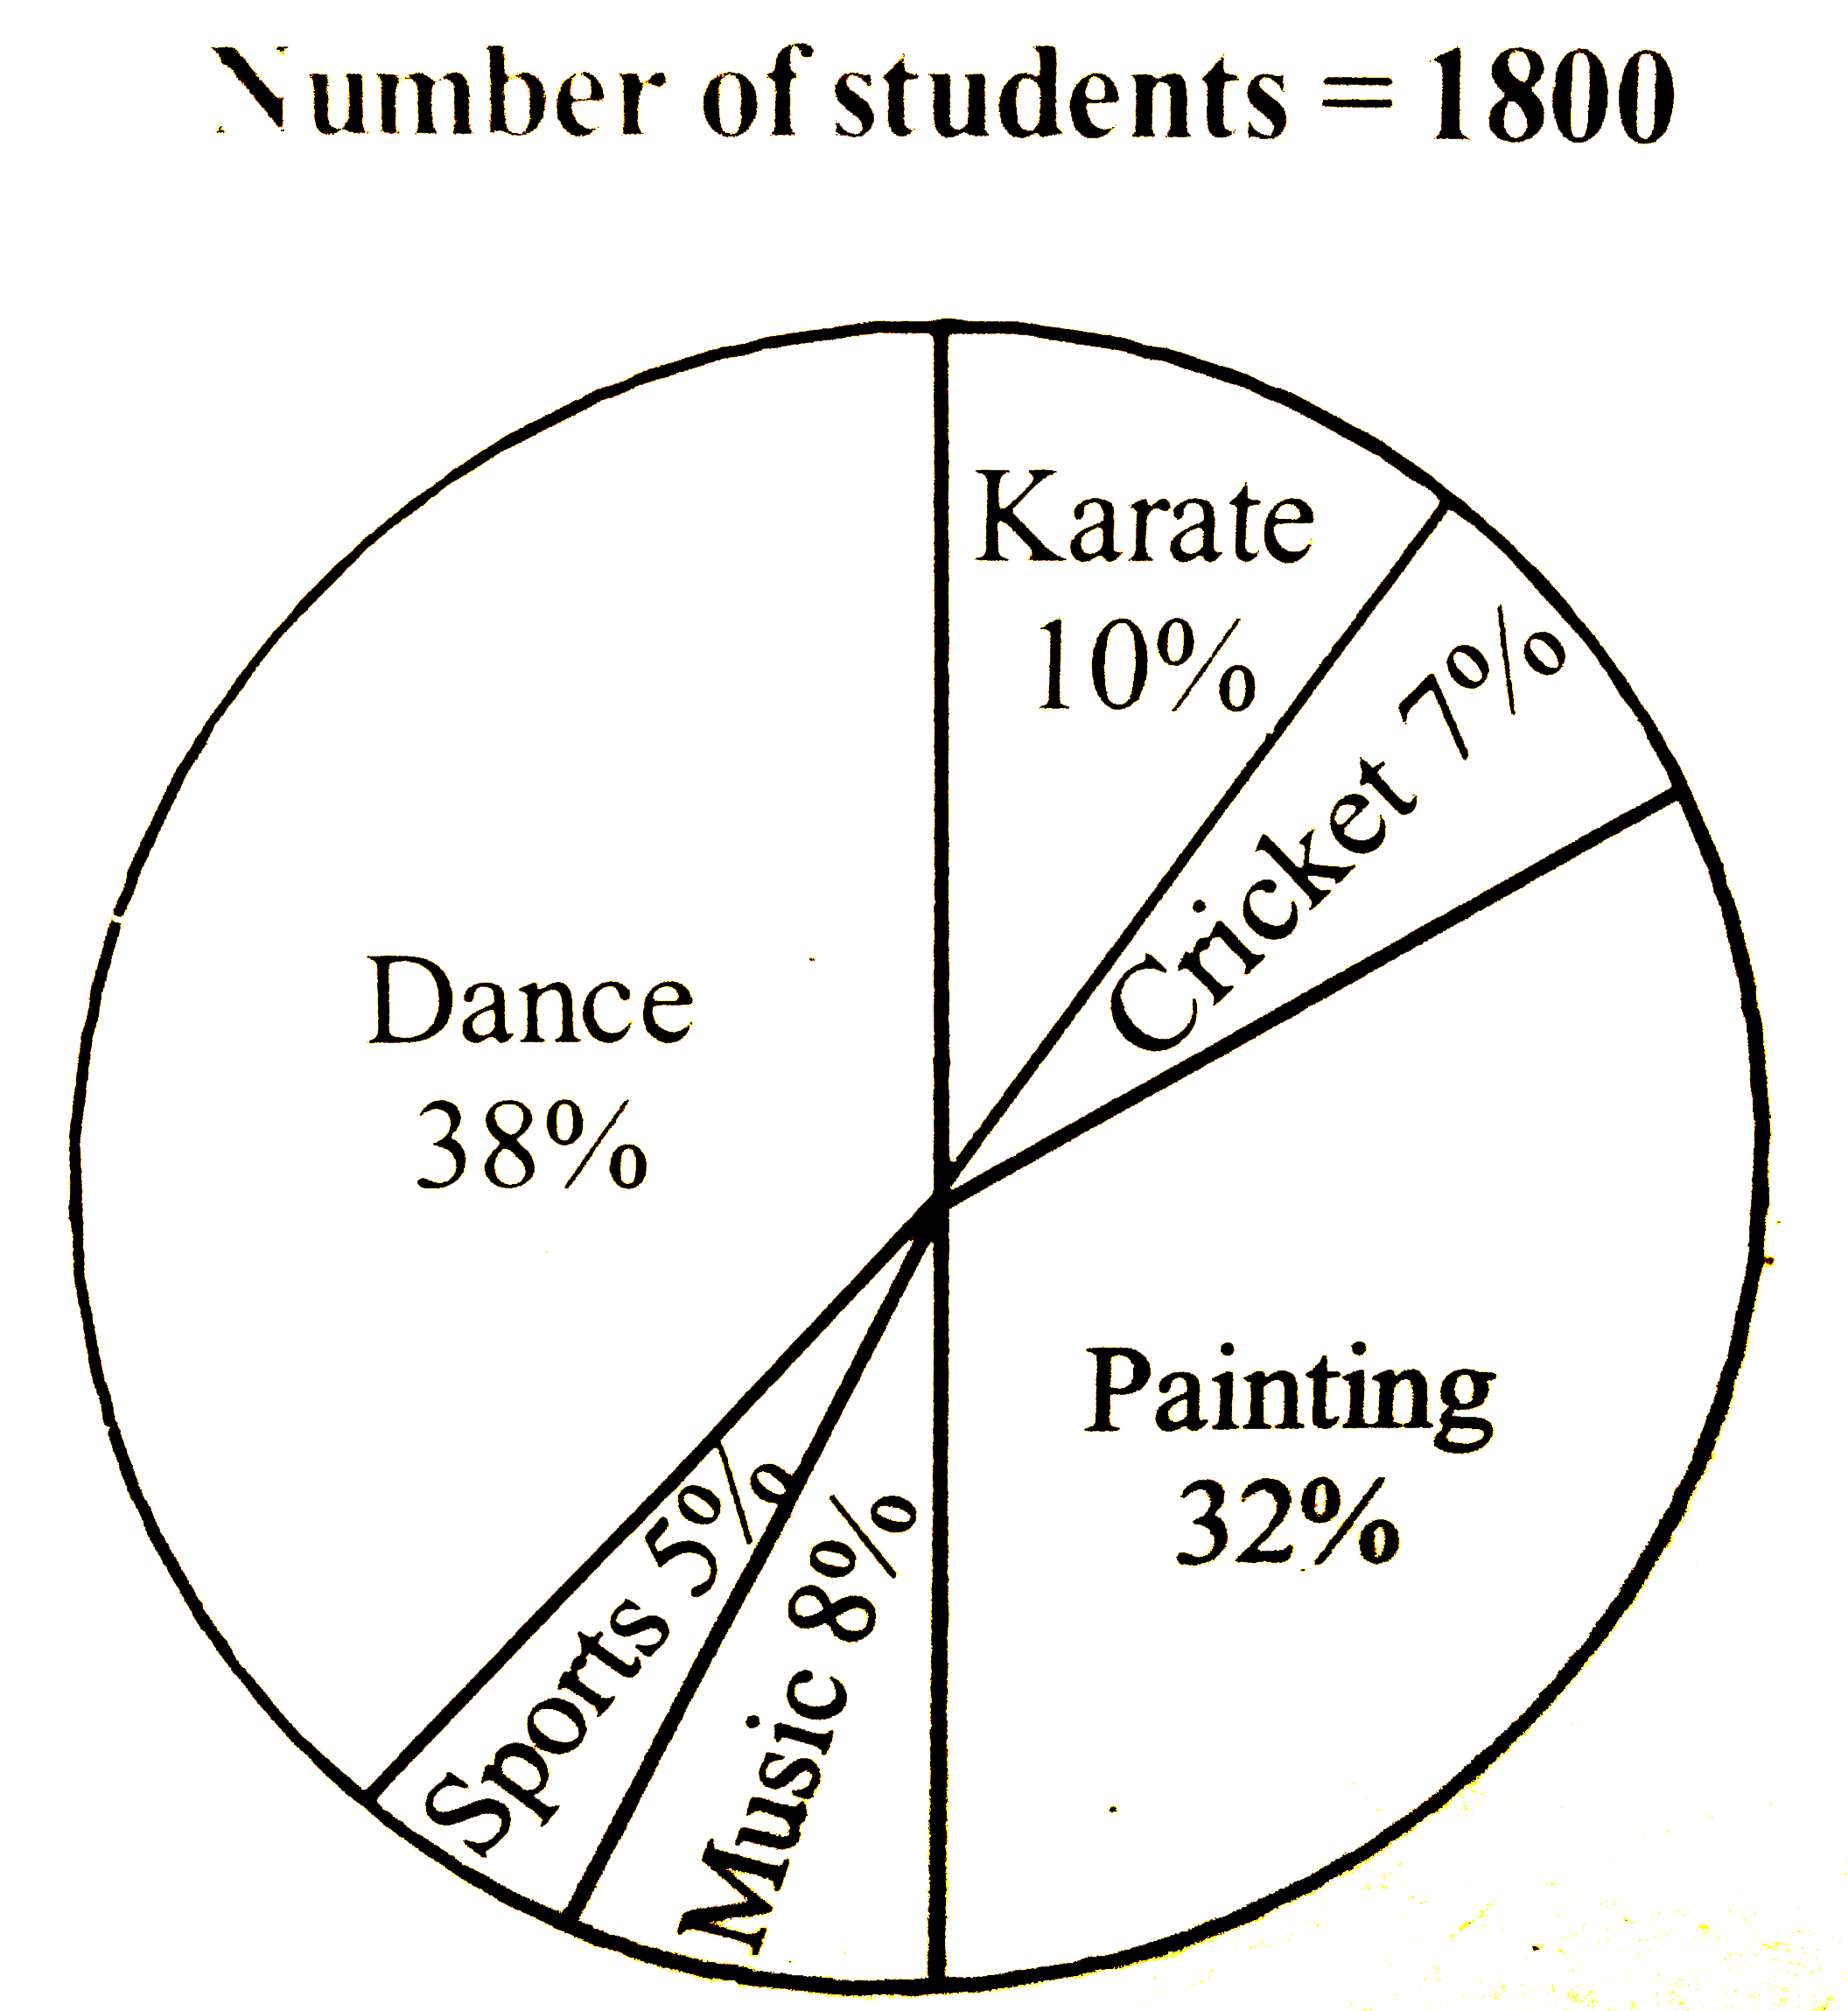
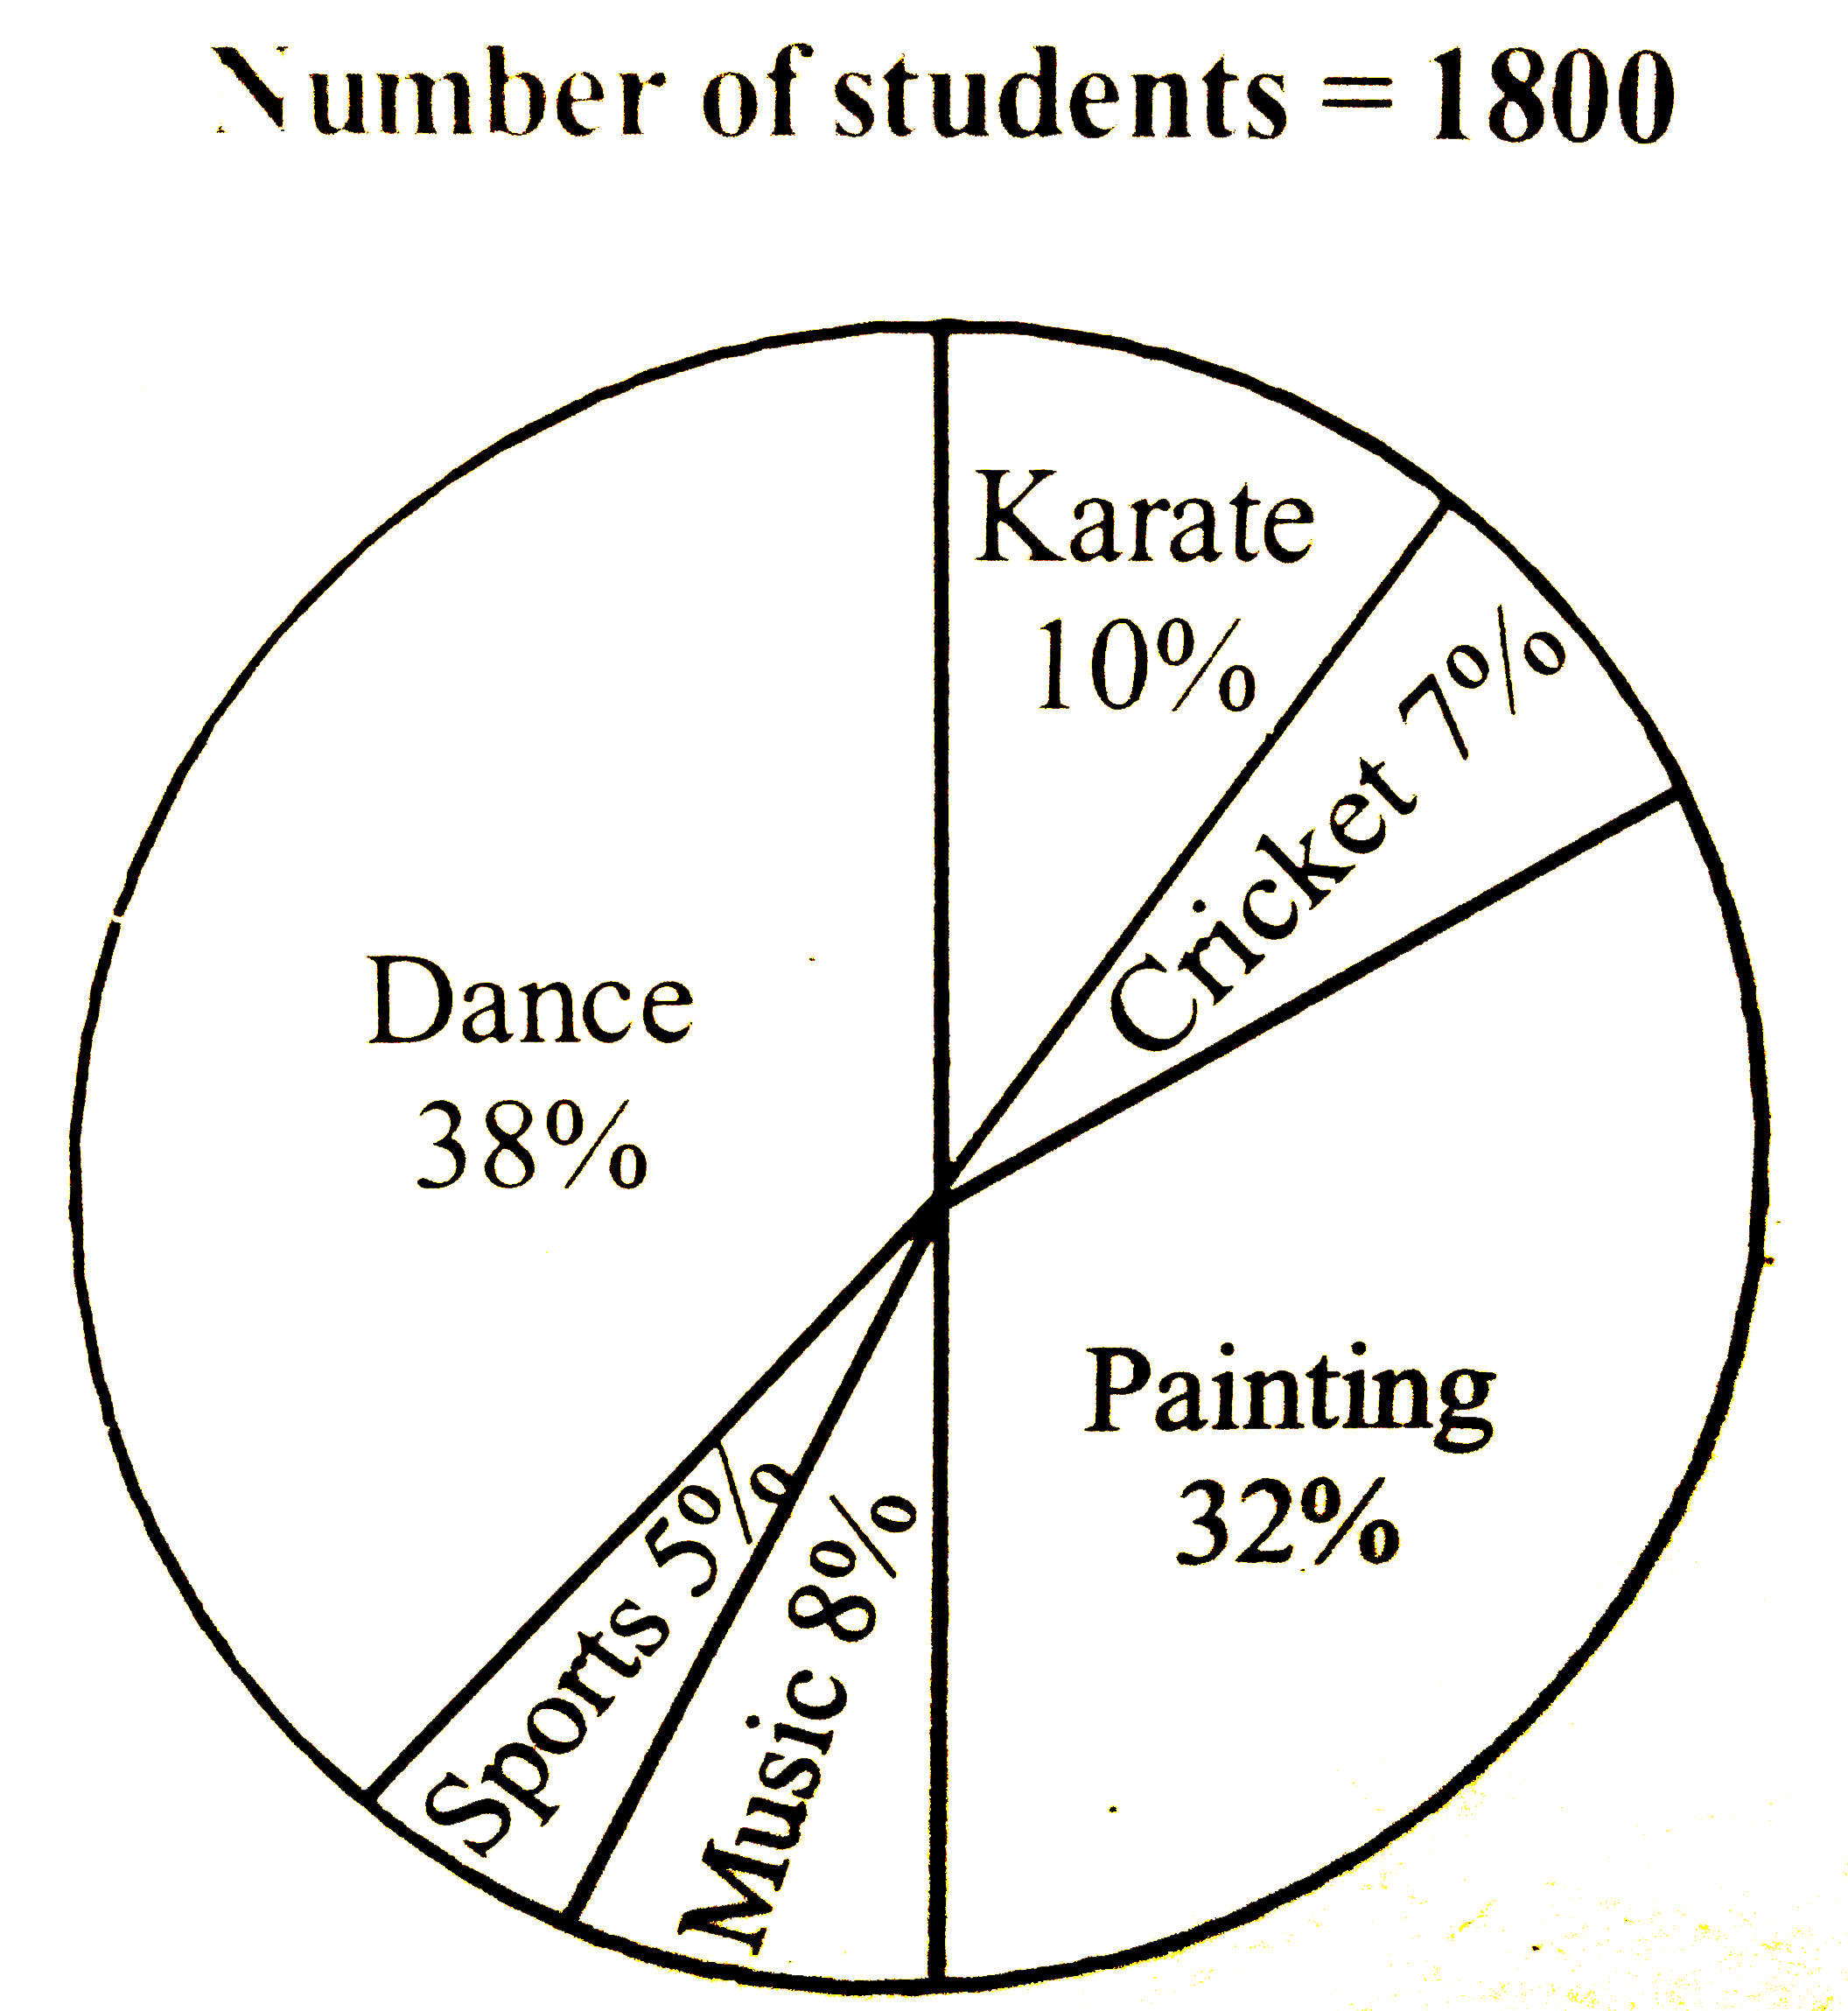
What is the respective ratio between the number of students who opted for painting and that who opted for Karate ?
View Solution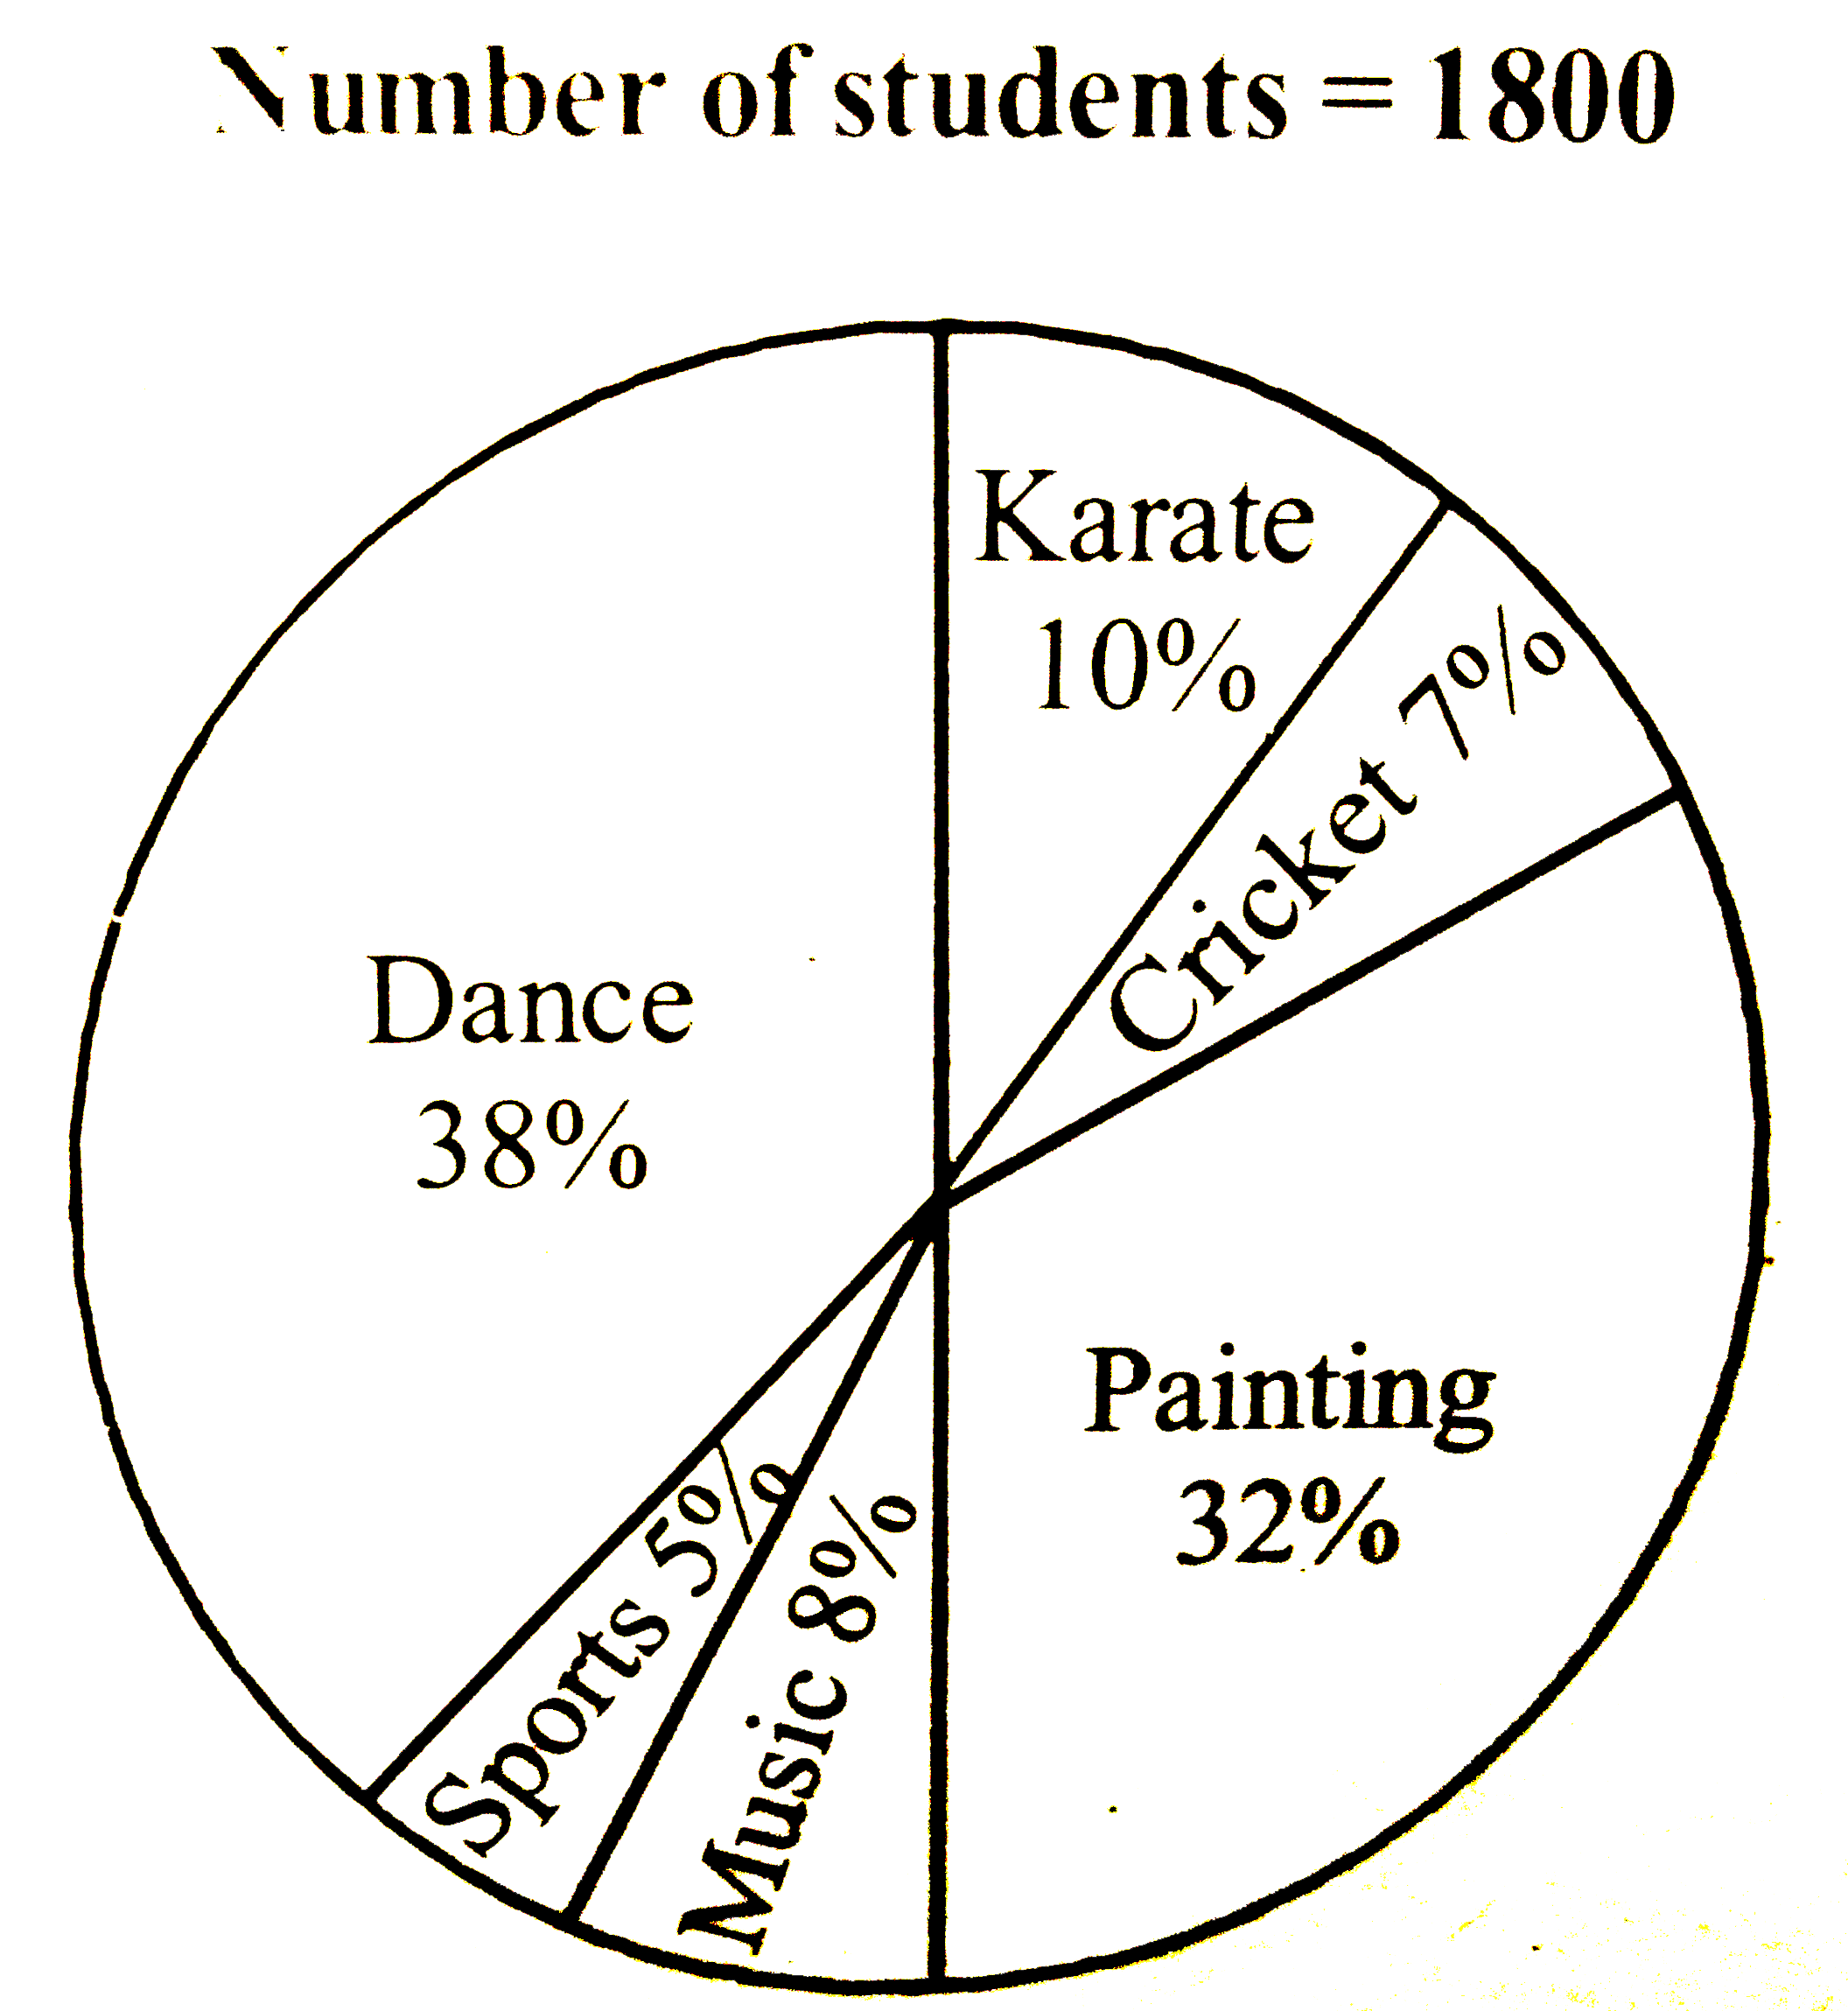
What is the respective ratio between the number of students who opted for dancing and karate who opted for painting
View SolutionStudy the given graph and answer the question that follows
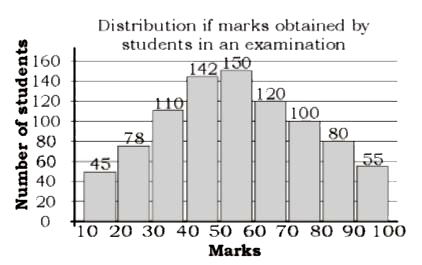
The total marks of students obtaining less than 50 marks is what percentage more than the total number of students obtaining 60 marks or more
View SolutionIn a school some of the students opted for the NSS and some opted for gardening. Three times the number of students opting for NSS is 10 less than twice the number of students opting for gardening. One-third the number of students opting for NSS is equal to one-fifth the number of students opting for gardening. Find the number of students opting for NSS and gardening respectively.
View Solution

