एक संख्या में 30 % की वृद्धि हुई फिर 25 % की कमी आई , फिर 25 % की वृद्धि हुई। संख्या में कितने प्रतिशत की शुद्ध वृद्धि/कमी हुई ?
22 % कमी
22 % वृद्धि
21 % कमी
21 % वृद्धि
The correct Answer is:B
Step by step video & text solution for एक संख्या में 30 % की वृद्धि हुई फिर 25 % की कमी आई , फिर 25 % की वृद्धि हुई। संख्या में कितने प्रतिशत की शुद्ध वृद्धि/कमी हुई ? by Maths experts to help you in doubts & scoring excellent marks in Class 14 exams.
Updated on:21/07/2023Similar Questions
The radius of a cylinder is increased by 60% and height is decreased by 20%, what is percentage increase in it’s volume?
एक बेलन की त्रिज्या 60% बढ़ा दी जाती है और ऊंचाई 20% कम कर दी जाती है | इसके आयतन में कितने प्रतिशत की वृद्धि होगी ?
View SolutionEach side of a rectangular field is increased by 10%. Then the percentage increase in the area of the field is: एक आयताकार मैदान के प्रत्येक भुजा में 10% की वृद्धि हुई है। फिर मैदान के क्षेत्रफल में प्रतिशत वद्धि है:
View SolutionThe given Bar Graph presents the number of students of two schools for six years. दिया गया दंड आरेख छः वर्ष की अवधि में दो विद्यालयों में छात्रों की संख्या को दर्शाता है | In which year, the percentage increase in students in school B is the highest in comparison to its previous year? किस वर्ष में, विद्यालय B में छात्रों की संख्या में प्रतिशत वृद्धि इसके पिछले वर्ष की तुलना में सबसे अधिक रही है?
View SolutionThe given Bar Graph presents the number of students of two schools for six years. दिया गया दंड आरेख छः वर्ष की अवधि में दो विद्यालयों में छात्रों की संख्या को दर्शाता है | In which year, the percentage increase of students in school A is the highest in comparison to its previous year? किस वर्ष, विद्यालय A में छात्रों की संख्या में प्रतिशत वृद्धि पिछले वर्ष की तुलना में सर्वाधिक है ?
View SolutionIn the given bar graph, the percentage decrease in the number of students in Institute A in 2016 is what percent of students in 2015. इस दंड आरेख में संस्थान A में 2016 में छात्रों की संख्या में प्रतिशत कमी 2015 के छात्रों की संख्या का क्या प्रतिशत है ?
View SolutionThe Table shows the Number of Laptops and Desktops manufactured by a company. यह तालिका किसी कंपनी के द्वारा निर्मित लैपटॉप एवं डेस्कटॉप की संख्या को दर्शाती है | Approximately what was the percentage decrease in number of desktops manufactured in 2012 from 2011? (correct to nearest integer) 2011 की तुलना में 2012 में निर्मित डेस्कटॉप की संख्या में लगभग कितने प्रतिशत की कमी आई है ?
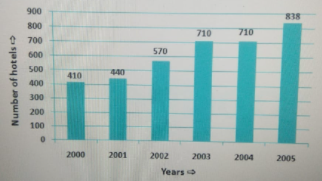
View SolutionStudy the chart and answer the questions:
In which of the given years is the percentage increase in the number of hotels in comparison to the previous year, is the maximum?
चार्ट का अध्ययन करें और प्रश्नों का उत्तर दें:पिछले वर्ष की तुलना में होटलों की संख्या में किस वर्ष में अधिकतम प्रतिशत वृद्धि हुई है?
View SolutionThe given Bar Graph presents the number of students of two schools for six years. दिया गया दंड आरेख (बार ग्राफ) छह वर्षो के दौरान दो स्कूलों में विद्यार्थियों की संख्या को दर्शाता है| In which year, percentage increase of students in school A is the highest in comparison to its previous year ? किस वर्ष में, स्कूल A की विद्याथियों की संख्या में प्रतिशत वृद्धि इसके पिछले वर्ष की तुलना में सबसे अधिक है?
View Solution
